Attached files
| file | filename |
|---|---|
| EX-99.1 - EX-99.1 - Funko, Inc. | fnko-ex991_6.htm |
| 8-K - 8-K - Funko, Inc. | fnko-8k_20181108.htm |
Third Quarter 2018 Earnings November 8, 2018 Exhibit 99.2
Cautionary Notes This presentation contains forward-looking statements within the meaning of the Private Securities Litigation Reform Act of 1995. All statements other than statements of historical facts contained in this presentation, including statements regarding our future results of operations and financial position, anticipated effects of the refinancing our debt, industry dynamics, our mission, growth opportunities and business strategy and plans and our objectives for future operations, are forward-looking statements. The words “may,” “will,” “should,” “expects,” “plans,” “anticipates,” “could,” “intends,” “targets,” “projects,” “contemplates,” “believes,” “estimates,” “predicts,” “potential” or “continue” or the negative of these terms and similar expressions are intended to identify forward-looking statements. The forward-looking statements in this presentation are only predictions. We have based these forward-looking statements largely on our current expectations and projections about future events and financial trends that we believe may affect our business, financial condition and results of operations. Forward-looking statements involve known and unknown risks, uncertainties and other important factors that may cause our actual results, performance or achievements to be materially different from any future results, performance or achievements expressed or implied by the forward-looking statements, including without limitation our ability to maintain and realize the full value of our license agreements; the ongoing level of popularity of our products with consumers; changes in the retail industry and markets for our consumer products; our ability to maintain our relationships with retail customers and distributors; our ability to compete effectively; fluctuations in our gross margin; our dependence on content development and creation by third parties; our ability to develop and introduce products in a timely and cost-effective manner; risks relating to intellectual property; our ability to attract and retain qualified employees and maintain our corporate culture; risks associated with our international operations; changes in U.S. tax law; foreign currency exchange rate exposure; economic downturns; our dependence on vendors and outsourcers; risks relating to government regulation; risks relating to litigation; any failure to successfully integrate or realize the anticipated benefits of acquisitions or investments; reputational risk resulting from our e-commerce business and social media presence; risks relating to our indebtedness and our ability to secure additional financing; the potential for our electronic data to be compromised, and the important factors discussed under the caption “Risk Factors” in our Form 10-Q for the quarter ended September 30, 2018 and our other filings with the Securities and Exchange Commission. Because forward-looking statements are inherently subject to risks and uncertainties, some of which cannot be predicted or quantified, you should not rely on these forward-looking statements as predictions of future events. The events and circumstances reflected in our forward-looking statements may not be achieved or occur and actual results could differ materially from those projected in the forward-looking statements. In addition, statements that “we believe” and similar statements reflect our beliefs and opinions on the relevant subject. These statements are based upon information available to us as of the date hereof, and while we believe such information forms a reasonable basis for such statements, such information may be limited or incomplete, and our statements should not be read to indicate that we have conducted an exhaustive inquiry into, or review of, all potentially available relevant information. These statements are inherently uncertain and investors are cautioned not to unduly rely upon these statements. You should read this presentation with the understanding that our actual future results, levels of activity, performance and achievements may be materially different from what we expect. We qualify all of our forward-looking statements by these cautionary statements. These forward-looking statements speak only as of the date of this presentation, and except as otherwise required by law, we do not plan to publicly update or revise any forward-looking statements contained in this presentation, whether as a result of any new information, future events or otherwise. Unless otherwise indicated, information contained in this presentation concerning our industry, competitive position and the markets in which we operate is based on information from independent industry and research organizations, other third-party sources and management estimates. Management estimates are derived from publicly available information released by independent industry analysts and other third-party sources, as well as data from our internal research, and are based on assumptions made by us upon reviewing such data, and our experience in, and knowledge of, such industry and markets, which we believe to be reasonable. In addition, projections, assumptions and estimates of the future performance of the industry in which we operate and our future performance are necessarily subject to uncertainty and risk due to a variety of factors, including those described above. These and other factors could cause results to differ materially from those expressed in the estimates made by independent parties and by us.

is built on the principle that everyone is a fan of something
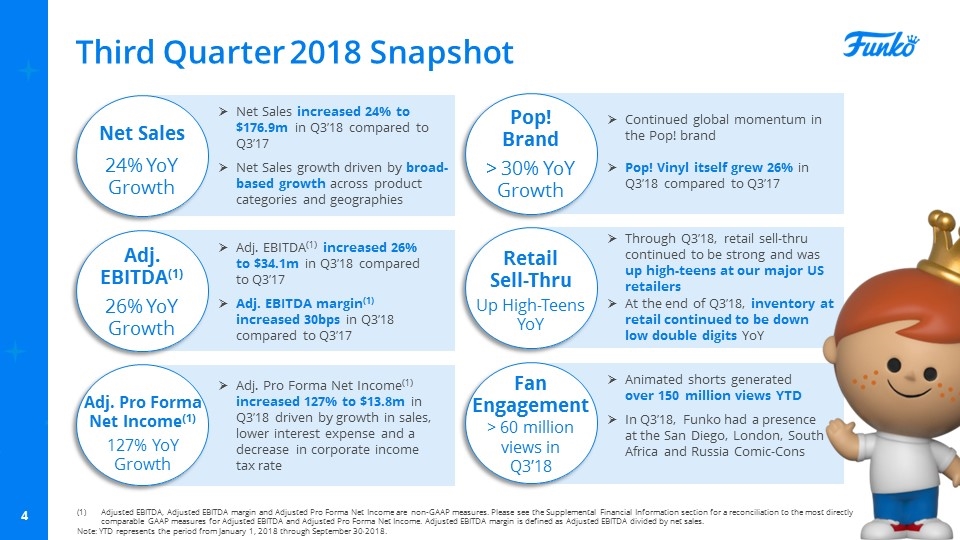
Third Quarter 2018 Snapshot Net Sales 24% YoY Growth Adj. EBITDA(1) 26% YoY Growth Adj. Pro Forma Net Income(1) 127% YoY Growth Net Sales increased 24% to $176.9m in Q3’18 compared to Q3’17 Net Sales growth driven by broad-based growth across product categories and geographies Pop! Brand > 30% YoY Growth Retail Sell-Thru Up High-Teens YoY Fan Engagement > 60 million views in Q3’18 Adj. EBITDA(1) increased 26% to $34.1m in Q3’18 compared to Q3’17 Adj. EBITDA margin(1) increased 30bps in Q3’18 compared to Q3’17 Adj. Pro Forma Net Income(1) increased 127% to $13.8m in Q3’18 driven by growth in sales, lower interest expense and a decrease in corporate income tax rate Continued global momentum in the Pop! brand Pop! Vinyl itself grew 26% in Q3’18 compared to Q3’17 Through Q3’18, retail sell-thru continued to be strong and was up high-teens at our major US retailers At the end of Q3’18, inventory at retail continued to be down low double digits YoY Animated shorts generated over 150 million views YTD In Q3’18, Funko had a presence at the San Diego, London, South Africa and Russia Comic-Cons Adjusted EBITDA, Adjusted EBITDA margin and Adjusted Pro Forma Net Income are non-GAAP measures. Please see the Supplemental Financial Information section for a reconciliation to the most directly comparable GAAP measures for Adjusted EBITDA and Adjusted Pro Forma Net Income. Adjusted EBITDA margin is defined as Adjusted EBITDA divided by net sales. Note: YTD represents the period from January 1, 2018 through September 30, 2018.
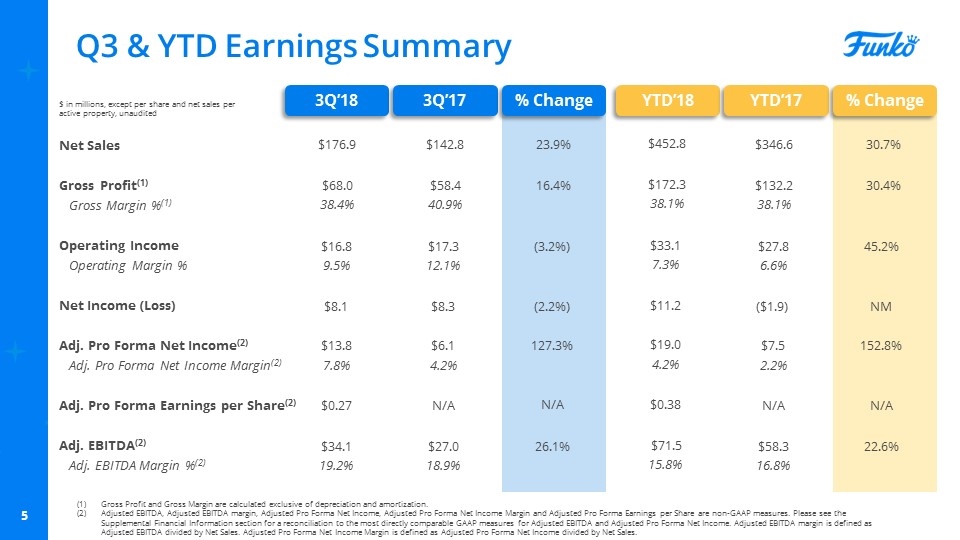
Q3 & YTD Earnings Summary 3Q’18 3Q’17 % Change YTD’18 YTD’17 % Change Net Sales Gross Profit(1) Gross Margin %(1) Operating Income Operating Margin % Net Income (Loss) Adj. Pro Forma Net Income(2) Adj. Pro Forma Net Income Margin(2) Adj. Pro Forma Earnings per Share(2) Adj. EBITDA(2) Adj. EBITDA Margin %(2) $ in millions, except per share and net sales per active property, unaudited $176.9 $142.8 23.9% $452.8 $346.6 30.7% $68.0 $58.4 16.4% $172.3 $132.2 30.4% 38.4% 40.9% 38.1% 38.1% $16.8 $17.3 (3.2%) $33.1 $27.8 45.2% 9.5% 12.1% 7.3% 6.6% $0.27 N/A N/A $0.38 N/A N/A $34.1 $27.0 26.1% $71.5 $58.3 22.6% 19.2% 18.9% 15.8% 16.8% $13.8 $6.1 127.3% $19.0 $7.5 152.8% Gross Profit and Gross Margin are calculated exclusive of depreciation and amortization. Adjusted EBITDA, Adjusted EBITDA margin, Adjusted Pro Forma Net Income, Adjusted Pro Forma Net Income Margin and Adjusted Pro Forma Earnings per Share are non-GAAP measures. Please see the Supplemental Financial Information section for a reconciliation to the most directly comparable GAAP measures for Adjusted EBITDA and Adjusted Pro Forma Net Income. Adjusted EBITDA margin is defined as Adjusted EBITDA divided by Net Sales. Adjusted Pro Forma Net Income Margin is defined as Adjusted Pro Forma Net Income divided by Net Sales. 7.8% 4.2% 4.2% 2.2% $8.1 $8.3 (2.2%) $11.2 ($1.9) NM
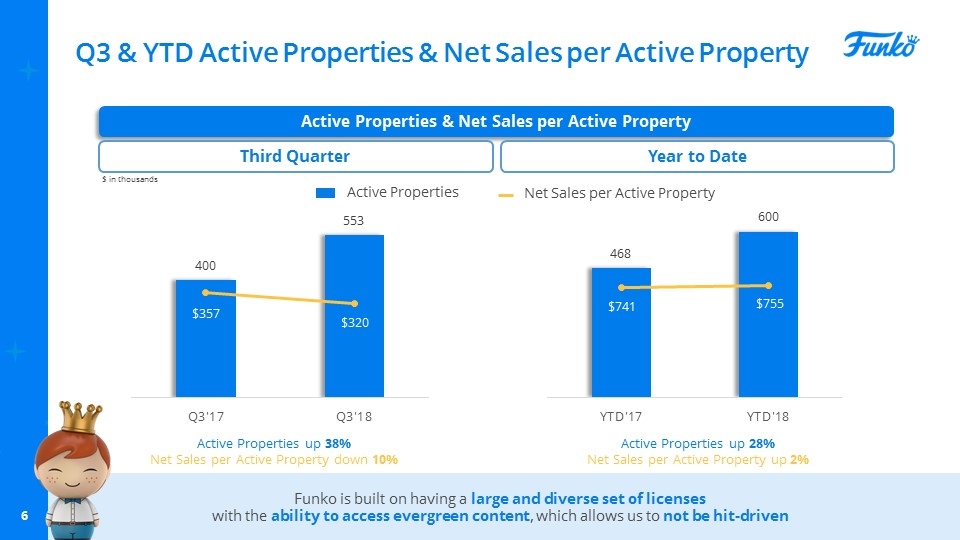
Q3 & YTD Active Properties & Net Sales per Active Property Active Properties & Net Sales per Active Property Third Quarter Year to Date Active Properties Net Sales per Active Property Active Properties up 38% Net Sales per Active Property down 10% Active Properties up 28% Net Sales per Active Property up 2% Funko is built on having a large and diverse set of licenses with the ability to access evergreen content, which allows us to not be hit-driven $ in thousands
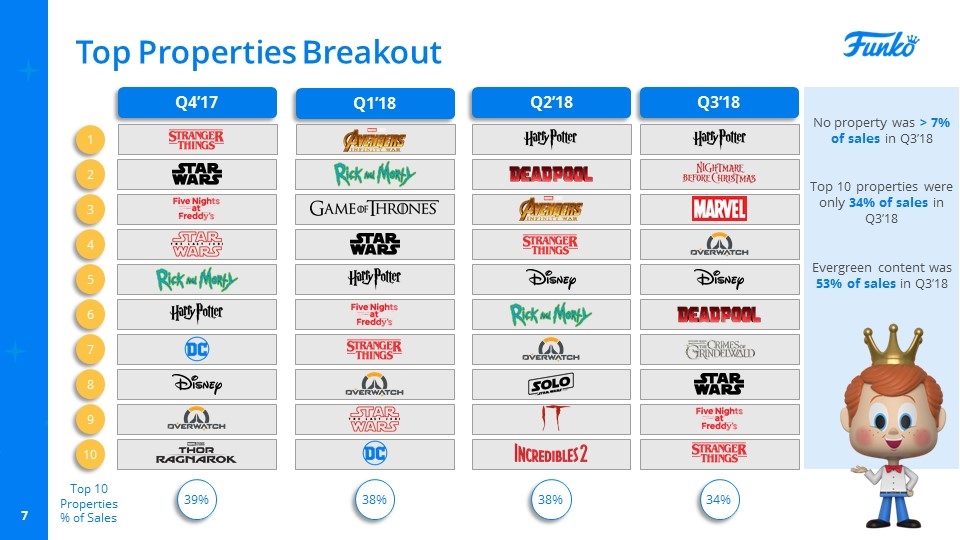
Top Properties Breakout Q4’17 Q1’18 Q2’18 Q3’18 1 2 3 5 7 4 6 8 9 10 Top 10 Properties % of Sales 39% 38% 38% 34% No property was > 7% of sales in Q3’18 Top 10 properties were only 34% of sales in Q3’18 Evergreen content was 53% of sales in Q3’18
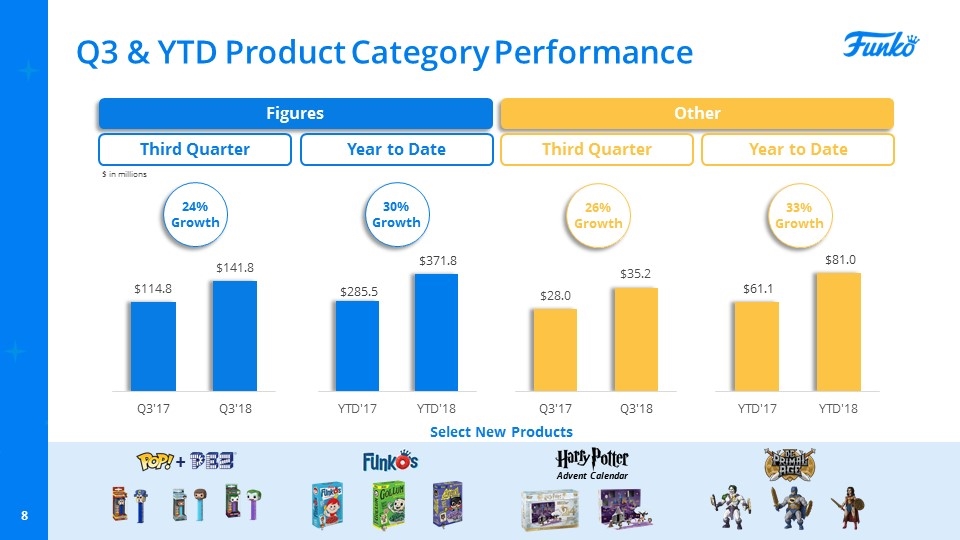
Q3 & YTD Product Category Performance Figures Other Third Quarter Year to Date Third Quarter Year to Date Select New Products + Advent Calendar $ in millions 24% Growth 30% Growth 33% Growth 26% Growth
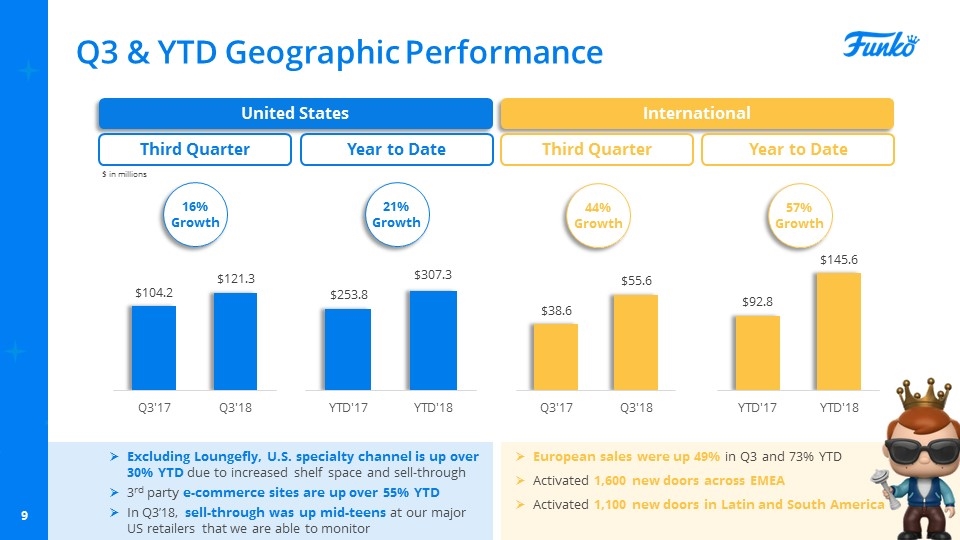
Q3 & YTD Geographic Performance United States International Third Quarter Year to Date Third Quarter Year to Date Excluding Loungefly, U.S. specialty channel is up over 30% YTD due to increased shelf space and sell-through 3rd party e-commerce sites are up over 55% YTD In Q3’18, sell-through was up mid-teens at our major US retailers that we are able to monitor European sales were up 49% in Q3 and 73% YTD Activated 1,600 new doors across EMEA Activated 1,100 new doors in Latin and South America $ in millions 16% Growth 21% Growth 57% Growth 44% Growth

Activation
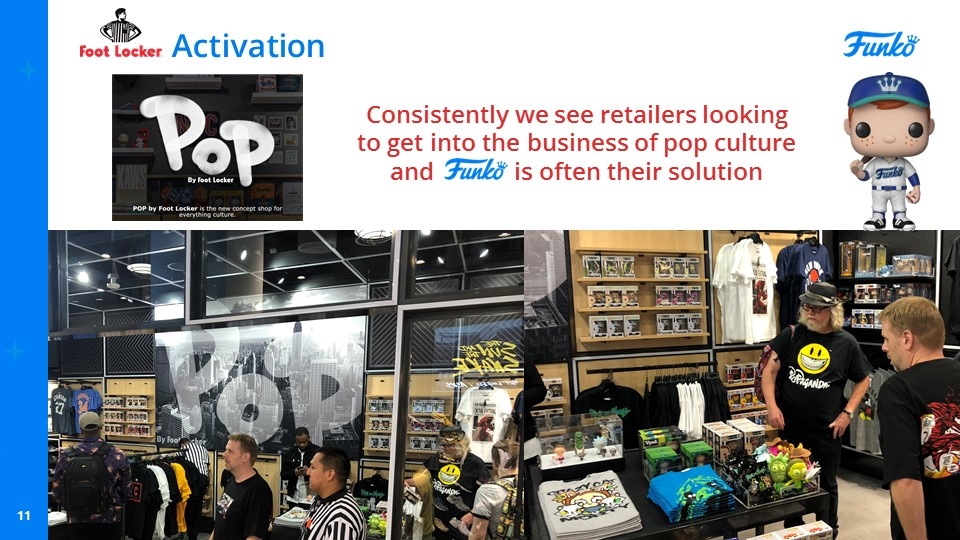
Activation Consistently we see retailers looking to get into the business of pop culture and is often their solution
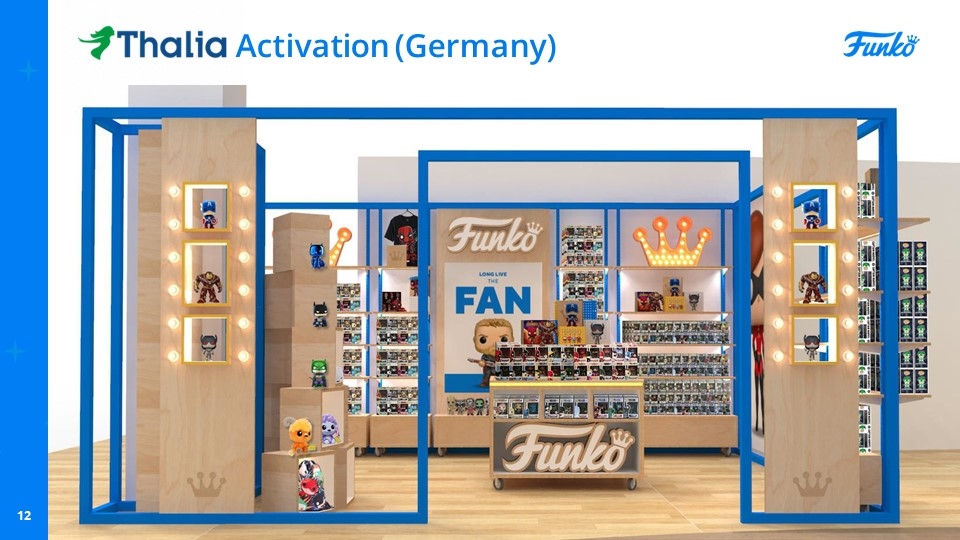
Activation (Germany)
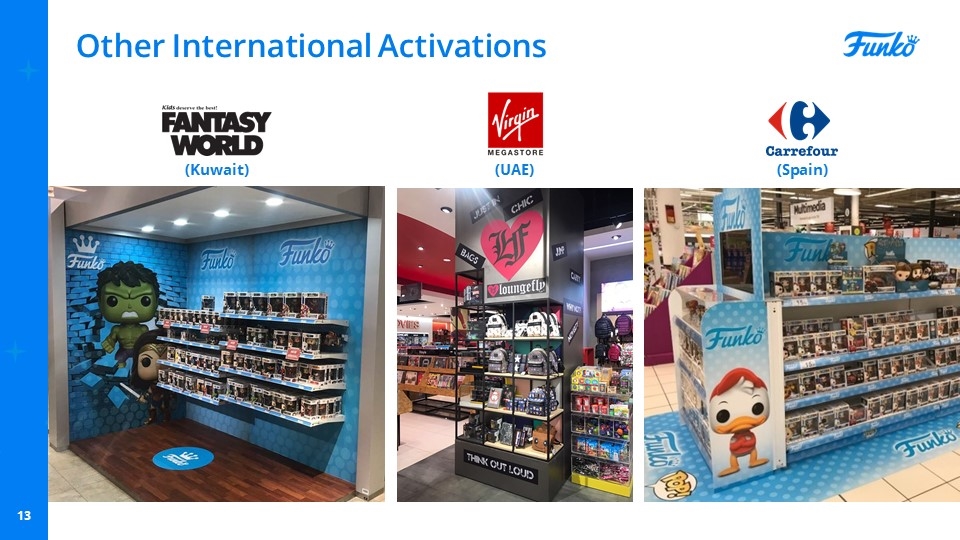
Other International Activations (Kuwait) (UAE) (Spain)
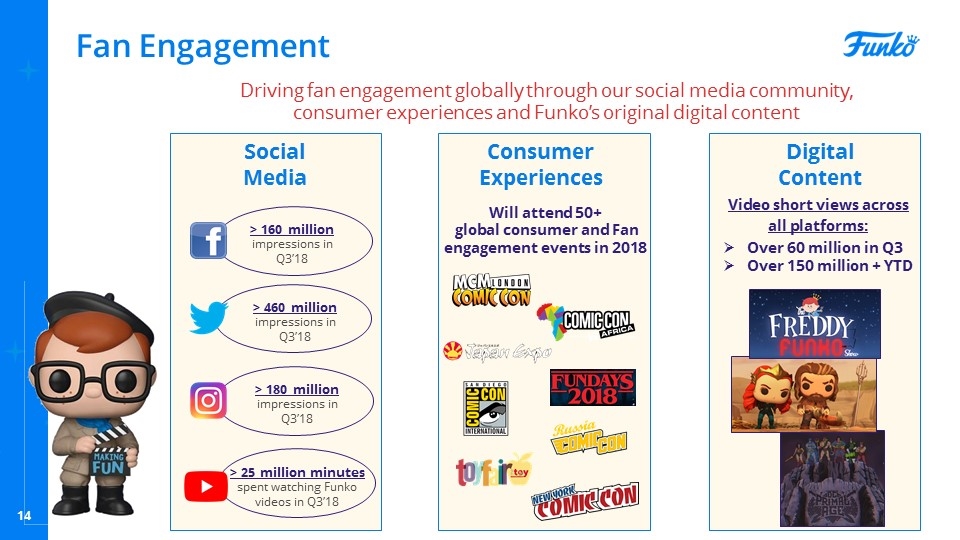
Fan Engagement Will attend 50+ global consumer and Fan engagement events in 2018 Video short views across all platforms: Over 60 million in Q3 Over 150 million + YTD > 160 million impressions in Q3’18 > 460 million impressions in Q3’18 > 180 million impressions in Q3’18 > 25 million minutes spent watching Funko videos in Q3’18 Social Media Consumer Experiences Digital Content Driving fan engagement globally through our social media community, consumer experiences and Funko’s original digital content
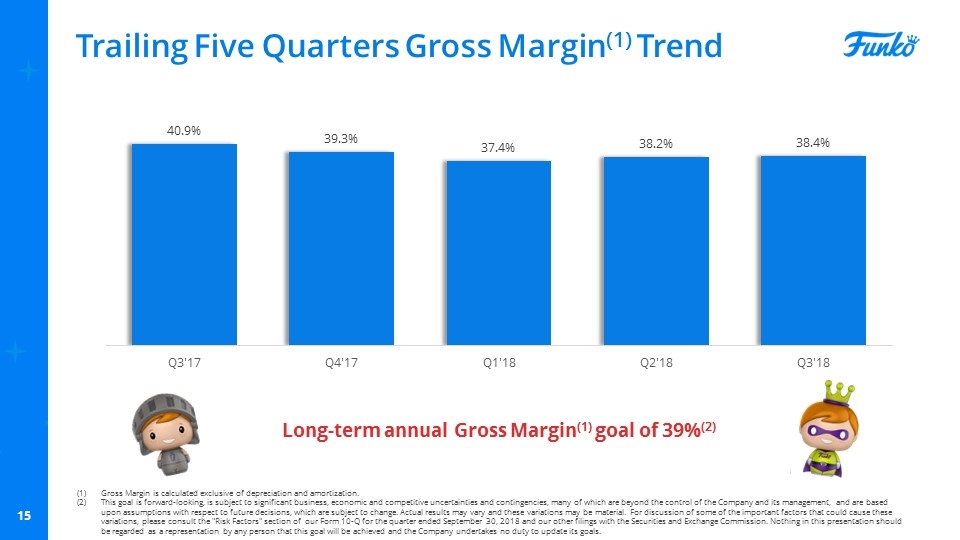
Trailing Five Quarters Gross Margin(1) Trend Long-term annual Gross Margin(1) goal of 39%(2) Gross Margin is calculated exclusive of depreciation and amortization. This goal is forward-looking, is subject to significant business, economic and competitive uncertainties and contingencies, many of which are beyond the control of the Company and its management, and are based upon assumptions with respect to future decisions, which are subject to change. Actual results may vary and these variations may be material. For discussion of some of the important factors that could cause these variations, please consult the "Risk Factors" section of our Form 10-Q for the quarter ended September 30, 2018 and our other filings with the Securities and Exchange Commission. Nothing in this presentation should be regarded as a representation by any person that this goal will be achieved and the Company undertakes no duty to update its goals.
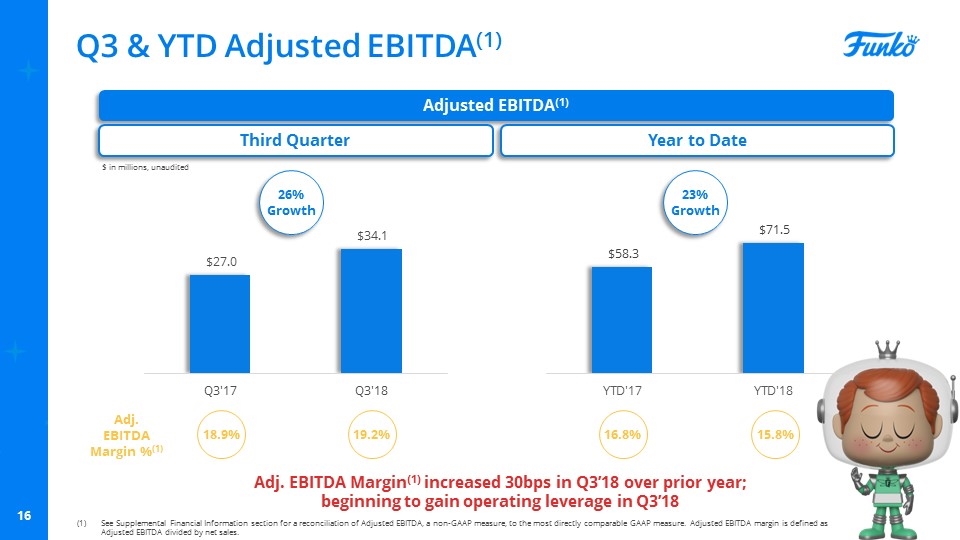
Q3 & YTD Adjusted EBITDA(1) Adjusted EBITDA(1) Third Quarter Year to Date Adj. EBITDA Margin %(1) 18.9% 19.2% 16.8% 15.8% $ in millions, unaudited Adj. EBITDA Margin(1) increased 30bps in Q3’18 over prior year; beginning to gain operating leverage in Q3’18 See Supplemental Financial Information section for a reconciliation of Adjusted EBITDA, a non-GAAP measure, to the most directly comparable GAAP measure. Adjusted EBITDA margin is defined as Adjusted EBITDA divided by net sales. 26% Growth 23% Growth
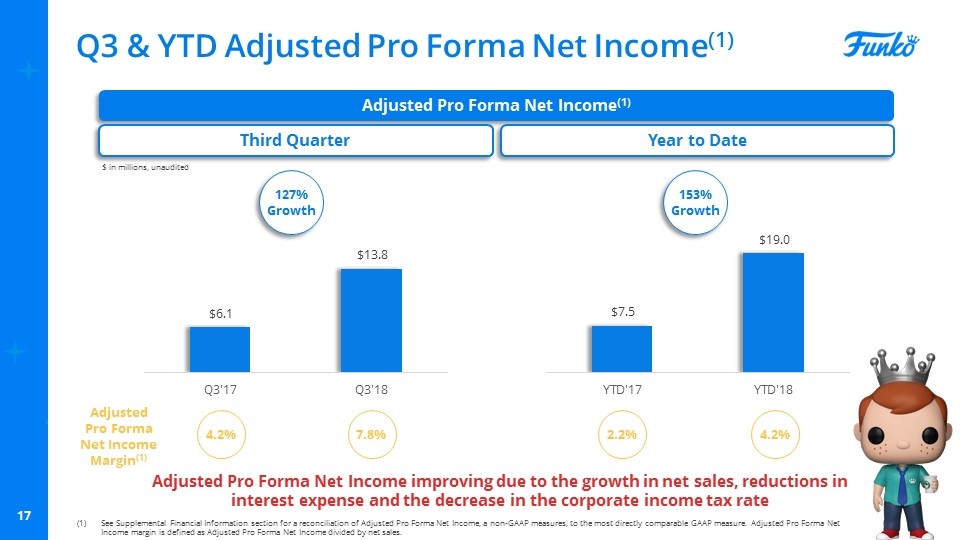
Q3 & YTD Adjusted Pro Forma Net Income(1) Adjusted Pro Forma Net Income(1) Third Quarter Year to Date Adjusted Pro Forma Net Income Margin(1) 4.2% 7.8% 2.2% 4.2% $ in millions, unaudited Adjusted Pro Forma Net Income improving due to the growth in net sales, reductions in interest expense and the decrease in the corporate income tax rate See Supplemental Financial Information section for a reconciliation of Adjusted Pro Forma Net Income, a non-GAAP measures, to the most directly comparable GAAP measure. Adjusted Pro Forma Net Income margin is defined as Adjusted Pro Forma Net Income divided by net sales. 127% Growth 153% Growth
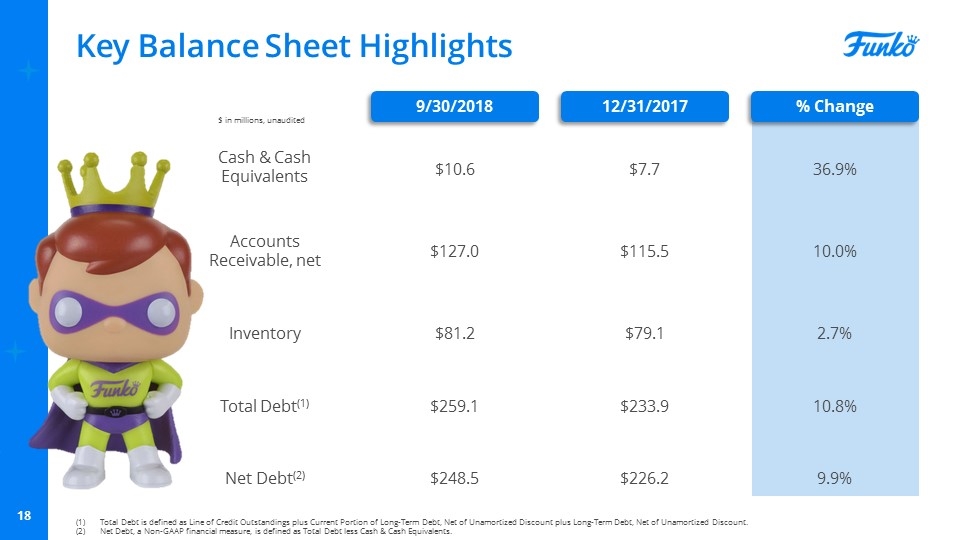
Key Balance Sheet Highlights 9/30/2018 12/31/2017 % Change Cash & Cash Equivalents Accounts Receivable, net Inventory Total Debt(1) $10.6 $127.0 $81.2 $259.1 $ in millions, unaudited Net Debt(2) $248.5 $7.7 $115.5 $79.1 $233.9 $226.2 36.9% 10.0% 2.7% 10.8% 9.9% Total Debt is defined as Line of Credit Outstandings plus Current Portion of Long-Term Debt, Net of Unamortized Discount plus Long-Term Debt, Net of Unamortized Discount. Net Debt, a Non-GAAP financial measure, is defined as Total Debt less Cash & Cash Equivalents.
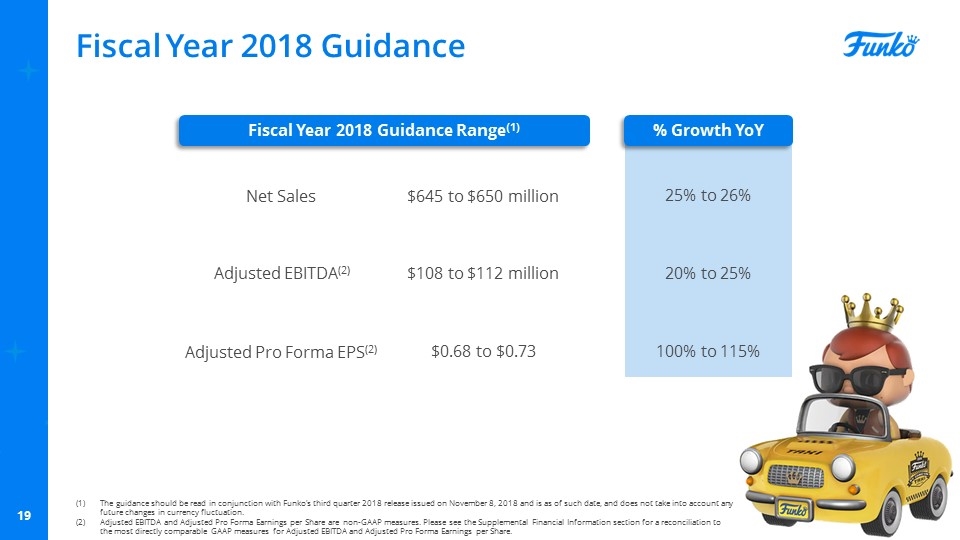
Fiscal Year 2018 Guidance Fiscal Year 2018 Guidance Range(1) % Growth YoY Net Sales Adjusted EBITDA(2) Adjusted Pro Forma EPS(2) $645 to $650 million $108 to $112 million $0.68 to $0.73 25% to 26% 20% to 25% 100% to 115% The guidance should be read in conjunction with Funko’s third quarter 2018 release issued on November 8, 2018 and is as of such date, and does not take into account any future changes in currency fluctuation. Adjusted EBITDA and Adjusted Pro Forma Earnings per Share are non-GAAP measures. Please see the Supplemental Financial Information section for a reconciliation to the most directly comparable GAAP measures for Adjusted EBITDA and Adjusted Pro Forma Earnings per Share.
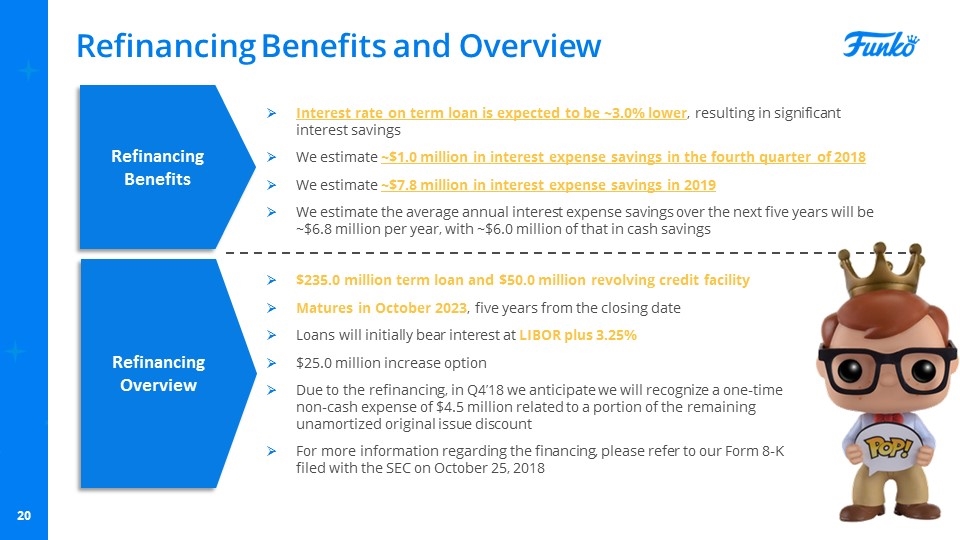
Refinancing Benefits and Overview $235.0 million term loan and $50.0 million revolving credit facility Matures in October 2023, five years from the closing date Loans will initially bear interest at LIBOR plus 3.25% $25.0 million increase option Due to the refinancing, in Q4’18 we anticipate we will recognize a one-time non-cash expense of $4.5 million related to a portion of the remaining unamortized original issue discount For more information regarding the financing, please refer to our Form 8-K filed with the SEC on October 25, 2018 Refinancing Overview Refinancing Benefits Interest rate on term loan is expected to be ~3.0% lower, resulting in significant interest savings We estimate ~$1.0 million in interest expense savings in the fourth quarter of 2018 We estimate ~$7.8 million in interest expense savings in 2019 We estimate the average annual interest expense savings over the next five years will be ~$6.8 million per year, with ~$6.0 million of that in cash savings

Supplemental Financial Information
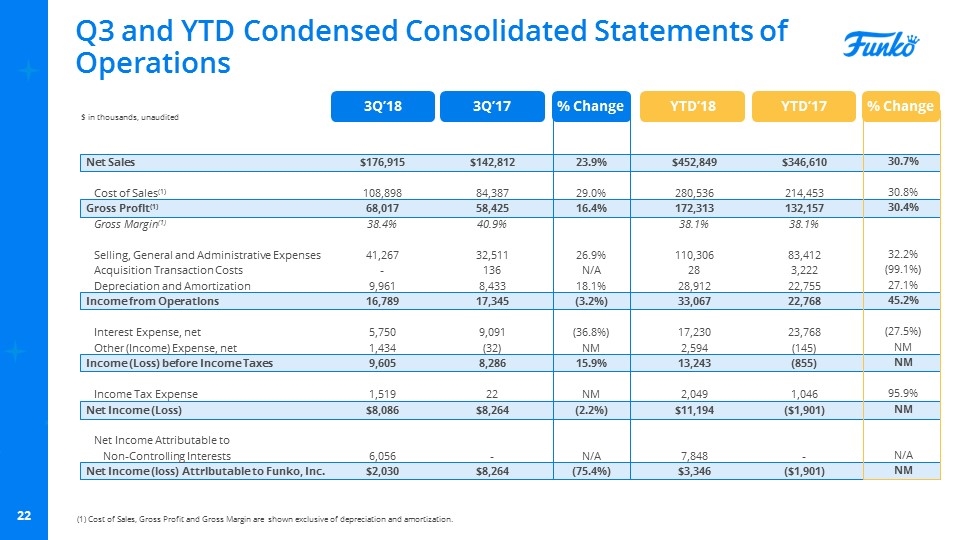
Q3 and YTD Condensed Consolidated Statements of Operations $176,915 108,898 68,017 38.4% 41,267 - 9,961 16,789 5,750 1,434 9,605 1,519 $8,086 6,056 $2,030 $ in thousands, unaudited Net Sales Cost of Sales(1) Gross Profit(1) Gross Margin(1) Selling, General and Administrative Expenses Acquisition Transaction Costs Depreciation and Amortization Income from Operations Interest Expense, net Other (Income) Expense, net Income (Loss) before Income Taxes Income Tax Expense Net Income (Loss) Net Income Attributable to Non-Controlling Interests Net Income (loss) Attributable to Funko, Inc. $142,812 84,387 58,425 40.9% 32,511 136 8,433 17,345 9,091 (32) 8,286 22 $8,264 - $8,264 $452,849 280,536 172,313 38.1% 110,306 28 28,912 33,067 17,230 2,594 13,243 2,049 $11,194 7,848 $3,346 $346,610 214,453 132,157 38.1% 83,412 3,222 22,755 22,768 23,768 (145) (855) 1,046 ($1,901) - ($1,901) 3Q’18 3Q’17 YTD’18 YTD’17 % Change % Change 23.9% 29.0% 16.4% 26.9% N/A 18.1% (3.2%) (36.8%) NM 15.9% NM (2.2%) N/A (75.4%) 30.7% 30.8% 30.4% 32.2% (99.1%) 27.1% 45.2% (27.5%) NM NM 95.9% NM N/A NM (1) Cost of Sales, Gross Profit and Gross Margin are shown exclusive of depreciation and amortization.
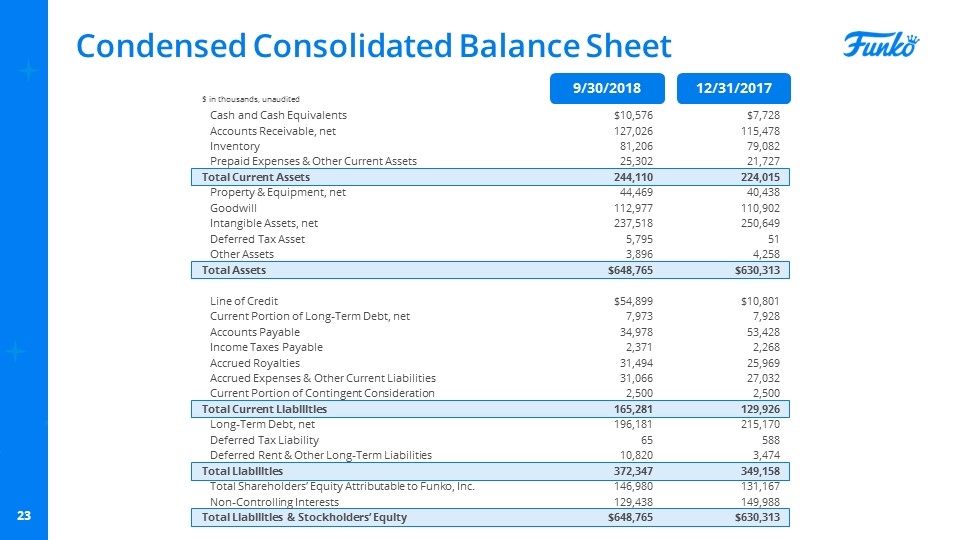
Condensed Consolidated Balance Sheet 9/30/2018 12/31/2017 Cash and Cash Equivalents Accounts Receivable, net Inventory Prepaid Expenses & Other Current Assets Total Current Assets Property & Equipment, net Goodwill Intangible Assets, net Deferred Tax Asset Other Assets Total Assets Line of Credit Current Portion of Long-Term Debt, net Accounts Payable Income Taxes Payable Accrued Royalties Accrued Expenses & Other Current Liabilities Current Portion of Contingent Consideration Total Current Liabilities Long-Term Debt, net Deferred Tax Liability Deferred Rent & Other Long-Term Liabilities Total Liabilities Total Shareholders’ Equity Attributable to Funko, Inc. Non-Controlling Interests Total Liabilities & Stockholders’ Equity $ in thousands, unaudited $10,576 127,026 81,206 25,302 244,110 44,469 112,977 237,518 5,795 3,896 $648,765 $54,899 7,973 34,978 2,371 31,494 31,066 2,500 165,281 196,181 65 10,820 372,347 146,980 129,438 $648,765 $7,728 115,478 79,082 21,727 224,015 40,438 110,902 250,649 51 4,258 $630,313 $10,801 7,928 53,428 2,268 25,969 27,032 2,500 129,926 215,170 588 3,474 349,158 131,167 149,988 $630,313
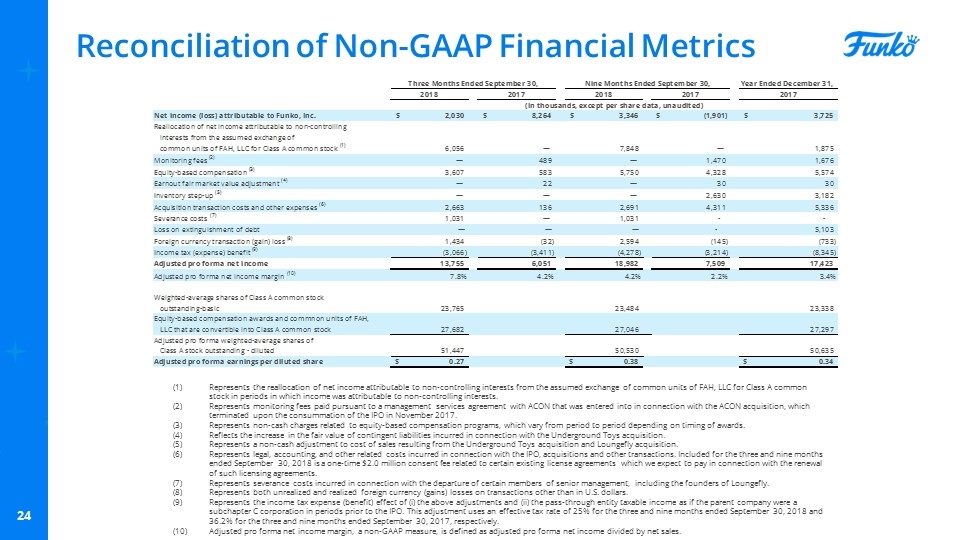
Reconciliation of Non-GAAP Financial Metrics Represents the reallocation of net income attributable to non-controlling interests from the assumed exchange of common units of FAH, LLC for Class A common stock in periods in which income was attributable to non-controlling interests. Represents monitoring fees paid pursuant to a management services agreement with ACON that was entered into in connection with the ACON acquisition, which terminated upon the consummation of the IPO in November 2017. Represents non-cash charges related to equity-based compensation programs, which vary from period to period depending on timing of awards. Reflects the increase in the fair value of contingent liabilities incurred in connection with the Underground Toys acquisition. Represents a non-cash adjustment to cost of sales resulting from the Underground Toys acquisition and Loungefly acquisition. Represents legal, accounting, and other related costs incurred in connection with the IPO, acquisitions and other transactions. Included for the three and nine months ended September 30, 2018 is a one-time $2.0 million consent fee related to certain existing license agreements which we expect to pay in connection with the renewal of such licensing agreements. Represents severance costs incurred in connection with the departure of certain members of senior management, including the founders of Loungefly. Represents both unrealized and realized foreign currency (gains) losses on transactions other than in U.S. dollars. Represents the income tax expense (benefit) effect of (i) the above adjustments and (ii) the pass-through entity taxable income as if the parent company were a subchapter C corporation in periods prior to the IPO. This adjustment uses an effective tax rate of 25% for the three and nine months ended September 30, 2018 and 36.2% for the three and nine months ended September 30, 2017, respectively. Adjusted pro forma net income margin, a non-GAAP measure, is defined as adjusted pro forma net income divided by net sales.
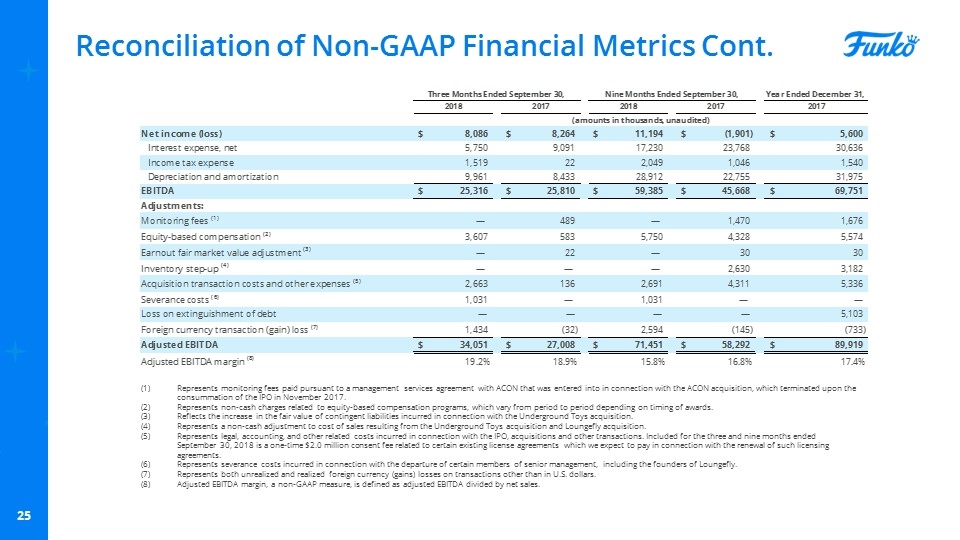
Reconciliation of Non-GAAP Financial Metrics Cont. Represents monitoring fees paid pursuant to a management services agreement with ACON that was entered into in connection with the ACON acquisition, which terminated upon the consummation of the IPO in November 2017. Represents non-cash charges related to equity-based compensation programs, which vary from period to period depending on timing of awards. Reflects the increase in the fair value of contingent liabilities incurred in connection with the Underground Toys acquisition. Represents a non-cash adjustment to cost of sales resulting from the Underground Toys acquisition and Loungefly acquisition. Represents legal, accounting, and other related costs incurred in connection with the IPO, acquisitions and other transactions. Included for the three and nine months ended September 30, 2018 is a one-time $2.0 million consent fee related to certain existing license agreements which we expect to pay in connection with the renewal of such licensing agreements. Represents severance costs incurred in connection with the departure of certain members of senior management, including the founders of Loungefly. Represents both unrealized and realized foreign currency (gains) losses on transactions other than in U.S. dollars. Adjusted EBITDA margin, a non-GAAP measure, is defined as adjusted EBITDA divided by net sales. 3Q’18
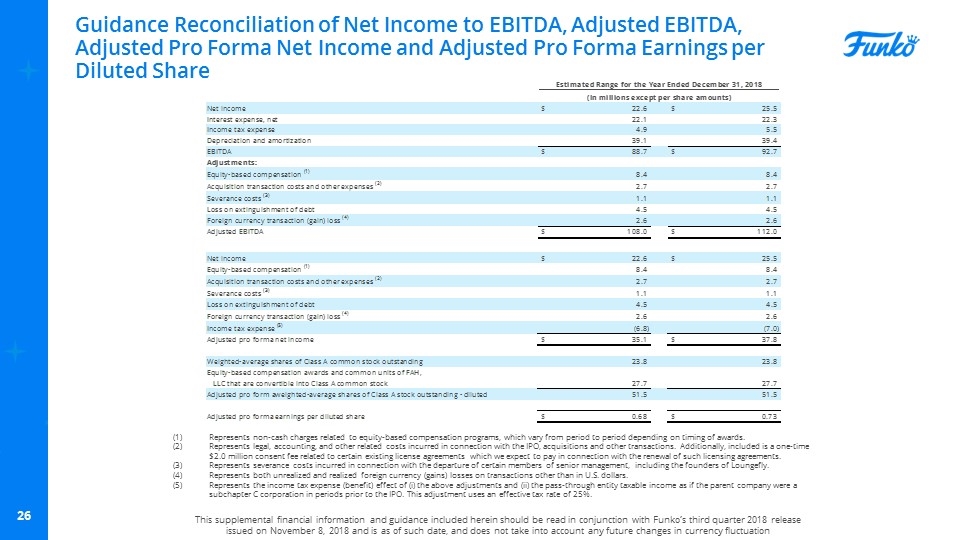
Guidance Reconciliation of Net Income to EBITDA, Adjusted EBITDA, Adjusted Pro Forma Net Income and Adjusted Pro Forma Earnings per Diluted Share Represents non-cash charges related to equity-based compensation programs, which vary from period to period depending on timing of awards. Represents legal, accounting, and other related costs incurred in connection with the IPO, acquisitions and other transactions. Additionally, included is a one-time $2.0 million consent fee related to certain existing license agreements which we expect to pay in connection with the renewal of such licensing agreements. Represents severance costs incurred in connection with the departure of certain members of senior management, including the founders of Loungefly. Represents both unrealized and realized foreign currency (gains) losses on transactions other than in U.S. dollars. Represents the income tax expense (benefit) effect of (i) the above adjustments and (ii) the pass-through entity taxable income as if the parent company were a subchapter C corporation in periods prior to the IPO. This adjustment uses an effective tax rate of 25%. This supplemental financial information and guidance included herein should be read in conjunction with Funko’s third quarter 2018 release issued on November 8, 2018 and is as of such date, and does not take into account any future changes in currency fluctuation

