Attached files
| file | filename |
|---|---|
| 8-K - FORM 8-K - CITIZENS FINANCIAL GROUP INC/RI | d638806d8k.htm |
BancAnalysts Association of Boston Conference John F. Woods Chief Financial Officer Brendan Coughlin President of Consumer Deposits and Lending Beth Johnson Chief Marketing Officer and Head of Virtual Channels November 8, 2018 Exhibit 99.1
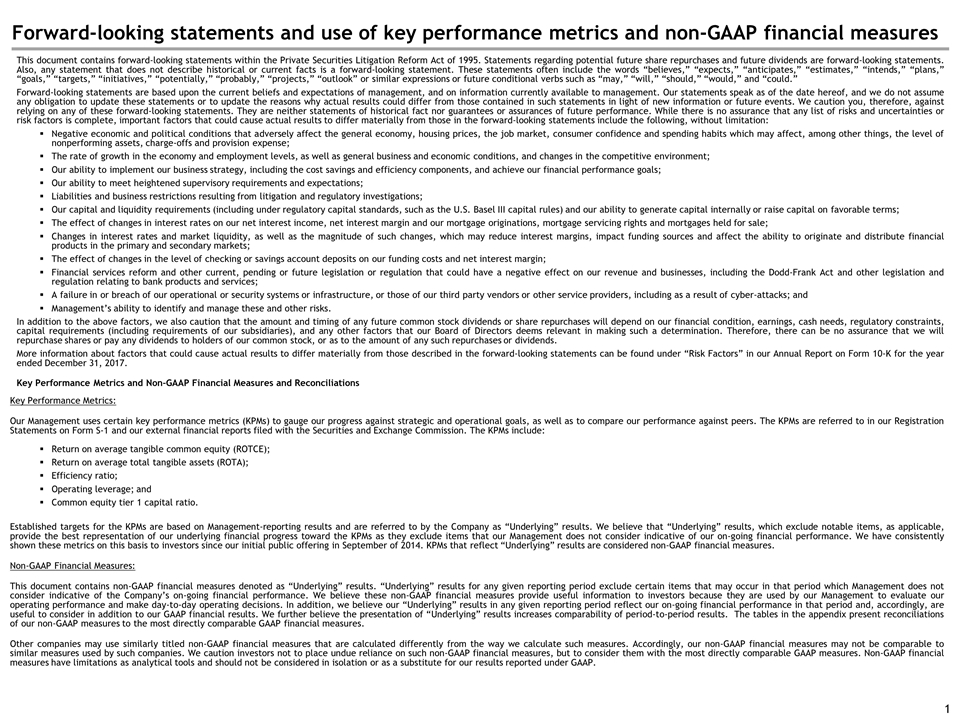
Forward-looking statements and use of key performance metrics and non-GAAP financial measures This document contains forward-looking statements within the Private Securities Litigation Reform Act of 1995. Statements regarding potential future share repurchases and future dividends are forward-looking statements. Also, any statement that does not describe historical or current facts is a forward-looking statement. These statements often include the words “believes,” “expects,” “anticipates,” “estimates,” “intends,” “plans,” “goals,” “targets,” “initiatives,” “potentially,” “probably,” “projects,” “outlook” or similar expressions or future conditional verbs such as “may,” “will,” “should,” “would,” and “could.” Forward-looking statements are based upon the current beliefs and expectations of management, and on information currently available to management. Our statements speak as of the date hereof, and we do not assume any obligation to update these statements or to update the reasons why actual results could differ from those contained in such statements in light of new information or future events. We caution you, therefore, against relying on any of these forward-looking statements. They are neither statements of historical fact nor guarantees or assurances of future performance. While there is no assurance that any list of risks and uncertainties or risk factors is complete, important factors that could cause actual results to differ materially from those in the forward-looking statements include the following, without limitation: Negative economic and political conditions that adversely affect the general economy, housing prices, the job market, consumer confidence and spending habits which may affect, among other things, the level of nonperforming assets, charge-offs and provision expense; The rate of growth in the economy and employment levels, as well as general business and economic conditions, and changes in the competitive environment; Our ability to implement our business strategy, including the cost savings and efficiency components, and achieve our financial performance goals; Our ability to meet heightened supervisory requirements and expectations; Liabilities and business restrictions resulting from litigation and regulatory investigations; Our capital and liquidity requirements (including under regulatory capital standards, such as the U.S. Basel III capital rules) and our ability to generate capital internally or raise capital on favorable terms; The effect of changes in interest rates on our net interest income, net interest margin and our mortgage originations, mortgage servicing rights and mortgages held for sale; Changes in interest rates and market liquidity, as well as the magnitude of such changes, which may reduce interest margins, impact funding sources and affect the ability to originate and distribute financial products in the primary and secondary markets; The effect of changes in the level of checking or savings account deposits on our funding costs and net interest margin; Financial services reform and other current, pending or future legislation or regulation that could have a negative effect on our revenue and businesses, including the Dodd-Frank Act and other legislation and regulation relating to bank products and services; A failure in or breach of our operational or security systems or infrastructure, or those of our third party vendors or other service providers, including as a result of cyber-attacks; and Management’s ability to identify and manage these and other risks. In addition to the above factors, we also caution that the amount and timing of any future common stock dividends or share repurchases will depend on our financial condition, earnings, cash needs, regulatory constraints, capital requirements (including requirements of our subsidiaries), and any other factors that our Board of Directors deems relevant in making such a determination. Therefore, there can be no assurance that we will repurchase shares or pay any dividends to holders of our common stock, or as to the amount of any such repurchases or dividends. More information about factors that could cause actual results to differ materially from those described in the forward-looking statements can be found under “Risk Factors” in our Annual Report on Form 10-K for the year ended December 31, 2017. Key Performance Metrics and Non-GAAP Financial Measures and Reconciliations Key Performance Metrics: Our Management uses certain key performance metrics (KPMs) to gauge our progress against strategic and operational goals, as well as to compare our performance against peers. The KPMs are referred to in our Registration Statements on Form S-1 and our external financial reports filed with the Securities and Exchange Commission. The KPMs include: Return on average tangible common equity (ROTCE); Return on average total tangible assets (ROTA); Efficiency ratio; Operating leverage; and Common equity tier 1 capital ratio. Established targets for the KPMs are based on Management-reporting results and are referred to by the Company as “Underlying” results. We believe that “Underlying” results, which exclude notable items, as applicable, provide the best representation of our underlying financial progress toward the KPMs as they exclude items that our Management does not consider indicative of our on-going financial performance. We have consistently shown these metrics on this basis to investors since our initial public offering in September of 2014. KPMs that reflect “Underlying” results are considered non-GAAP financial measures. Non-GAAP Financial Measures: This document contains non-GAAP financial measures denoted as “Underlying” results. “Underlying” results for any given reporting period exclude certain items that may occur in that period which Management does not consider indicative of the Company’s on-going financial performance. We believe these non-GAAP financial measures provide useful information to investors because they are used by our Management to evaluate our operating performance and make day-to-day operating decisions. In addition, we believe our “Underlying” results in any given reporting period reflect our on-going financial performance in that period and, accordingly, are useful to consider in addition to our GAAP financial results. We further believe the presentation of “Underlying” results increases comparability of period-to-period results. The tables in the appendix present reconciliations of our non-GAAP measures to the most directly comparable GAAP financial measures. Other companies may use similarly titled non-GAAP financial measures that are calculated differently from the way we calculate such measures. Accordingly, our non-GAAP financial measures may not be comparable to similar measures used by such companies. We caution investors not to place undue reliance on such non-GAAP financial measures, but to consider them with the most directly comparable GAAP measures. Non-GAAP financial measures have limitations as analytical tools and should not be considered in isolation or as a substitute for our results reported under GAAP.
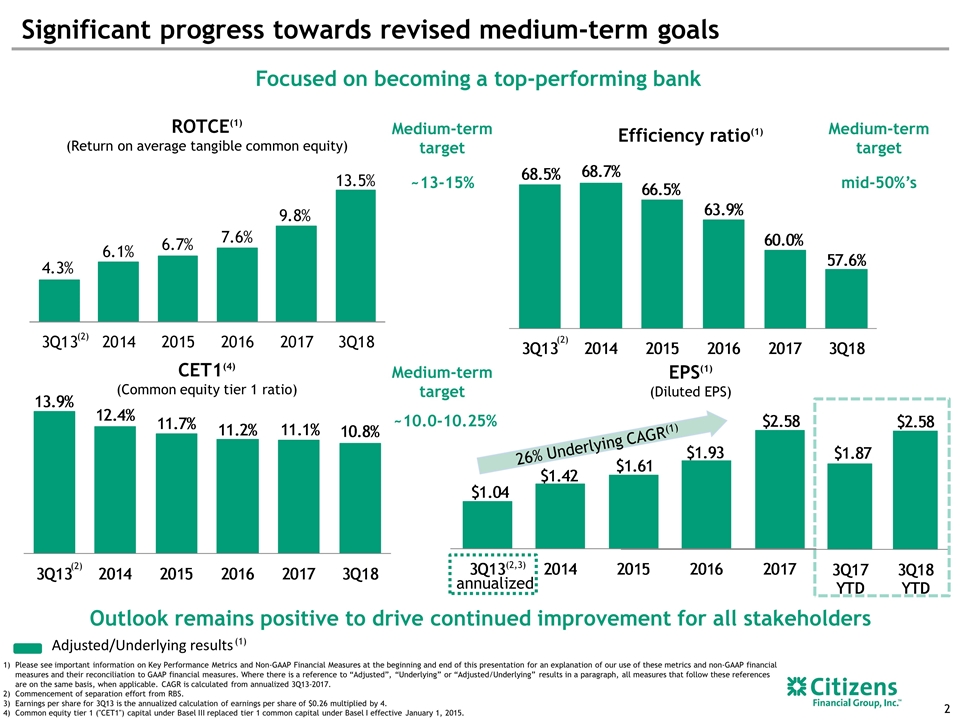
annualized Efficiency ratio(1) mid-50%’s Significant progress towards revised medium-term goals ROTCE(1) (Return on average tangible common equity) (2) Medium-term target Adjusted/Underlying results (1) (2) (2,3) CET1(4) (Common equity tier 1 ratio) Medium-term target (2) EPS(1) (Diluted EPS) Outlook remains positive to drive continued improvement for all stakeholders ~13-15% Medium-term target ~10.0-10.25% 26% Underlying CAGR(1) Please see important information on Key Performance Metrics and Non-GAAP Financial Measures at the beginning and end of this presentation for an explanation of our use of these metrics and non-GAAP financial measures and their reconciliation to GAAP financial measures. Where there is a reference to “Adjusted”, “Underlying” or “Adjusted/Underlying” results in a paragraph, all measures that follow these references are on the same basis, when applicable. CAGR is calculated from annualized 3Q13-2017. Commencement of separation effort from RBS. Earnings per share for 3Q13 is the annualized calculation of earnings per share of $0.26 multiplied by 4. Common equity tier 1 ("CET1") capital under Basel III replaced tier 1 common capital under Basel I effective January 1, 2015. Focused on becoming a top-performing bank
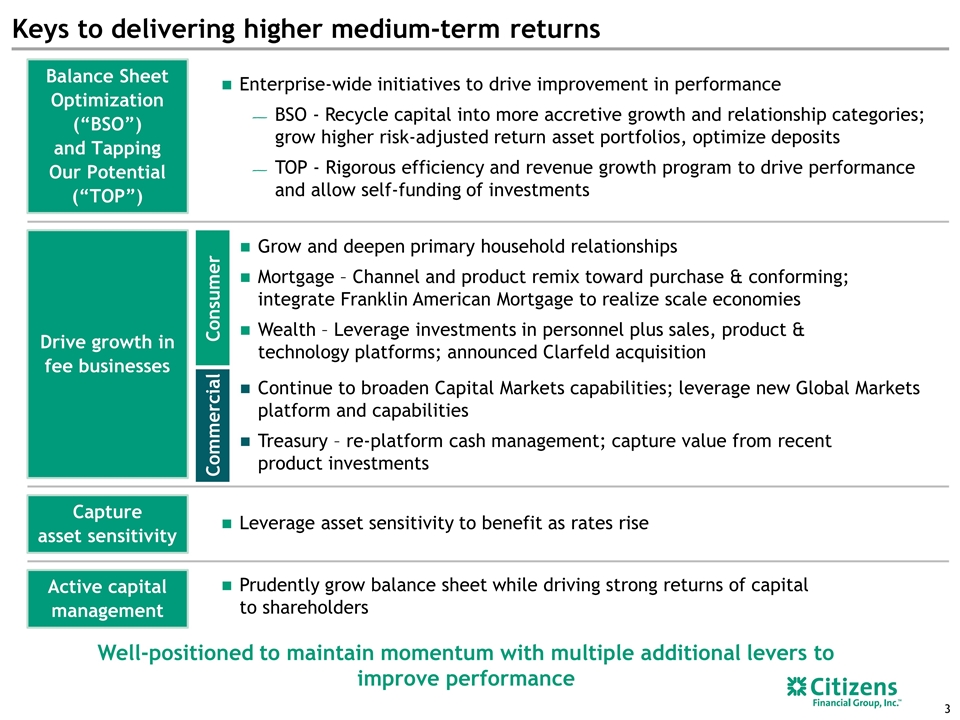
Keys to delivering higher medium-term returns Balance Sheet Optimization (“BSO”) and Tapping Our Potential (“TOP”) Drive growth in fee businesses Active capital management Enterprise-wide initiatives to drive improvement in performance BSO - Recycle capital into more accretive growth and relationship categories; grow higher risk-adjusted return asset portfolios, optimize deposits TOP - Rigorous efficiency and revenue growth program to drive performance and allow self-funding of investments Prudently grow balance sheet while driving strong returns of capital to shareholders Capture asset sensitivity Leverage asset sensitivity to benefit as rates rise Well-positioned to maintain momentum with multiple additional levers to improve performance Consumer Grow and deepen primary household relationships Mortgage – Channel and product remix toward purchase & conforming; integrate Franklin American Mortgage to realize scale economies Wealth – Leverage investments in personnel plus sales, product & technology platforms; announced Clarfeld acquisition Commercial Continue to broaden Capital Markets capabilities; leverage new Global Markets platform and capabilities Treasury – re-platform cash management; capture value from recent product investments
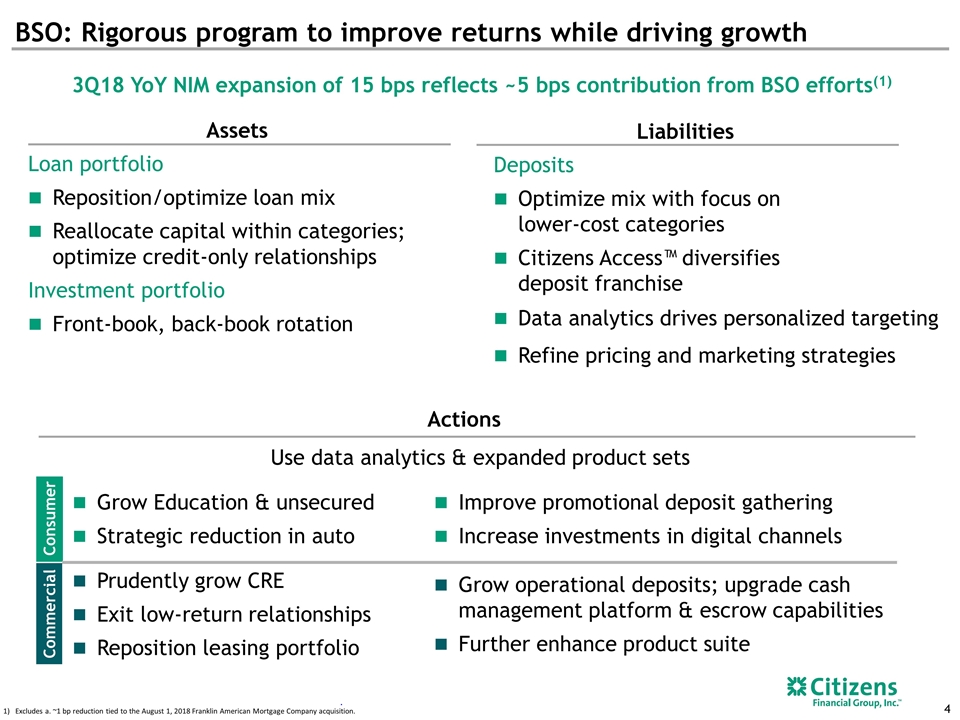
BSO: Rigorous program to improve returns while driving growth 3Q18 YoY NIM expansion of 15 bps reflects ~5 bps contribution from BSO efforts(1) Assets Liabilities Loan portfolio Reposition/optimize loan mix Reallocate capital within categories; optimize credit-only relationships Investment portfolio Front-book, back-book rotation Actions Deposits Optimize mix with focus on lower-cost categories Citizens Access™ diversifies deposit franchise Data analytics drives personalized targeting Refine pricing and marketing strategies Use data analytics & expanded product sets Consumer Grow Education & unsecured Strategic reduction in auto Improve promotional deposit gathering Increase investments in digital channels Commercial Prudently grow CRE Exit low-return relationships Reposition leasing portfolio Grow operational deposits; upgrade cash management platform & escrow capabilities Further enhance product suite . Excludes a. ~1 bp reduction tied to the August 1, 2018 Franklin American Mortgage Company acquisition.
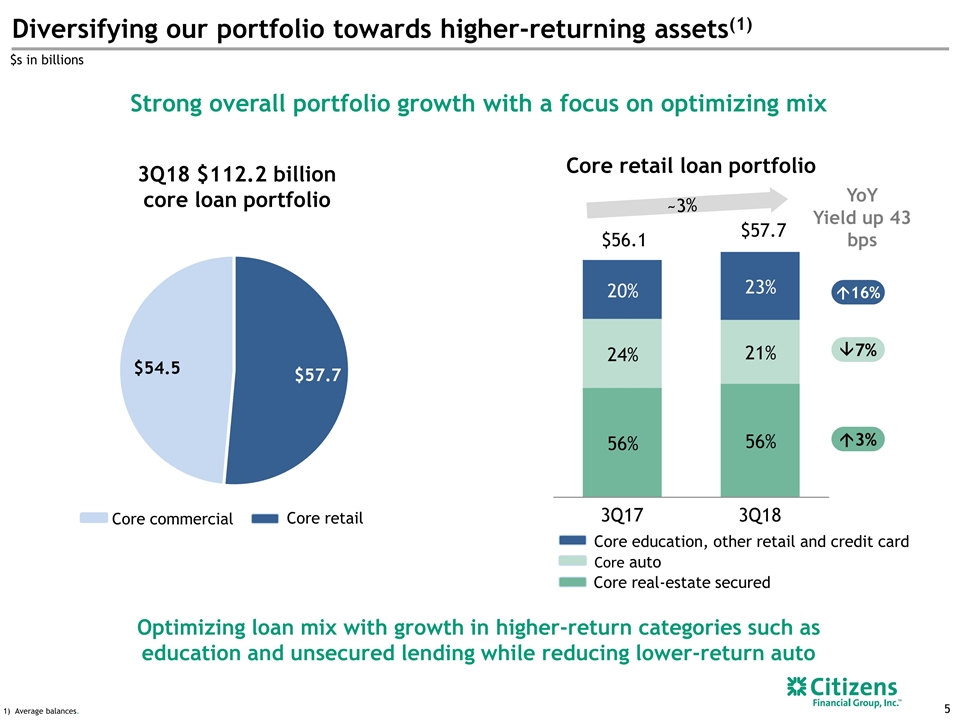
Diversifying our portfolio towards higher-returning assets(1) Strong overall portfolio growth with a focus on optimizing mix Core retail loan portfolio $56.1 $57.7 3Q18 $112.2 billion core loan portfolio YoY Yield up 43 bps Optimizing loan mix with growth in higher-return categories such as education and unsecured lending while reducing lower-return auto Average balances. â7% á16% Core commercial Core retail $s in billions á3% Core education, other retail and credit card Core auto Core real-estate secured ~3%
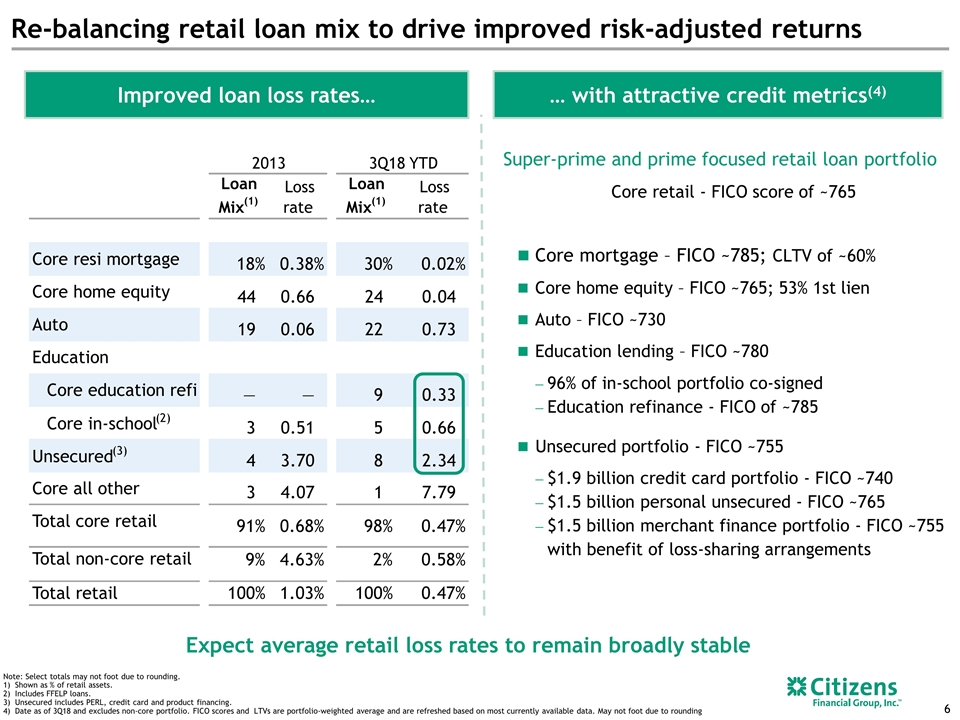
Improved loan loss rates… … with attractive credit metrics(4) Core mortgage – FICO ~785; CLTV of ~60% Core home equity – FICO ~765; 53% 1st lien Auto – FICO ~730 Education lending – FICO ~780 96% of in-school portfolio co-signed Education refinance - FICO of ~785 Unsecured portfolio - FICO ~755 $1.9 billion credit card portfolio - FICO ~740 $1.5 billion personal unsecured - FICO ~765 $1.5 billion merchant finance portfolio - FICO ~755 with benefit of loss-sharing arrangements Expect average retail loss rates to remain broadly stable Note: Select totals may not foot due to rounding. Shown as % of retail assets. Includes FFELP loans. Unsecured includes PERL, credit card and product financing. Date as of 3Q18 and excludes non-core portfolio. FICO scores and LTVs are portfolio-weighted average and are refreshed based on most currently available data. May not foot due to rounding Re-balancing retail loan mix to drive improved risk-adjusted returns Super-prime and prime focused retail loan portfolio Core retail - FICO score of ~765 2013 3Q18 YTD Loan Mix (1) Loss rate Loan Mix (1) Loss rate Core resi mortgage 18% 0.38% 30% 0.02% Core home equity 44 0.66 24 0.04 Auto 19 0.06 22 0.73 Education Core education refi — — 9 0.33 Core in-school (2) 3 0.51 5 0.66 Unsecured (3) 4 3.70 8 2.34 Core all other 3 4.07 1 7.79 Total core retail 91% 0.68% 98% 0.47% Total non-core retail 9% 4.63% 2% 0.58% Total retail 100% 1.03% 100% 0.47%
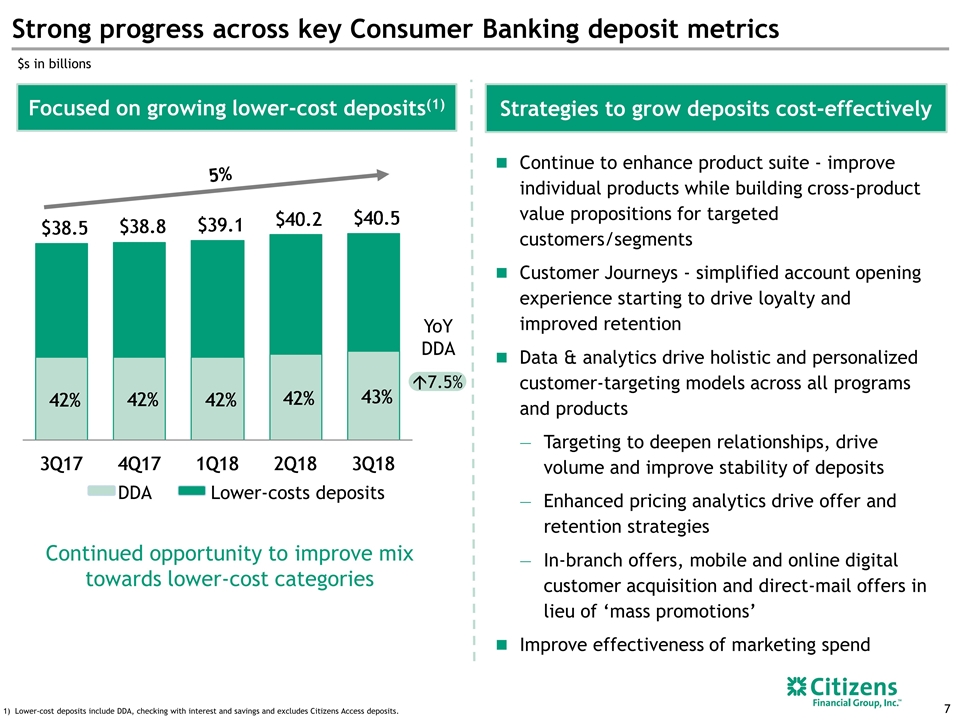
Strong progress across key Consumer Banking deposit metrics Strategies to grow deposits cost-effectively Focused on growing lower-cost deposits(1) 5% Continued opportunity to improve mix towards lower-cost categories Continue to enhance product suite - improve individual products while building cross-product value propositions for targeted customers/segments Customer Journeys - simplified account opening experience starting to drive loyalty and improved retention Data & analytics drive holistic and personalized customer-targeting models across all programs and products Targeting to deepen relationships, drive volume and improve stability of deposits Enhanced pricing analytics drive offer and retention strategies In-branch offers, mobile and online digital customer acquisition and direct-mail offers in lieu of ‘mass promotions’ Improve effectiveness of marketing spend Lower-cost deposits include DDA, checking with interest and savings and excludes Citizens Access deposits. YoY DDA á7.5% $s in billions DDA Lower-costs deposits
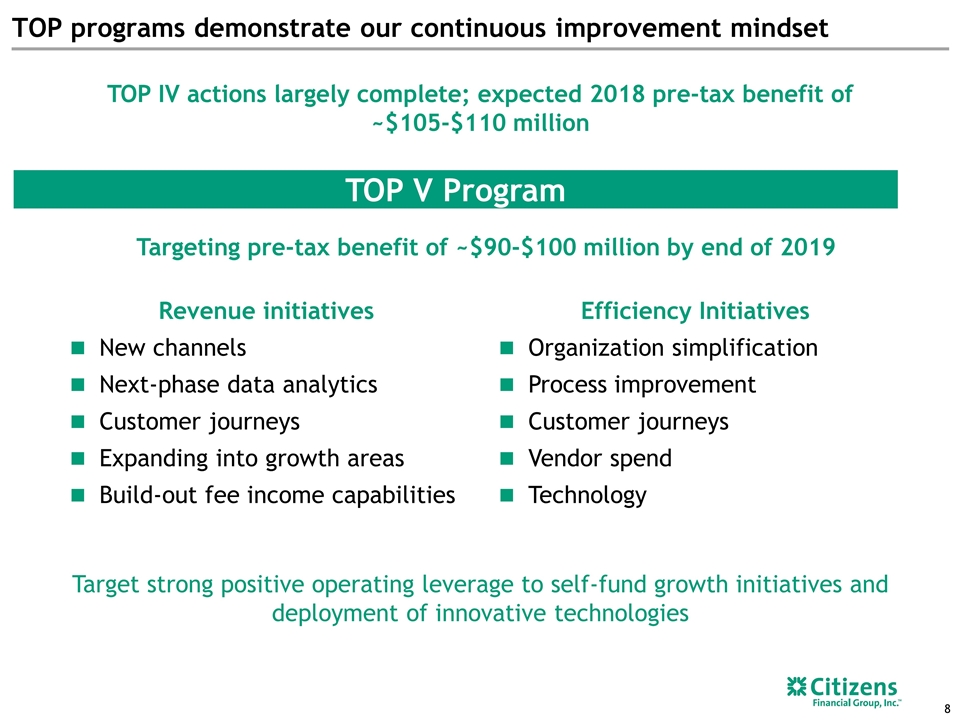
TOP V Program Targeting pre-tax benefit of ~$90-$100 million by end of 2019 TOP programs demonstrate our continuous improvement mindset TOP IV actions largely complete; expected 2018 pre-tax benefit of ~$105-$110 million Target strong positive operating leverage to self-fund growth initiatives and deployment of innovative technologies Efficiency Initiatives Organization simplification Process improvement Customer journeys Vendor spend Technology Revenue initiatives New channels Next-phase data analytics Customer journeys Expanding into growth areas Build-out fee income capabilities
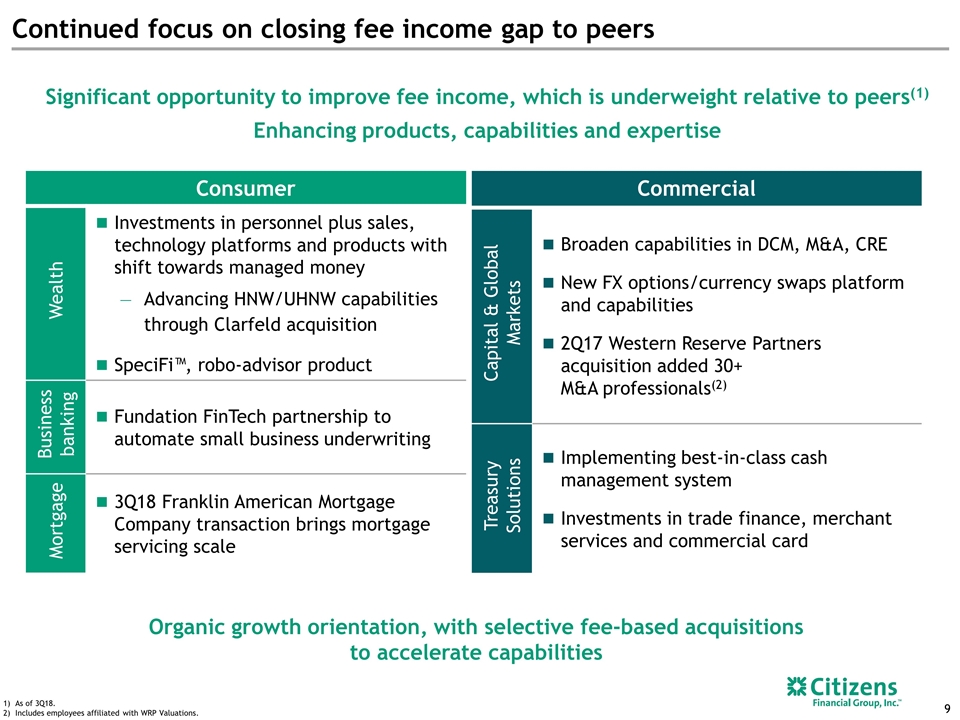
Commercial Capital & Global Markets Broaden capabilities in DCM, M&A, CRE New FX options/currency swaps platform and capabilities 2Q17 Western Reserve Partners acquisition added 30+ M&A professionals(2) Treasury Solutions Implementing best-in-class cash management system Investments in trade finance, merchant services and commercial card Continued focus on closing fee income gap to peers As of 3Q18. Includes employees affiliated with WRP Valuations. Consumer Wealth Investments in personnel plus sales, technology platforms and products with shift towards managed money Advancing HNW/UHNW capabilities through Clarfeld acquisition SpeciFi™, robo-advisor product Business banking Fundation FinTech partnership to automate small business underwriting Mortgage 3Q18 Franklin American Mortgage Company transaction brings mortgage servicing scale Organic growth orientation, with selective fee-based acquisitions to accelerate capabilities Significant opportunity to improve fee income, which is underweight relative to peers(1) Enhancing products, capabilities and expertise
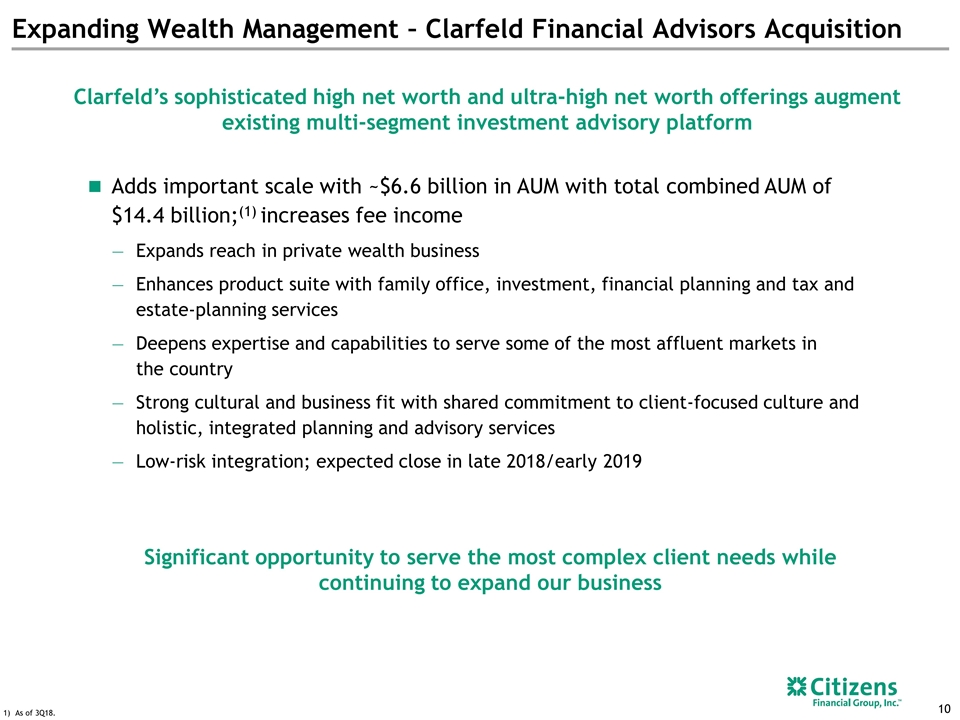
Expanding Wealth Management – Clarfeld Financial Advisors Acquisition Significant opportunity to serve the most complex client needs while continuing to expand our business Clarfeld’s sophisticated high net worth and ultra-high net worth offerings augment existing multi-segment investment advisory platform Adds important scale with ~$6.6 billion in AUM with total combined AUM of $14.4 billion;(1) increases fee income Expands reach in private wealth business Enhances product suite with family office, investment, financial planning and tax and estate-planning services Deepens expertise and capabilities to serve some of the most affluent markets in the country Strong cultural and business fit with shared commitment to client-focused culture and holistic, integrated planning and advisory services Low-risk integration; expected close in late 2018/early 2019 As of 3Q18.

Appendix
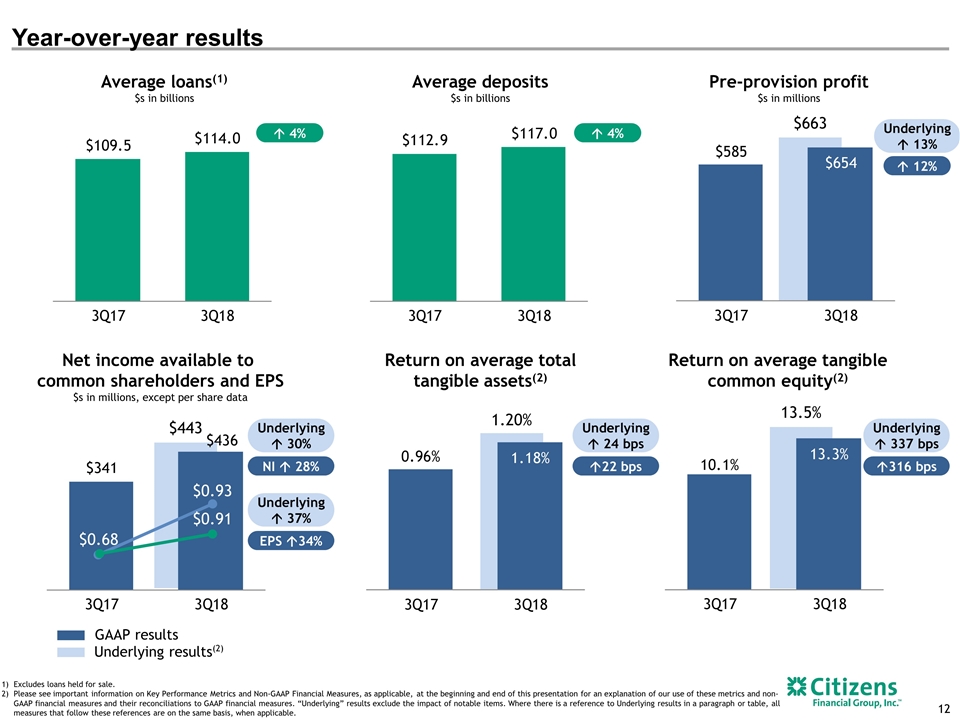
Excludes loans held for sale. Please see important information on Key Performance Metrics and Non-GAAP Financial Measures, as applicable, at the beginning and end of this presentation for an explanation of our use of these metrics and non-GAAP financial measures and their reconciliations to GAAP financial measures. “Underlying” results exclude the impact of notable items. Where there is a reference to Underlying results in a paragraph or table, all measures that follow these references are on the same basis, when applicable. GAAP results Underlying results(2) $663 á 13% á 4% Average loans(1) $s in billions á 4% Average deposits $s in billions á 12% Pre-provision profit $s in millions á316 bps NI á 28% $0.93 Underlying á 30% Net income available to common shareholders and EPS $s in millions, except per share data Return on average tangible common equity(2) 9.0% Underlying á 273 bps EPS á34% $0.91 $0.68 $443 Underlying á 37% á22 bps Return on average total tangible assets(2) Underlying á 337 bps Underlying á 13% 1.20% Underlying á 24 bps 13.5% Year-over-year results
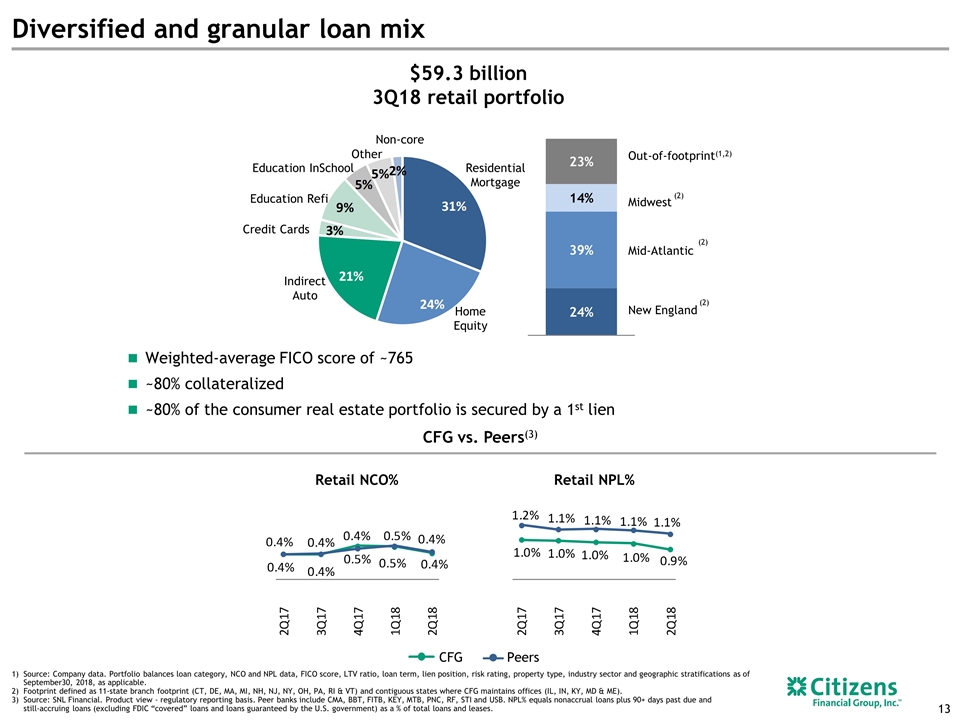
CFG Peers Retail NCO% Retail NPL% CFG vs. Peers(3) Diversified and granular loan mix $59.3 billion 3Q18 retail portfolio Mid-Atlantic Midwest New England Weighted-average FICO score of ~765 ~80% collateralized ~80% of the consumer real estate portfolio is secured by a 1st lien Home Equity Indirect Auto Residential Mortgage Education Refi Credit Cards Other Non-core Out-of-footprint(1,2) Source: Company data. Portfolio balances loan category, NCO and NPL data, FICO score, LTV ratio, loan term, lien position, risk rating, property type, industry sector and geographic stratifications as of September30, 2018, as applicable. Footprint defined as 11-state branch footprint (CT, DE, MA, MI, NH, NJ, NY, OH, PA, RI & VT) and contiguous states where CFG maintains offices (IL, IN, KY, MD & ME). Source: SNL Financial. Product view - regulatory reporting basis. Peer banks include CMA, BBT, FITB, KEY, MTB, PNC, RF, STI and USB. NPL% equals nonaccrual loans plus 90+ days past due and still‐accruing loans (excluding FDIC “covered” loans and loans guaranteed by the U.S. government) as a % of total loans and leases. (2) (2) (2) Education InSchool
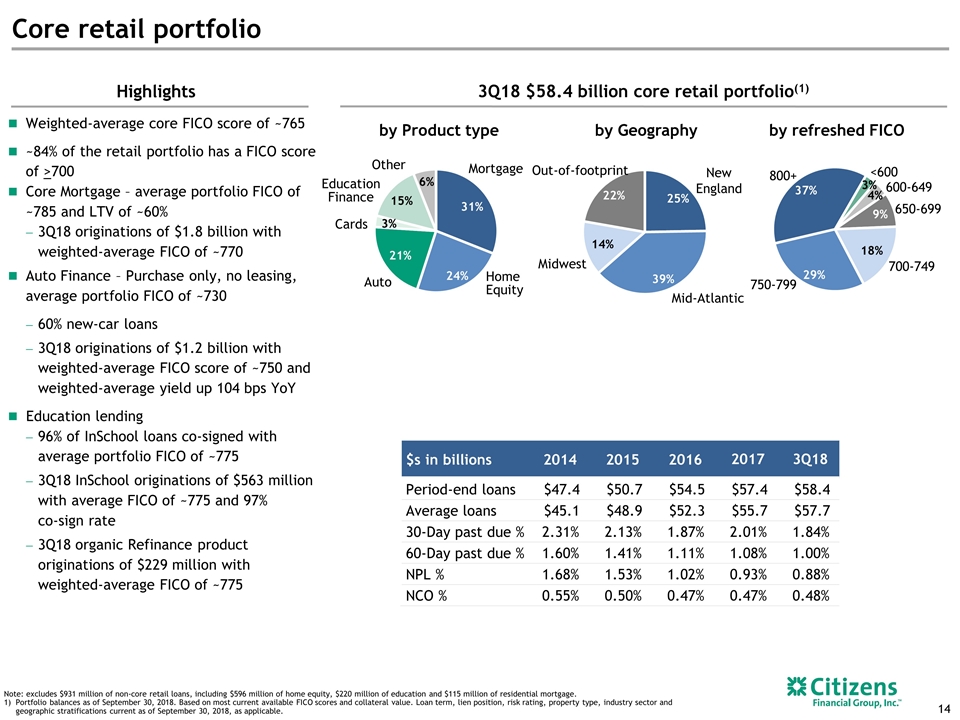
$s in billions 2014 2015 2016 2017 3Q18 Period-end loans $47.4 $50.7 $54.5 $57.4 $58.4 Average loans $45.1 $48.9 $52.3 $55.7 $57.7 30-Day past due % 2.31% 2.13% 1.87% 2.01% 1.84% 60-Day past due % 1.60% 1.41% 1.11% 1.08% 1.00% NPL % 1.68% 1.53% 1.02% 0.93% 0.88% NCO % 0.55% 0.50% 0.47% 0.47% 0.48% Core retail portfolio Highlights Weighted-average core FICO score of ~765 ~84% of the retail portfolio has a FICO score of >700 Core Mortgage – average portfolio FICO of ~785 and LTV of ~60% 3Q18 originations of $1.8 billion with weighted-average FICO of ~770 Auto Finance – Purchase only, no leasing, average portfolio FICO of ~730 60% new-car loans 3Q18 originations of $1.2 billion with weighted-average FICO score of ~750 and weighted-average yield up 104 bps YoY Education lending 96% of InSchool loans co-signed with average portfolio FICO of ~775 3Q18 InSchool originations of $563 million with average FICO of ~775 and 97% co-sign rate 3Q18 organic Refinance product originations of $229 million with weighted-average FICO of ~775 Out-of-footprint New England Mid-Atlantic Midwest Home Equity Mortgage Auto Cards Education Finance Other 800+ 750-799 700-749 650-699 600-649 <600 Note: excludes $931 million of non-core retail loans, including $596 million of home equity, $220 million of education and $115 million of residential mortgage. Portfolio balances as of September 30, 2018. Based on most current available FICO scores and collateral value. Loan term, lien position, risk rating, property type, industry sector and geographic stratifications current as of September 30, 2018, as applicable. 3Q18 $58.4 billion core retail portfolio(1) by Product type by Geography by refreshed FICO
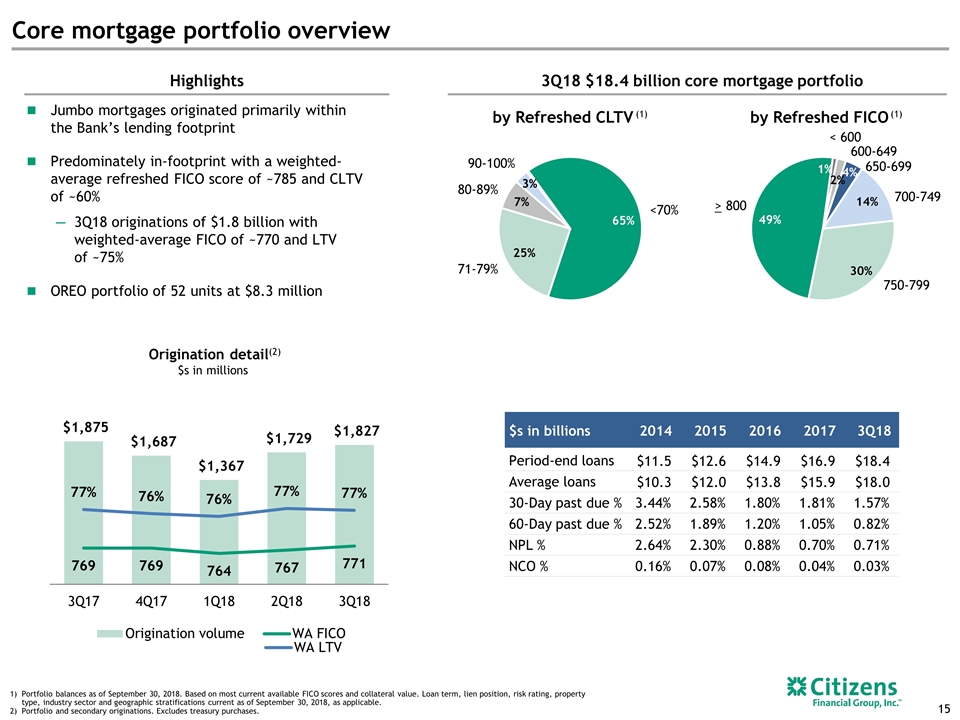
Core mortgage portfolio overview Highlights Jumbo mortgages originated primarily within the Bank’s lending footprint Predominately in-footprint with a weighted-average refreshed FICO score of ~785 and CLTV of ~60% 3Q18 originations of $1.8 billion with weighted-average FICO of ~770 and LTV of ~75% OREO portfolio of 52 units at $8.3 million 3Q18 $18.4 billion core mortgage portfolio by Refreshed CLTV by Refreshed FICO 90-100% 71-79% 80-89% Origination detail(2) $s in millions Portfolio balances as of September 30, 2018. Based on most current available FICO scores and collateral value. Loan term, lien position, risk rating, property type, industry sector and geographic stratifications current as of September 30, 2018, as applicable. Portfolio and secondary originations. Excludes treasury purchases. (1) (1) <70% < 600 600-649 700-749 > 800 650-699 750-799 $s in billions 2014 2015 2016 2017 3Q18 Period-end loans $11.5 $12.6 $14.9 $16.9 $18.4 Average loans $10.3 $12.0 $13.8 $15.9 $18.0 30-Day past due % 3.44% 2.58% 1.80% 1.81% 1.57% 60-Day past due % 2.52% 1.89% 1.20% 1.05% 0.82% NPL % 2.64% 2.30% 0.88% 0.70% 0.71% NCO % 0.16% 0.07% 0.08% 0.04% 0.03%
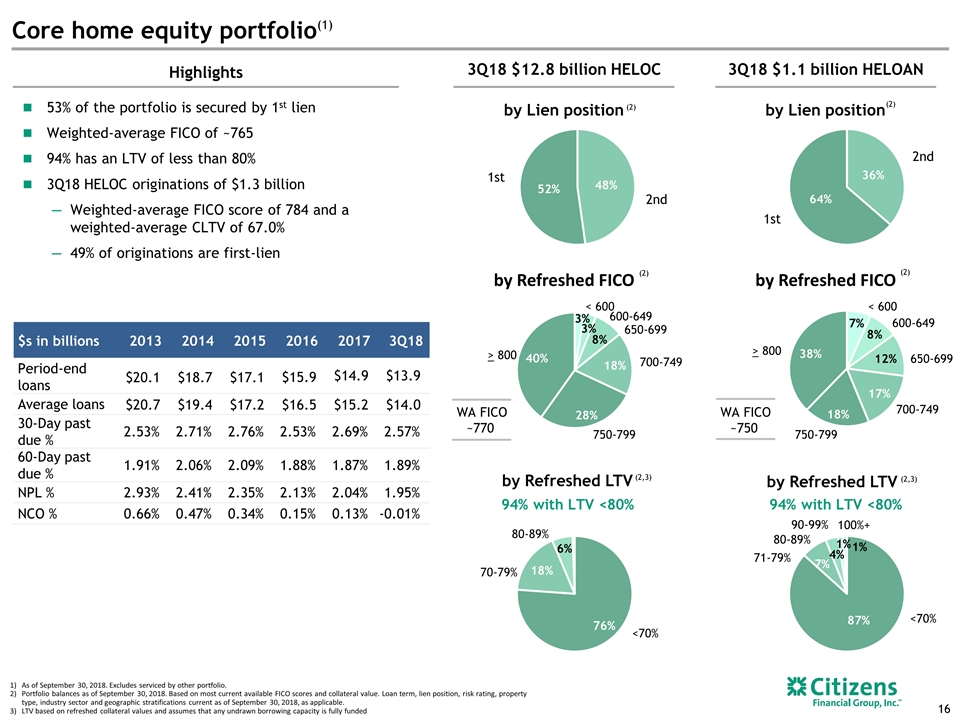
94% with LTV <80% As of September 30, 2018. Excludes serviced by other portfolio. Portfolio balances as of September 30, 2018. Based on most current available FICO scores and collateral value. Loan term, lien position, risk rating, property type, industry sector and geographic stratifications current as of September 30, 2018, as applicable. LTV based on refreshed collateral values and assumes that any undrawn borrowing capacity is fully funded by Lien position by Lien position 2nd 1st 2nd 1st Highlights (2) (2) 3Q18 $12.8 billion HELOC 3Q18 $1.1 billion HELOAN Core home equity portfolio(1) by Refreshed LTV by Refreshed FICO by Refreshed FICO <70% 71-79% <70% 70-79% 80-89% WA FICO ~770 WA FICO ~750 94% with LTV <80% (2) (2,3) (2) (2,3) by Refreshed LTV 80-89% 90-99% 100%+ 53% of the portfolio is secured by 1st lien Weighted-average FICO of ~765 94% has an LTV of less than 80% 3Q18 HELOC originations of $1.3 billion Weighted-average FICO score of 784 and a weighted-average CLTV of 67.0% 49% of originations are first-lien < 600 600-649 700-749 > 800 650-699 750-799 < 600 600-649 700-749 > 800 650-699 750-799 $s in billions 2013 2014 2015 2016 2017 3Q18 Period-end loans $20.1 $18.7 $17.1 $15.9 $14.9 $13.9 Average loans $20.7 $19.4 $17.2 $16.5 $15.2 $14.0 30-Day past due % 2.53% 2.71% 2.76% 2.53% 2.69% 2.57% 60-Day past due % 1.91% 2.06% 2.09% 1.88% 1.87% 1.89% NPL % 2.93% 2.41% 2.35% 2.13% 2.04% 1.95% NCO % 0.66% 0.47% 0.34% 0.15% 0.13% -0.01%
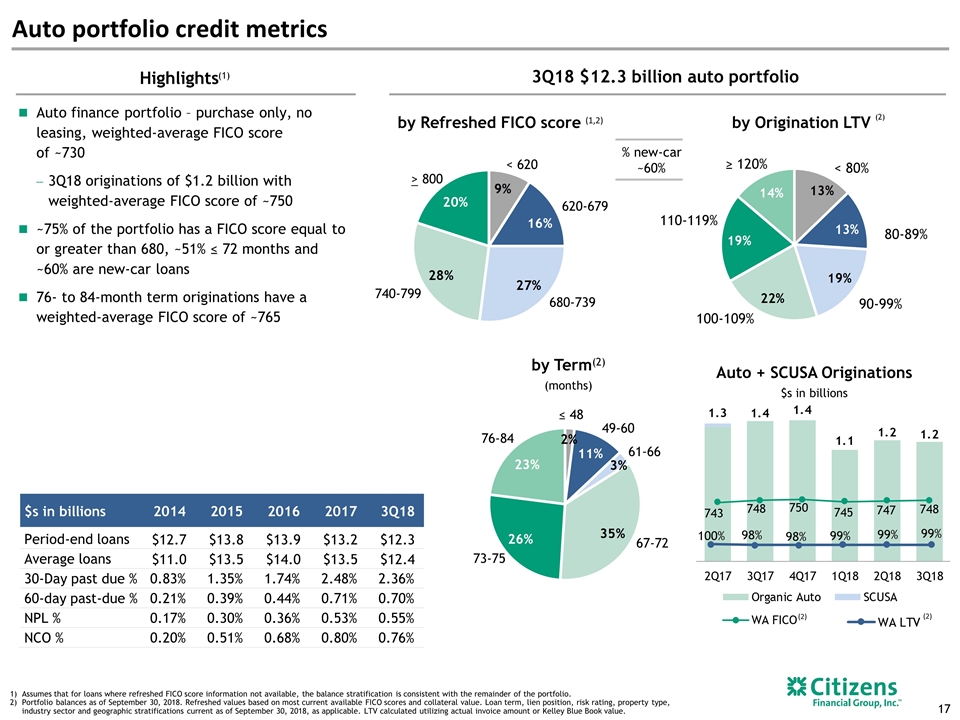
Auto portfolio credit metrics 17 Highlights by Refreshed FICO score ≤ 48 49-60 76-84 61-66 67-72 73-75 by Origination LTV 80-89% 90-99% 100-109% 110-119% ≥ 120% < 80% Assumes that for loans where refreshed FICO score information not available, the balance stratification is consistent with the remainder of the portfolio. Portfolio balances as of September 30, 2018. Refreshed values based on most current available FICO scores and collateral value. Loan term, lien position, risk rating, property type, industry sector and geographic stratifications current as of September 30, 2018, as applicable. LTV calculated utilizing actual invoice amount or Kelley Blue Book value. (1) (1,2) Auto + SCUSA Originations $s in billions (2) 3Q18 $12.3 billion auto portfolio % new-car ~60% (2) (2) by Term(2) (months) Auto finance portfolio – purchase only, no leasing, weighted-average FICO score of ~730 3Q18 originations of $1.2 billion with weighted-average FICO score of ~750 ~75% of the portfolio has a FICO score equal to or greater than 680, ~51% ≤ 72 months and ~60% are new-car loans 76- to 84-month term originations have a weighted-average FICO score of ~765 620-679 680-739 > 800 < 620 740-799 $s in billions 2014 2015 2016 2017 3Q18 Period-end loans $12.7 $13.8 $13.9 $13.2 $12.3 Average loans $11.0 $13.5 $14.0 $13.5 $12.4 30-Day past due % 0.83% 1.35% 1.74% 2.48% 2.36% 60-day past-due % 0.21% 0.39% 0.44% 0.71% 0.70% NPL % 0.17% 0.30% 0.36% 0.53% 0.55% NCO % 0.20% 0.51% 0.68% 0.80% 0.76%
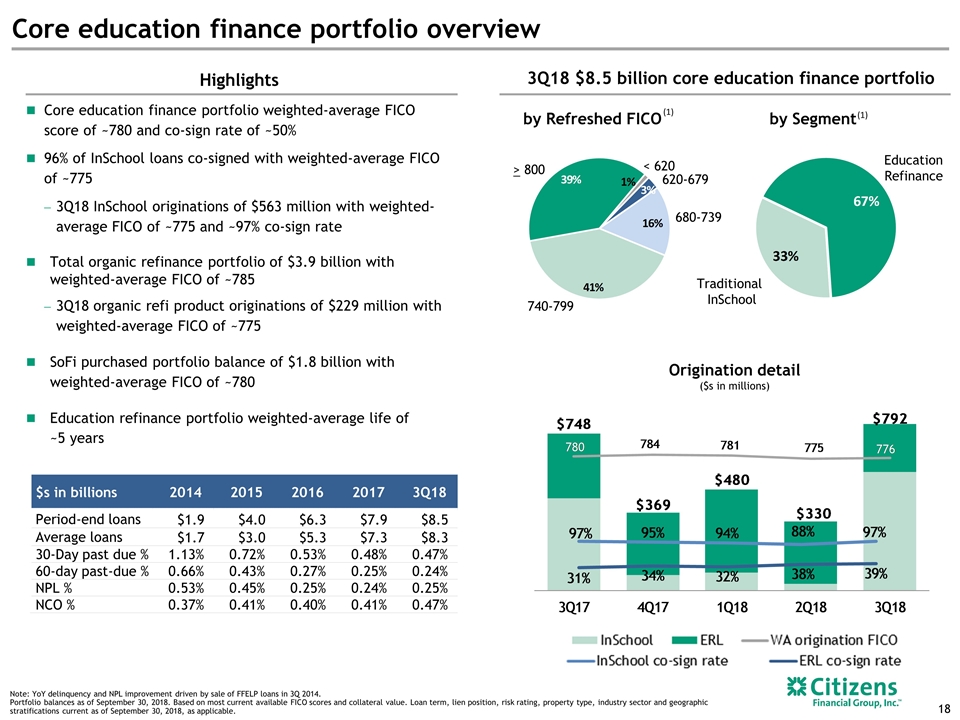
Core education finance portfolio overview Highlights by Refreshed FICO Note: YoY delinquency and NPL improvement driven by sale of FFELP loans in 3Q 2014. Portfolio balances as of September 30, 2018. Based on most current available FICO scores and collateral value. Loan term, lien position, risk rating, property type, industry sector and geographic stratifications current as of September 30, 2018, as applicable. Core education finance portfolio weighted-average FICO score of ~780 and co-sign rate of ~50% 96% of InSchool loans co-signed with weighted-average FICO of ~775 3Q18 InSchool originations of $563 million with weighted-average FICO of ~775 and ~97% co-sign rate Total organic refinance portfolio of $3.9 billion with weighted-average FICO of ~785 3Q18 organic refi product originations of $229 million with weighted-average FICO of ~775 SoFi purchased portfolio balance of $1.8 billion with weighted-average FICO of ~780 Education refinance portfolio weighted-average life of ~5 years by Segment Traditional InSchool Education Refinance (1) 3Q18 $8.5 billion core education finance portfolio (1) Origination detail ($s in millions) 18 620-679 680-739 > 800 < 620 740-799 $s in billions 2014 2015 2016 2017 3Q18 Period-end loans $1.9 $4.0 $6.3 $7.9 $8.5 Average loans $1.7 $3.0 $5.3 $7.3 $8.3 30-Day past due % 1.13% 0.72% 0.53% 0.48% 0.47% 60-day past-due % 0.66% 0.43% 0.27% 0.25% 0.24% NPL % 0.53% 0.45% 0.25% 0.24% 0.25% NCO % 0.37% 0.41% 0.40% 0.41% 0.47%
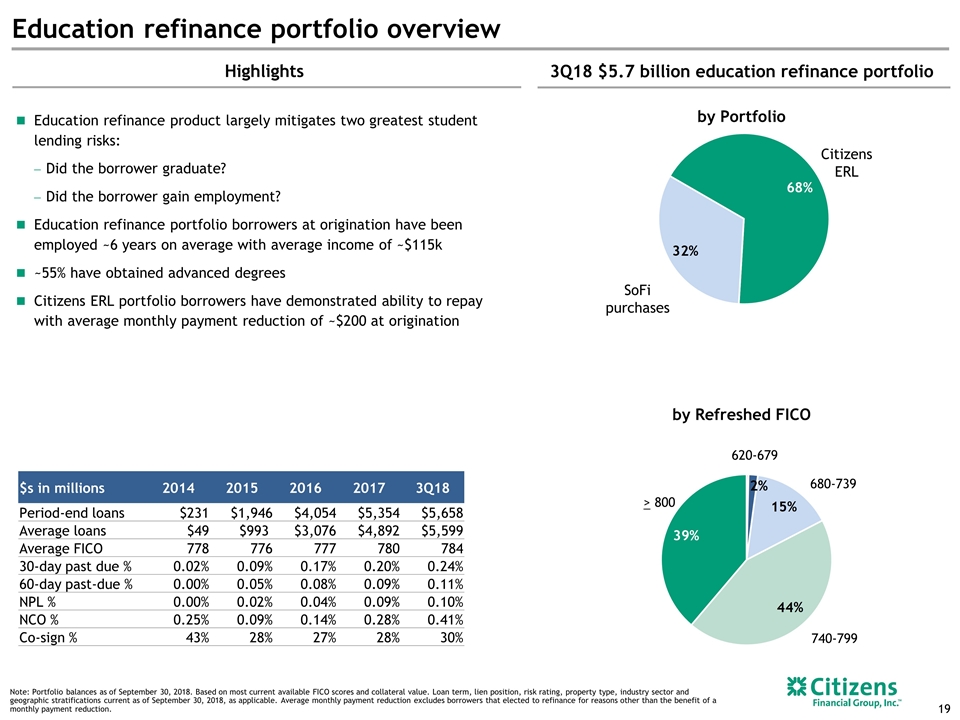
Education refinance portfolio overview Note: Portfolio balances as of September 30, 2018. Based on most current available FICO scores and collateral value. Loan term, lien position, risk rating, property type, industry sector and geographic stratifications current as of September 30, 2018, as applicable. Average monthly payment reduction excludes borrowers that elected to refinance for reasons other than the benefit of a monthly payment reduction. Education refinance product largely mitigates two greatest student lending risks: Did the borrower graduate? Did the borrower gain employment? Education refinance portfolio borrowers at origination have been employed ~6 years on average with average income of ~$115k ~55% have obtained advanced degrees Citizens ERL portfolio borrowers have demonstrated ability to repay with average monthly payment reduction of ~$200 at origination Highlights 3Q18 $5.7 billion education refinance portfolio Citizens ERL SoFi purchases 620-679 680-739 > 800 740-799 by Refreshed FICO by Portfolio 19 $s in millions 2014 2015 2016 2017 3Q18 Period-end loans $231 $1,946 $4,054 $5,354 $5,658 Average loans $49 $993 $3,076 $4,892 $5,599 Average FICO 778 776 777 780 784 30-day past due % 0.02% 0.09% 0.17% 0.20% 0.24% 60-day past-due % 0.00% 0.05% 0.08% 0.09% 0.11% NPL % 0.00% 0.02% 0.04% 0.09% 0.10% NCO % 0.25% 0.09% 0.14% 0.28% 0.41% Co-sign % 43% 28% 27% 28% 30%
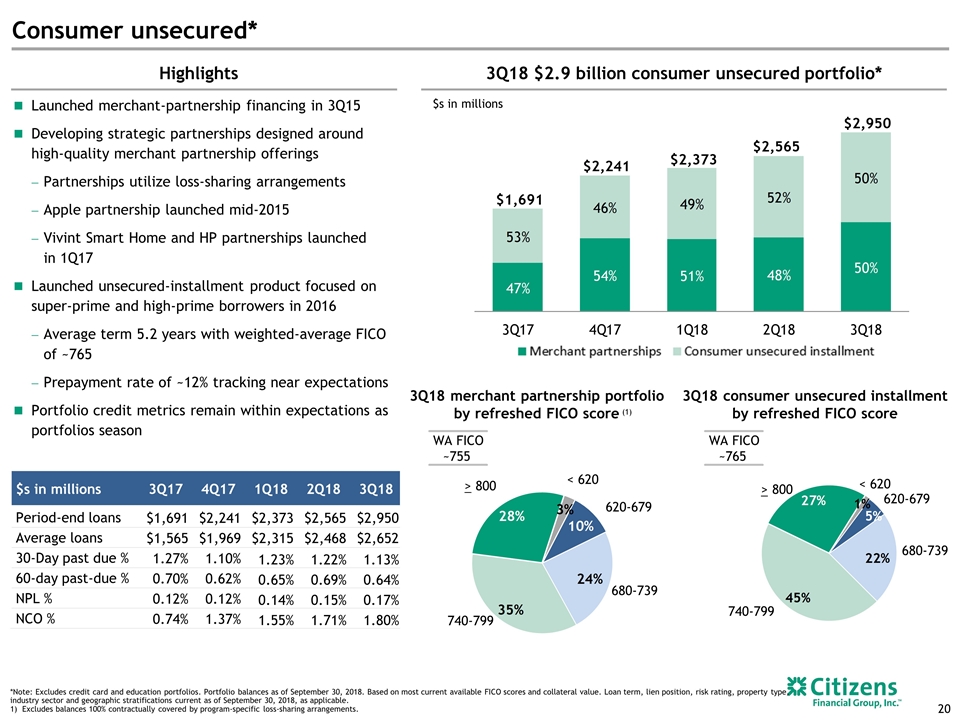
Consumer unsecured* Highlights Launched merchant-partnership financing in 3Q15 Developing strategic partnerships designed around high-quality merchant partnership offerings Partnerships utilize loss-sharing arrangements Apple partnership launched mid-2015 Vivint Smart Home and HP partnerships launched in 1Q17 Launched unsecured-installment product focused on super-prime and high-prime borrowers in 2016 Average term 5.2 years with weighted-average FICO of ~765 Prepayment rate of ~12% tracking near expectations Portfolio credit metrics remain within expectations as portfolios season 3Q18 $2.9 billion consumer unsecured portfolio* $s in millions 3Q18 merchant partnership portfolio by refreshed FICO score 3Q18 consumer unsecured installment by refreshed FICO score WA FICO ~765 *Note: Excludes credit card and education portfolios. Portfolio balances as of September 30, 2018. Based on most current available FICO scores and collateral value. Loan term, lien position, risk rating, property type, industry sector and geographic stratifications current as of September 30, 2018, as applicable. Excludes balances 100% contractually covered by program-specific loss-sharing arrangements. (1) WA FICO ~755 20 620-679 680-739 > 800 < 620 740-799 620-679 680-739 > 800 < 620 740-799 $s in millions 3Q17 4Q17 1Q18 2Q18 3Q18 Period-end loans $1,691 $2,241 $2,373 $2,565 $2,950 Average loans $1,565 $1,969 $2,315 $2,468 $2,652 30-Day past due % 1.27% 1.10% 1.23% 1.22% 1.13% 60-day past-due % 0.70% 0.62% 0.65% 0.69% 0.64% NPL % 0.12% 0.12% 0.14% 0.15% 0.17% NCO % 0.74% 1.37% 1.55% 1.71% 1.80%
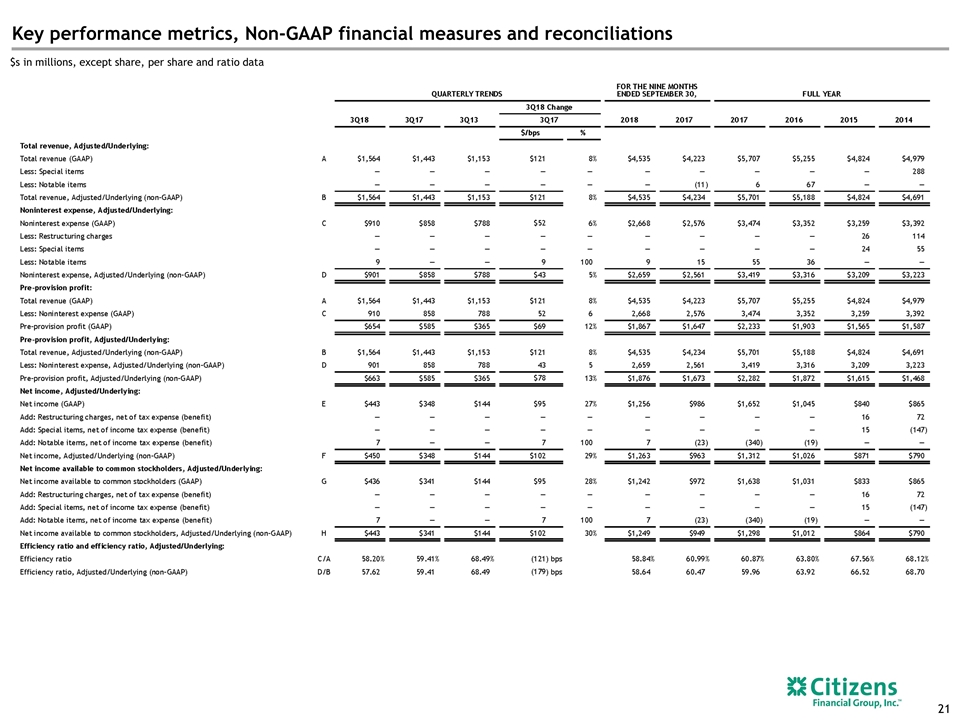
Key performance metrics, Non-GAAP financial measures and reconciliations $s in millions, except share, per share and ratio data
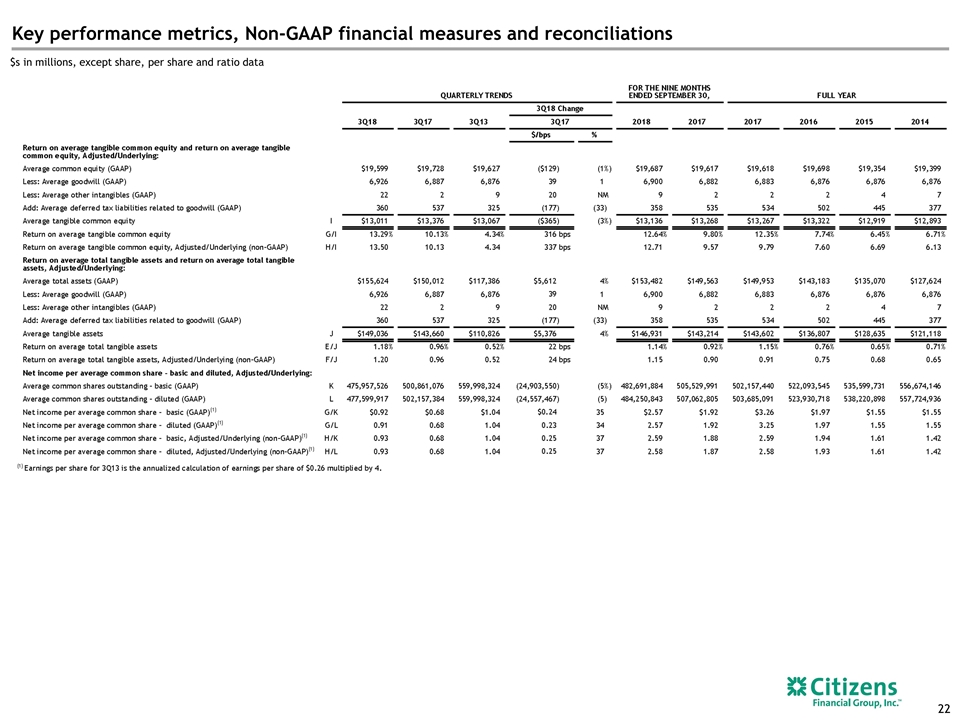
Key performance metrics, Non-GAAP financial measures and reconciliations $s in millions, except share, per share and ratio data
