Attached files
| file | filename |
|---|---|
| EX-99.1 - PRESS RELEASE - TPI COMPOSITES, INC | exh_991.htm |
| 8-K - FORM 8-K - TPI COMPOSITES, INC | f8k_110718.htm |
Exhibit 99.2

Q3 2018 Earnings Call
Q3 2018 Earnings Call Legal Disclaimer This presentation contains forward - looking statements within the meaning of the federal securities laws. All statements other th an statements of historical facts contained in this presentation, including statements regarding our future results of operations and financial position, business strategy and p lan s and objectives of management for future operations, are forward - looking statements. In many cases, you can identify forward - looking statements by terms such as “may,” “ should,” “expects,” “plans,” “anticipates,” “could,” “intends,” “target,” “projects,” “contemplates,” “believes,” “estimates,” “predicts,” “potential” or “continue” or the negati ve of these terms or other similar words. Forward - looking statements contained in this presentation include, but are not limited to, statements about (i) growth of the wind energy mar ket and our addressable market; (ii) the potential impact of the increasing prevalence of auction - based tenders in the wind energy market and increased competition from solar energy on o ur gross margins and overall financial performance; (iii) our future financial performance, including our net sales, cost of goods sold, gross profit or gross margi n, operating expenses, ability to generate positive cash flow, and ability to achieve or maintain profitability; (iv) changes in domestic or international government or regulatory po lic y, including without limitation, changes in trade policy; (v) the sufficiency of our cash and cash equivalents to meet our liquidity needs; (vi) our ability to attract and retain customer s f or our products, and to optimize product pricing; (vii) our ability to effectively manage our growth strategy and future expenses, including startup and transition costs; (viii) competi tio n from other wind blade turbine manufacturers; (ix) the discovery of defects in our products; (x) our ability to successfully expand in our existing wind energy markets and into new in ternational wind energy markets; (xi) our ability to successfully expand our transportation business and execute upon our strategy of entering new markets outside of wind energy; (x ii) worldwide economic conditions and their impact on customer demand; (xiii) our ability to maintain, protect and enhance our intellectual property; (xiv) our ability t o c omply with existing, modified or new laws and regulations applying to our business, including the imposition of new taxes, duties or similar assessments on our products; (xv) the attr act ion and retention of qualified employees and key personnel; and (xvi) the potential impact of GE’s acquisition of LM Wind Power upon our business. These forward - looking statements are only predictions. These statements relate to future events or our future financial performa nce and involve known and unknown risks, uncertainties and other important factors that may cause our actual results, levels of activity, performance or achievements to materially differ from any future results, levels of activity, performance or achievements expressed or implied by these forward - looking statements. Because forward - looking statemen ts are inherently subject to risks and uncertainties, some of which cannot be predicted or quantified, you should not rely on these forward - looking statements as guara ntees of future events. Further information on the factors, risks and uncertainties that could affect our financial results and the forward - looking statements in this presentation are included in our filings with the Securities and Exchange Commission and will be included in subsequent periodic and current reports we make with the Securities and Exchange Com mission from time to time, including in our Annual Report on Form 10 - K for the year ended December 31, 2017. The forward - looking statements in this presentation represent our views as of the date of this presentation. We anticipate that subsequent events and developments will cause our views to change. However, while we may elect to update these forward - looking statements at some point in the future, we undertak e no obligation to update any forward - looking statement to reflect events or developments after the date on which the statement is made or to reflect the occurrence of una nti cipated events except to the extent required by applicable law. You should, therefore, not rely on these forward - looking statements as representing our views as of any date aft er the date of this presentation. Our forward - looking statements do not reflect the potential impact of any future acquisitions, mergers, dispositions, joint ventures, or investme nts we may make. This presentation includes unaudited non - GAAP financial measures including total billings, EBITDA, adjusted EBITDA, net cash (de bt) and free cash flow. We define total billings as the total amounts we have invoiced our customers for products and services for which we are entitled to payment under the ter ms of our long - term supply agreements or other contractual agreements. We define EBITDA as net income (loss) attributable to the Company plus interest expense (including lo sse s on the extinguishment of debt and net of interest income), income taxes and depreciation and amortization. We define Adjusted EBITDA as EBITDA plus any share - based compe nsation expense, plus or minus any gains or losses from foreign currency remeasurement. We define net cash (debt) as the total principal amount of debt outstanding le ss unrestricted cash and cash equivalents. We define free cash flow as net cash flow generated from operating activities less capital expenditures. We present non - GAAP measures when we believe that the additional information is useful and meaningful to investors. Non - GAAP financial measures do not have any standardized meaning and are therefore unlikely to be comparable to similar measures presented by other companies. The presentation of non - GAAP financial measures is not intended to be a substitute for, and should not be considered in isolation from, the financial measures reported in accordance with GAAP. See the appendix for the reconciliations of certain non - GAAP financial measures to th e comparable GAAP measures. This presentation also contains estimates and other information concerning our industry that are based on industry publicatio ns, surveys and forecasts. This information involves a number of assumptions and limitations, and we have not independently verified the accuracy or completeness of the information . 2 November 7, 2018

Q3 2018 Earnings Call Agenda • Q3 2018 Highlights • Q3 2018 Financial Highlights • Guidance for 2018 and 2019, 2020 Key Targets • Q&A • Appendix – Non - GAAP Information – Impact of ASC 606 on Q3 2017 3 November 7, 2018

Q3 2018 Highlights

Q3 2018 Earnings Call Q3 2018 Highlights 5 November 7, 2018 Q3 2018 Highlights and Recent Company News • Operating results and year - over - year increases compared to 201 7 • Net sales were $255.0 million for the quarter up slightly on lower volume but a higher average sales price • Net income for the quarter of $ 9.5 million compared to net income of $21.7 million in 2017 driven by the reversal of the deferred tax asset valuation allowance and offset by higher startup and transition activity • Adjusted EBITDA for the quarter was $ 17.6 million or 6.9% of sales • Vestas exercised an option for 2 additional lines in our manufacturing hub in Matamoros, Mexico bringing the total number of lines in that facility to 6 • GE agreed to extend our supply agreement in one of our Mexico plants by two years to 2022 and will increase the number of lines in that facility to 5 from the current 3 • GE agreed to transition to a larger blade model in our Iowa plant in early 2019 and eliminate its option to terminate the Iowa supply agreement prior to its December 2020 expiration Net Sales and Adjusted EBITDA ($ in millions) $254 $255 $28 $18 $0 $200 $400 Q3 '17 Q3 '18 Q3 '17 Q3 '18 Sets invoiced 739 589 Est. MW 1,796 1,625 Dedicated lines (1) 48 51 Lines installed (2) 38 39 (1) Number of wind blade manufacturing lines dedicated to our customers under long - term supply agreement s at the end of the quarter. (2) Number of wind blade manufacturing lines installed that are either in operation, startup or transition at the end of the quarter. Net Sales Adjusted EBITDA
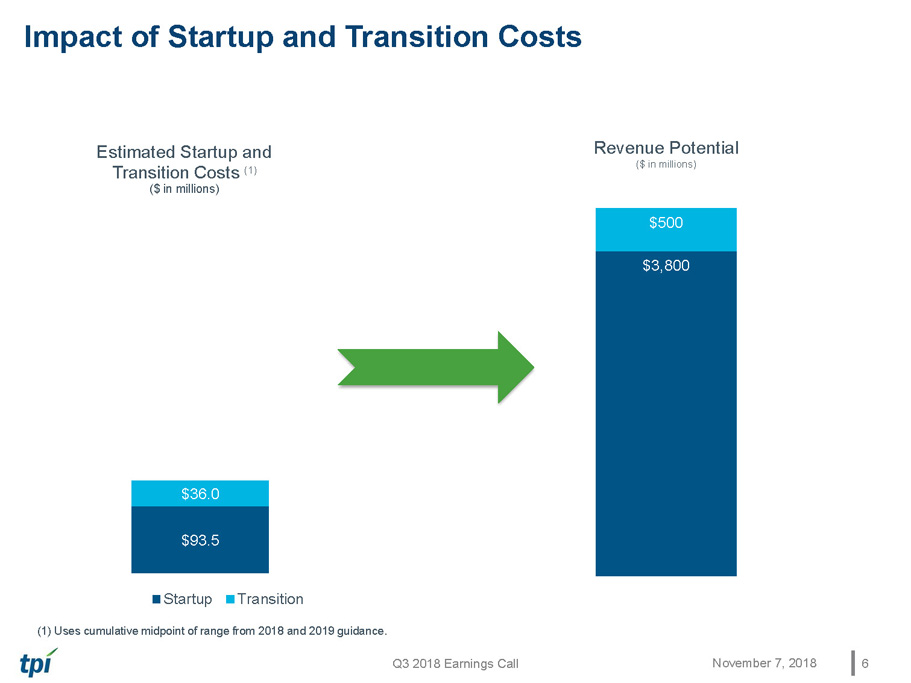
Q3 2018 Earnings Call Impact of Startup and Transition Costs $93.5 $36.0 Estimated Startup and Transition Costs (1) ($ in millions) Startup Transition 6 November 7, 2018 $3,800 $500 Revenue Potential ($ in millions) (1) Uses cumulative midpoint of range from 2018 and 2019 guidance.

Q3 2018 Earnings Call Existing Contracts Provide for ~$6.3 Billion in Potential Revenue through 2023 (1 ) 7 November 7, 2018 Long - term Supply Agreements (1) 2018 2019 2020 2021 2022 2023 U.S. Turkey Mexico China Long - term supply agreements provide for estimated minimum aggregate volume commitments from our customers of approximately $ 4.3 billion and encourage our customers to purchase additional volume up to, in the aggregate, an estimated total potential revenue of approximately $6.3 billion through the end of 2023 (1) Note: Our contracts with some of our customers are subject to termination or reduction on short notice, generally with substa nti al penalties, and contain liquidated damages provisions, which may require us to make unanticipated payments to our customers or our customers to make payments to us. (1) As of November 7, 2018. The chart depicts the term of the longest contract in each location .
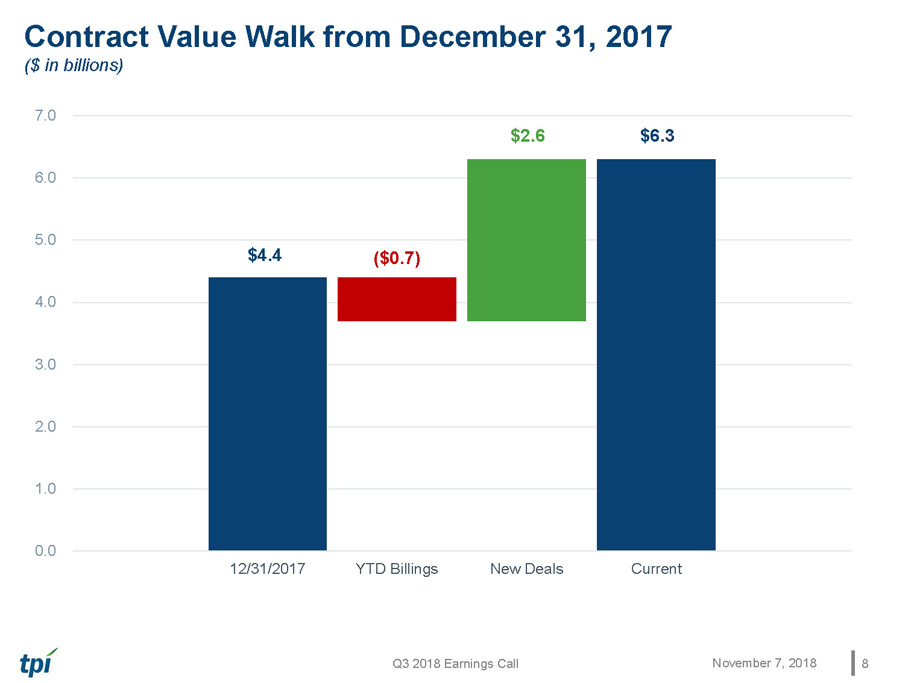
Q3 2018 Earnings Call Contract Value Walk from December 31, 2017 ($ in billions) $6.3 ($0.7) $2.6 $4.4 0.0 1.0 2.0 3.0 4.0 5.0 6.0 7.0 12/31/2017 YTD Billings New Deals Current 8 November 7, 2018

Q3 2018 Financial Highlights

Q3 2018 Earnings Call Q3 2018 Financial Highlights (1) (unaudited) 10 November 7, 2018 (1) See pages 24 – 26 for reconciliations of non - GAAP financial data ($ in millions, except per share data and KPIs) Q3 ’18 Q3 ’17 ∆ YTD ’18 YTD ’17 ∆ Select Financial Data Net Sales $ 255.0 $ 253.5 0.6% $ 739.6 $ 701.7 5.4% Total Billings $ 240.7 $ 256.4 -6.1% $ 701.8 $ 698.8 0.4% Net Income $ 9.5 $ 21.7 -56.1% $ 14.1 $ 36.5 -61.3% Diluted Earnings Per Share $ 0.26 $ 0.62 $ (0.36) $ 0.39 $ 1.05 $ (0.66) Adjusted EBITDA (1) $ 17.6 $ 27.9 -36.9% $ 58.4 $ 71.7 -18.5% Adjusted EBITDA Margin 6.9% 11.0% -410 bps 7.9% 10.2% -230 bps Net Cash (Debt) (1) $ (22.9) $ 3.6 $ (26.4) $ (22.9) $ 3.6 $ (26.4) Free Cash Flow (1) $ 6.3 $ 9.0 $ (2.7) $ (33.4) $ 8.1 $ (41.6) Capital Expenditures $ 8.3 $ 8.6 $ (0.3) $ 50.6 $ 35.3 $ 15.3 Key Performance Indicators (KPIs) Sets Invoiced 589 739 (150) 1,734 2,067 (333) Estimated Megawatts 1,625 1,796 (171) 4,633 4,876 (243) Dedicated Wind Blade Manufacturing Lines 51 48 3 lines 51 48 3 lines Wind Blade Manufacturing Lines Installed 39 38 1 line 39 41 2 lines Wind Blade Manufacturing Lines in Startup 5 10 5 lines 13 12 1 line Wind Blade Manufacturing Lines in Transition 6 — 6 lines 15 — 15 lines

Q3 2018 Earnings Call Income Statement Summary (1 ) (unaudited) 11 November 7, 2018 (1) See pages 24 – 26 for reconciliations of Non - GAAP financial data 2018 2017 $ % 2018 2017 $ % ($ in thousands, except per share amounts) Net sales 254,976$ 253,498$ 1,478$ 0.6% 739,567$ 701,695$ 37,872$ 5.4% Cost of sales 216,594$ 210,840$ 5,754$ 2.7% 625,817$ 592,495$ 33,322$ 5.6% Startup and transition costs 21,415$ 12,352$ 9,063$ 73.4% 53,474$ 29,051$ 24,423$ 84.1% Total cost of goods sold 238,009$ 223,192$ 14,817$ 6.6% 679,291$ 621,546$ 57,745$ 9.3% Cost of goods sold % 93.3% 88.0% 530 bps 91.8% 88.6% 320 bps Gross profit 16,967$ 30,306$ (13,339)$ -44.0% 60,276$ 80,149$ (19,873)$ -24.8% Gross profit % 6.7% 12.0% -530 bps 8.2% 11.4% -320 bps General and administrative expenses 9,756$ 9,315$ 441$ 4.7% 31,908$ 28,373$ 3,535$ 12.5% General and administrative expenses % 3.8% 3.7% 10 bps 4.3% 4.0% 30 bps Income from operations 7,211$ 20,991$ (13,780)$ -65.6% 28,368$ 51,776$ (23,408)$ -45.2% Income (loss) before income taxes (737)$ 18,214$ (18,951)$ -104.0% 7,770$ 41,032$ (33,262)$ -81.1% Net income 9,532$ 21,737$ (12,205)$ -56.1% 14,127$ 36,527$ (22,400)$ -61.3% Weighted-average common shares outstanding: Basic 34,419 33,891 34,212 33,789 Diluted 36,282 35,015 35,946 34,748 Net income per common share: Basic 0.28$ 0.64$ (0.36)$ 0.41$ 1.08$ (0.67)$ Diluted 0.26$ 0.62$ (0.36)$ 0.39$ 1.05$ (0.66)$ Non-GAAP Metrics Total billings 240,699$ 256,404$ (15,705)$ -6.1% 701,755$ 698,833$ 2,922$ 0.4% EBITDA (1) 7,419$ 26,847$ (19,428)$ -72.4% 38,494$ 64,312$ (25,818)$ -40.1% EBITDA margin 2.9% 10.6% -770 bps 5.2% 9.2% -400 bps Adjusted EBITDA (1) 17,572$ 27,851$ (10,279)$ -36.9% 58,422$ 71,681$ (13,259)$ -18.5% Adjusted EBITDA margin 6.9% 11.0% -410 bps 7.9% 10.2% -230 bps Three Months Ended September 30, Change Nine Months Ended September 30, Change

Q3 2018 Earnings Call Key Balance Sheet and Cash Flow Data (1 ) (unaudited) 12 November 7, 2018 (1) See page 25 for the reconciliation s of net cash (debt) and free cash flow September 30, December 31, ($ in thousands) 2018 2017 Balance Sheet Data: Cash and cash equivalents 110,838$ 148,113$ Restricted cash 2,845$ 3,849$ Accounts receivable 117,066$ 121,576$ Contract assets 122,265$ 105,619$ Total debt-current and noncurrent, net 132,784$ 121,385$ Net cash (debt) (1) (22,876)$ 24,557$ ($ in thousands) 2018 2017 2018 2017 Cash Flow Data: Net cash provided by operating activities 14,660$ 17,590$ 17,195$ 43,460$ Capital expenditures 8,326$ 8,585$ 50,636$ 35,312$ Free cash flow (1) 6,334$ 9,005$ (33,441)$ 8,148$ Three Months Ended September 30, Nine Months Ended September 30,

Guidance for 2018 and 2019 and 2020 Key Targets

Q3 2018 Earnings Call Key Guidance Metrics 14 November 7, 2018 2018 Guidance Updated 2018 Guidance Previous Total Billings (1) $1.0B – $1.05B $1.0B – $1.05B Net Sales $1.0B – $1.05B $1.0B – $1.05B Adjusted EBITDA $65M – $70M $65M – $70M Earnings per Share - FD $0.32 – $0.39 $0.10 – $0.14 Sets 2,420 – 2,440 2,450 – 2,480 Average Selling Price per Blade $125K – $130K $125K – $130K Non - Blade Billings $80M – $85M $80M – $85M G&A Costs as a % of Billings (incl. SBC) 4.0% – 4.5% 4% – 5% Estimated MW ~6,800 6,800 – 6,900 Dedicated Lines - EOY 51 – 55 51 – 55 Share - Based Compensation $9M – $9.25M $9M – $10M Depreciation & Amortization $26.5M – $27M $30M – $32M Net Interest Expense $14M – $14.5M $14M – $14.5M Capital Expenditures $85M – $90M $85M – $90M Effective Tax Rate NM (2) 47% – 49% Note: All reference to lines is to wind blade manufacturing lines (1) We have not reconciled our total expected billings for 2018 to expected net sales under GAAP because we have not yet finalize d c alculations necessary to provide the reconciliation and as such the reconciliation is not possible without unreasonable efforts. (2) As a result of the release of our valuation allowance in Q3, the effective tax rate for full year 2018 as calculated is not m ean ingful.

Q3 2018 Earnings Call Sets and Startup & Transition Costs Guidance Metrics 15 November 7, 2018 Q1A Q2A Q3A Q4F 2018 Guidance Updated 2018 Guidance Previous Lines Installed – end of period 38 40 39 43 43 43 Lines in Startup – during period 10 7 5 7 17 17 Lines in Transition – during period 4 7 6 6 15 17 Startup and Transition Costs $14.7M $17.3M $ 21.4M $21M – $22M $74M – $75M $66M – $68M Sets 569 576 589 686 – 706 2,420 – 2,440 2,450 – 2,480 Note: All reference to lines is to wind blade manufacturing lines

Q3 2018 Earnings Call 16 Note: All reference to lines is to wind blade manufacturing lines 2019 Guidance 2019 Target Previous 2020 Target Total Billings $1.5B – $1.6B $1.3B – $1.5B $1.7B – $1.9B Net Sales $1.5B – $1.6B $1.7B – $1.9B Adjusted EBITDA $120M – $130M $140M – $150M $170M – $190M Earnings per Share - FD $1.24 – $1.35 Sets 3,300 – 3,500 Average Selling Price per Blade $135K – $140K Non - Blade Billings $115M – $120M G&A Costs as a % of Billings (incl. SBC) 4% – 4.25% Estimated MW 9,800 – 10,400 Dedicated Lines - EOY 62 – 65 Share - Based Compensation $9.5M – $10M Depreciation & Amortization $40M – $45M Net Interest Expense $12M – $13M Capital Expenditures $95M – $100M Effective Tax Rate 20% – 25% November 7, 2018 2019 Key Guidance Metrics and 2020 Targets

Q3 2018 Earnings Call 2019 Startup and Transition Guidance Metrics 17 November 7, 2018 Q1 Q2 Q3 Q4 2019 Guidance Lines Installed – end of period 49 51 51 51 50 – 52 Lines in Startup – during period 13 10 5 – 15 Lines in Transition – during period 5 7 6 2 10 Startup Costs $14.0M – $15.0M $10.0M – $11.0M $3.0M – $3.5M $3.0M – $3.5M $30.0M – $33.0M Transition Costs $2.5M – $3.0M $7.0M – $ 8.0M $11.0M – $12.0M $1.5M – $2.0M $22.0M – $25.0M Line Utilization 68% – 70% 81% – 83% 94% – 96% 98% – 100% 86% – 88% Sets 650 – 700 780 – 830 910 – 960 960 – 1,010 3,300 – 3,500 Note: All reference to lines is to wind blade manufacturing lines

Q3 2018 Earnings Call Total Billings/Net Sales Bridge ($ in millions) 18 November 7, 2018

Q3 2018 Earnings Call Adjusted EBITDA Bridge ($ in millions) 19 November 7, 2018 $67.5 $125.0 $33.9 $31.2 $100.1 $32.5 $20.0 $37.5 $25 $35 $45 $55 $65 $75 $85 $95 $105 $115 $125 2017 EBITDA Increase in S&T Costs Impact of GE Volume Reduction Growth & Operational Improvements Offset by Margin Impact of Volume Lost during Transitions 2018 EBITDA Decrease in S&T Costs Growth & Operational Improvements Offset by Margin Impact of Volume Lost during Transitions 2019 EBITDA

Q3 2018 Earnings Call 2019 Total Billings/Net Sales – Target to Guidance Bridge ($ in millions) 20 November 7, 2018 $1,550 $1,400 $25 $115 $10 $500 $600 $700 $800 $900 $1,000 $1,100 $1,200 $1,300 $1,400 $1,500 $1,600 $1,700 2019 Target Billings / Net Sales Impact of Higher Volume Impact of Higher ASP Higher Non-blade Sales 2019 Guidance Billings / Net Sales

Q3 2018 Earnings Call 2019 Adjusted EBITDA – Target to Guidance Bridge ($ in millions) 21 November 7, 2018 $125 $28 $8 $145 $50 $75 $100 $125 $150 2019 Target EBITDA Increase in S&T Costs Growth & Operational Improvements Offset by Margin Impact of Volume Lost during Transitions 2019 Guidance EBITDA

Q&A

Appendix – Non - GAAP Information This presentation includes unaudited non - GAAP financial measures including total billings, EBITDA, adjusted EBITDA, net cash (de bt) and free cash flow. We define total billings as the total amounts we have invoiced our customers for products and services fo r w hich we are entitled to payment under the terms of our long - term supply agreements or other contractual agreements. We define EBITDA as net income (loss) attributable to the Company plus interest expense (including losses on the extinguishment of debt and net of in ter est income), income taxes, and depreciation and amortization. We define adjusted EBITDA as EBITDA plus any share - based compensation expense, plus or minus any gains or losses from foreign currency remeasurement. We define net cash (debt) as the to tal principal amount of debt outstanding less unrestricted cash and cash equivalents. We define free cash flow as net cash flow g ene rated from operating activities less capital expenditures. We present non - GAAP measures when we believe that the additional informatio n is useful and meaningful to investors. Non - GAAP financial measures do not have any standardized meaning and are therefore unlikely to be comparable to similar measures presented by other companies. The presentation of non - GAAP financial measures is not intended to be a substitute for, and should not be considered in isolation from, the financial measures reported in accordance with GA AP. See below for a reconciliation of certain non - GAAP financial measures to the comparable GAAP measures.
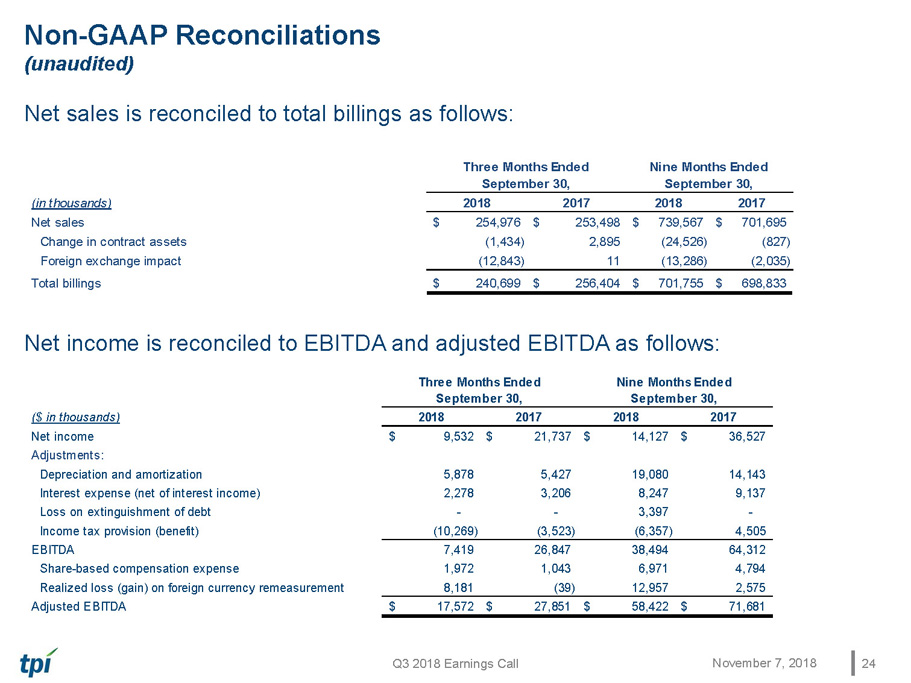
Q3 2018 Earnings Call Non - GAAP Reconciliations (unaudited) Net sales is reconciled to total billings as follows: Net income is reconciled to EBITDA and adjusted EBITDA as follows: 24 November 7, 2018 (in thousands) 2018 2017 2018 2017 Net sales 254,976$ 253,498$ 739,567$ 701,695$ Change in contract assets (1,434) 2,895 (24,526) (827) Foreign exchange impact (12,843) 11 (13,286) (2,035) Total billings 240,699$ 256,404$ 701,755$ 698,833$ Three Months Ended September 30, Nine Months Ended September 30, ($ in thousands) 2018 2017 2018 2017 Net income 9,532$ 21,737$ 14,127$ 36,527$ Adjustments: Depreciation and amortization 5,878 5,427 19,080 14,143 Interest expense (net of interest income) 2,278 3,206 8,247 9,137 Loss on extinguishment of debt - - 3,397 - Income tax provision (benefit) (10,269) (3,523) (6,357) 4,505 EBITDA 7,419 26,847 38,494 64,312 Share-based compensation expense 1,972 1,043 6,971 4,794 Realized loss (gain) on foreign currency remeasurement 8,181 (39) 12,957 2,575 Adjusted EBITDA 17,572$ 27,851$ 58,422$ 71,681$ Three Months Ended September 30, Nine Months Ended September 30,

Q3 2018 Earnings Call Non - GAAP Reconciliations (continued) (unaudited) Net cash (debt) is reconciled as follows: Free cash flow is reconciled as follows: 25 November 7, 2018 ($ in thousands) 2018 2017 2018 2017 Cash Flow Data: Net cash provided by operating activities 14,660$ 17,590$ 17,195$ 43,460$ Capital expenditures (8,326) (8,585) (50,636) (35,312) Free cash flow 6,334$ 9,005$ (33,441)$ 8,148$ Three Months Ended September 30, Nine Months Ended September 30, September 30, December 31, September 30, ($ in thousands) 2018 2017 2017 Cash and cash equivalents 110,838$ 148,113$ 139,065$ Less total debt, net of debt issuance costs (132,784) (121,385) (133,637) Less debt issuance costs (930) (2,171) (1,860) Net cash (debt) (22,876)$ 24,557$ 3,568$
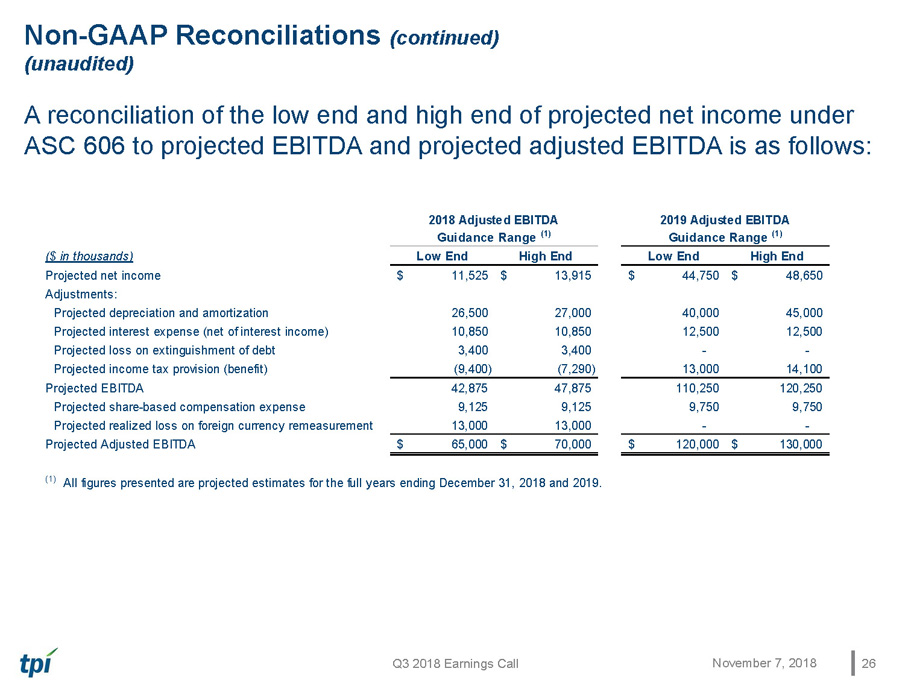
Q3 2018 Earnings Call Non - GAAP Reconciliations (continued) (unaudited) A reconciliation of the low end and high end of projected net income under ASC 606 to projected EBITDA and projected adjusted EBITDA is as follows: 26 November 7, 2018 ($ in thousands) Low End High End Low End High End Projected net income 11,525$ 13,915$ 44,750$ 48,650$ Adjustments: Projected depreciation and amortization 26,500 27,000 40,000 45,000 Projected interest expense (net of interest income) 10,850 10,850 12,500 12,500 Projected loss on extinguishment of debt 3,400 3,400 - - Projected income tax provision (benefit) (9,400) (7,290) 13,000 14,100 Projected EBITDA 42,875 47,875 110,250 120,250 Projected share-based compensation expense 9,125 9,125 9,750 9,750 Projected realized loss on foreign currency remeasurement 13,000 13,000 - - Projected Adjusted EBITDA 65,000$ 70,000$ 120,000$ 130,000$ (1) All figures presented are projected estimates for the full years ending December 31, 2018 and 2019. 2018 Adjusted EBITDA Guidance Range (1) 2019 Adjusted EBITDA Guidance Range (1)

Impact of ASC 606

Q3 2018 Earnings Call Impact of ASC 606 on Q3 2017 28 November 7, 2018
