Attached files
| file | filename |
|---|---|
| 8-K - 8-K - TE Connectivity Ltd. | a18-39626_18k.htm |
TE CONNECTIVITY THE OPPORTUNITY HAS NEVER BEEN GREATER Terrence Curtin Chief Executive Officer Heath Mitts Chief Financial Officer 1

2 Forward-Looking Statements and Non-GAAP Financial Measures Forward-Looking Statements This presentation contains certain “forward-looking statements” within the meaning of the U.S. Private Securities Litigation Reform Act of 1995. These statements are based on management’s current expectations and are subject to risks, uncertainty and changes in circumstances, which may cause actual results, performance, financial condition or achievements to differ materially from anticipated results, performance, financial condition or achievements. All statements contained herein that are not clearly historical in nature are forward-looking and the words “anticipate,” “believe,” “expect,” “estimate,” “plan,” and similar expressions are generally intended to identify forward-looking statements. We have no intention and are under no obligation to update or alter (and expressly disclaim any such intention or obligation to do so) our forward-looking statements whether as a result of new information, future events or otherwise, except to the extent required by law. The forward-looking statements in this presentation include statements addressing our future financial condition and operating results. Examples of factors that could cause actual results to differ materially from those described in the forward-looking statements include, among others, business, economic, competitive and regulatory risks, such as conditions affecting demand for products, particularly in the automotive and data and devices industries; competition and pricing pressure; fluctuations in foreign currency exchange rates and commodity prices; natural disasters and political, economic and military instability in countries in which we operate; developments in the credit markets; future goodwill impairment; compliance with current and future environmental and other laws and regulations; and the possible effects on us of changes in tax laws, tax treaties and other legislation, including the effects of the U.S. Tax Cuts and Jobs Act. More detailed information about these and other factors is set forth in TE Connectivity Ltd.’s Annual Report on Form 10-K for the fiscal year ended Sept. 29, 2017 as well as in our Quarterly Reports on Form 10-Q, Current Reports on Form 8-K and other reports filed by us with the U.S. Securities and Exchange Commission. Non-GAAP Financial Measures Where we have used non-GAAP financial measures, reconciliations to the most comparable GAAP measure are provided, along with a disclosure on the usefulness of the non-GAAP financial measure, in this presentation.
3 INDUSTRIAL TECHNOLOGY COMPANY CREATING A SAFER, SUSTAINABLE, PRODUCTIVE AND CONNECTED FUTURE TE CONNECTIVITY Automotive Sensors Commercial Transportation Data & Devices Appliances WORLD LEADER in connectivity and sensor solutions with the broadest range of technologies Highly engineered products and integrated solutions perform in harsh environments where failure is not an option TE serves a BILLION MARKET $190 TRANSPORTATION SOLUTIONS INDUSTRIAL SOLUTIONS COMMUNICATIONS SOLUTIONS FY18 SALES BY SEGMENT Aerospace & Defense Oil & Gas Industrial Equipment Medical Energy 59% 28% 13%

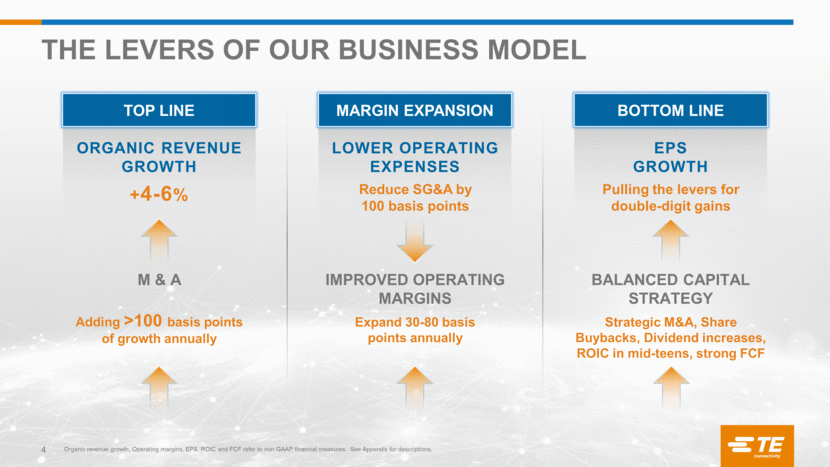
4 THE LEVERS OF OUR BUSINESS MODEL ORGANIC REVENUE GROWTH EPS GROWTH LOWER OPERATING EXPENSES M & A BALANCED CAPITAL STRATEGY Strategic M&A, Share Buybacks, Dividend increases, ROIC in mid-teens, strong FCF IMPROVED OPERATING MARGINS Expand 30-80 basis points annually Organic revenue growth, Operating margins, EPS, ROIC and FCF refer to non-GAAP financial measures. See Appendix for descriptions. TOP LINE MARGIN EXPANSION BOTTOM LINE +4-6% Pulling the levers for double-digit gains Reduce SG&A by 100 basis points Adding >100 basis points of growth annually
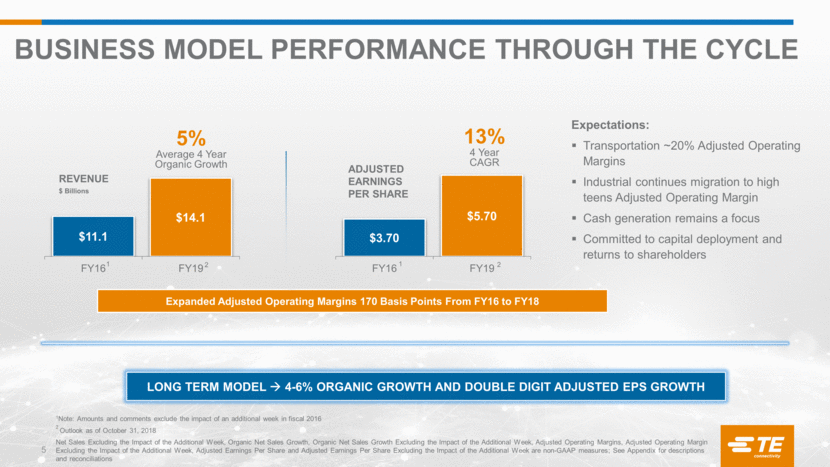
5 BUSINESS MODEL PERFORMANCE THROUGH THE CYCLE Expectations: Transportation ~20% Adjusted Operating Margins Industrial continues migration to high teens Adjusted Operating Margin Cash generation remains a focus Committed to capital deployment and returns to shareholders REVENUE $ Billions ADJUSTED EARNINGS PER SHARE 13% 4 Year CAGR Expanded Adjusted Operating Margins 170 Basis Points From FY16 to FY18 5% Average 4 Year Organic Growth 1Note: Amounts and comments exclude the impact of an additional week in fiscal 2016 2 Outlook as of October 31, 2018 Net Sales Excluding the Impact of the Additional Week, Organic Net Sales Growth, Organic Net Sales Growth Excluding the Impact of the Additional Week, Adjusted Operating Margins, Adjusted Operating Margin Excluding the Impact of the Additional Week, Adjusted Earnings Per Share and Adjusted Earnings Per Share Excluding the Impact of the Additional Week are non-GAAP measures; See Appendix for descriptions and reconciliations 1 2 1 2 LONG TERM MODEL 4-6% ORGANIC GROWTH AND DOUBLE DIGIT ADJUSTED EPS GROWTH $3.70 $5.70 FY16 FY19 $11.1 $14.1 FY16 FY19
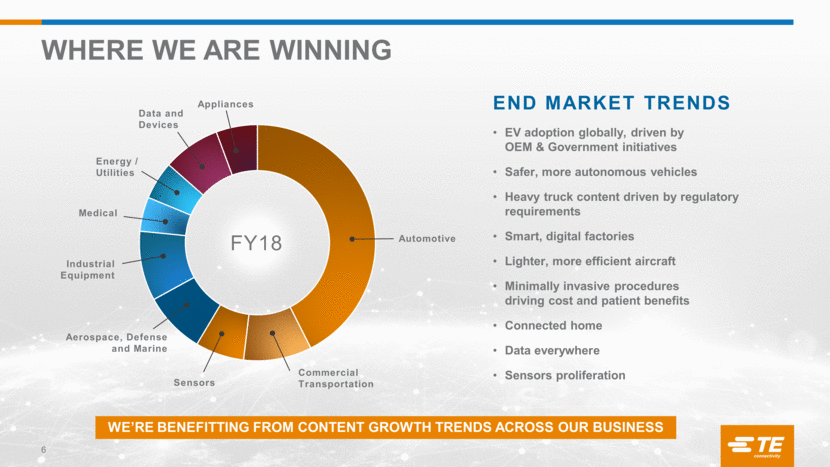
6 WHERE WE ARE WINNING Appliances Data and Devices Energy / Utilities Medical Industrial Equipment Aerospace, Defense and Marine Sensors Commercial Transportation Automotive END MARKET TRENDS EV adoption globally, driven by OEM & Government initiatives Safer, more autonomous vehicles Heavy truck content driven by regulatory requirements Smart, digital factories Lighter, more efficient aircraft Minimally invasive procedures driving cost and patient benefits Connected home Data everywhere Sensors proliferation WE’RE BENEFITTING FROM CONTENT GROWTH TRENDS ACROSS OUR BUSINESS FY18
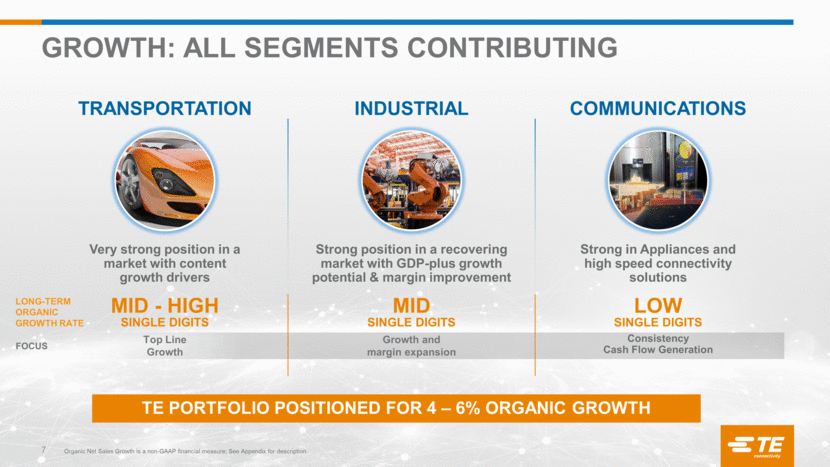
MID - HIGH SINGLE DIGITS GROWTH: ALL SEGMENTS CONTRIBUTING FOCUS Top Line Growth Growth and margin expansion Consistency Cash Flow Generation 7 TE PORTFOLIO POSITIONED FOR 4 – 6% ORGANIC GROWTH TRANSPORTATION INDUSTRIAL COMMUNICATIONS Very strong position in a market with content growth drivers Strong position in a recovering market with GDP-plus growth potential & margin improvement Strong in Appliances and high speed connectivity solutions LONG-TERM ORGANIC GROWTH RATE MID SINGLE DIGITS LOW SINGLE DIGITS Organic Net Sales Growth is a non-GAAP financial measure; See Appendix for description.
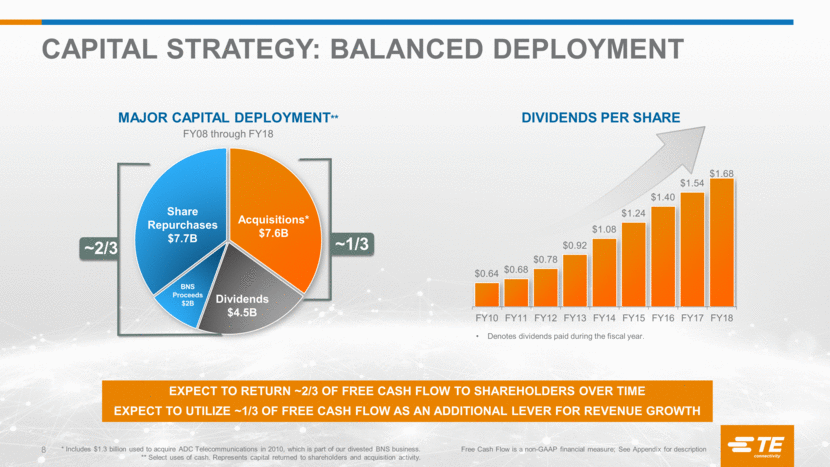
8 CAPITAL STRATEGY: BALANCED DEPLOYMENT DIVIDENDS PER SHARE Share Repurchases $7.7B Acquisitions* $7.6B Dividends $4.5B MAJOR CAPITAL DEPLOYMENT** FY08 through FY18 Denotes dividends paid during the fiscal year. BNS Proceeds $2B Free Cash Flow is a non-GAAP financial measure; See Appendix for description EXPECT TO RETURN ~2/3 OF FREE CASH FLOW TO SHAREHOLDERS OVER TIME EXPECT TO UTILIZE ~1/3 OF FREE CASH FLOW AS AN ADDITIONAL LEVER FOR REVENUE GROWTH ~2/3 ~1/3 * Includes $1.3 billion used to acquire ADC Telecommunications in 2010, which is part of our divested BNS business. ** Select uses of cash. Represents capital returned to shareholders and acquisition activity. $0.64 $0.68 $0.78 $0.92 $1.08 $1.24 $1.40 $1.54 $1.68 FY10 FY11 FY12 FY13 FY14 FY15 FY16 FY17 FY18
TRANSPORTATION SOLUTIONS 9

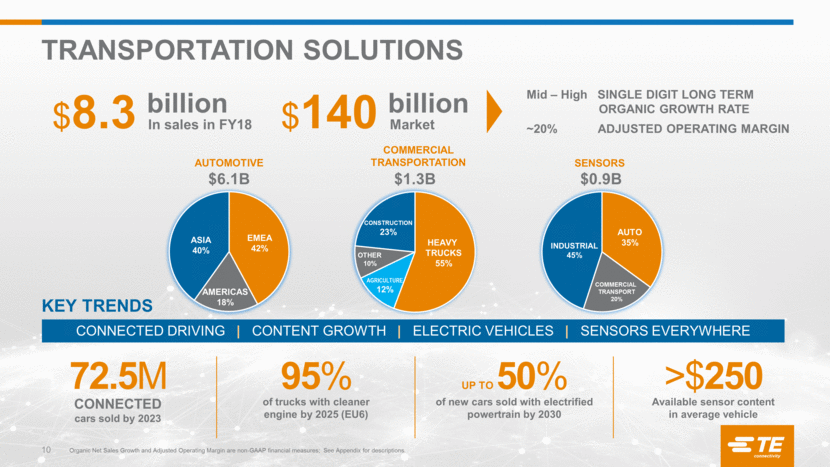
TRANSPORTATION SOLUTIONS 72.5M CONNECTED cars sold by 2023 95% of trucks with cleaner engine by 2025 (EU6) UP TO 50% of new cars sold with electrified powertrain by 2030 >$250 Available sensor content in average vehicle billion In sales in FY18 $8.3 Mid – High SINGLE DIGIT LONG TERM ORGANIC GROWTH RATE ~20% ADJUSTED OPERATING MARGIN billion Market $140 AUTOMOTIVE $6.1B KEY TRENDS CONNECTED DRIVING CONTENT GROWTH ELECTRIC VEHICLES SENSORS EVERYWHERE COMMERCIAL TRANSPORTATION $1.3B SENSORS $0.9B ASIA 40% EMEA 42% AMERICAS 18% HEAVY TRUCKS 55% AUTO 35% COMMERCIAL TRANSPORT 20% INDUSTRIAL 45% CONSTRUCTION 23% OTHER 10% AGRICULTURE 12% Organic Net Sales Growth and Adjusted Operating Margin are non-GAAP financial measures; See Appendix for descriptions. 10
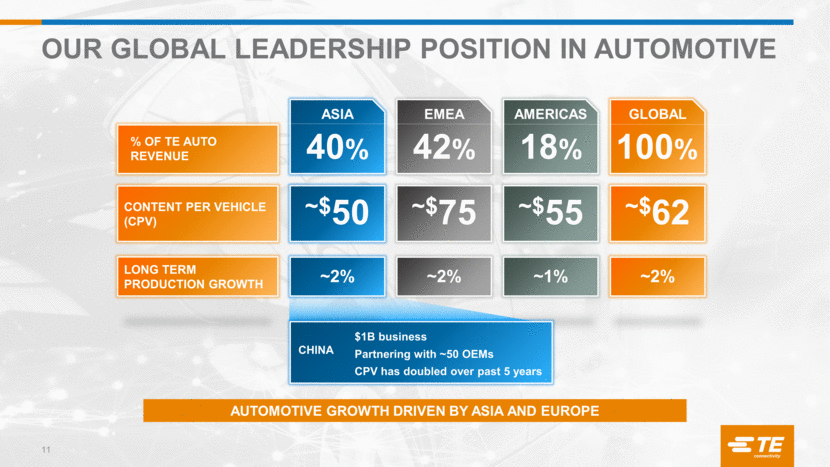
OUR GLOBAL LEADERSHIP POSITION IN AUTOMOTIVE CONTENT PER VEHICLE (CPV) 40% ~$50 $22 TODAY 42% ~$75 ASIA EMEA AMERICAS % OF TE AUTO REVENUE GLOBAL 18% ~$55 ~$62 100% LONG TERM PRODUCTION GROWTH ~2% ~1% ~2% ~2% $1B business Partnering with ~50 OEMs CPV has doubled over past 5 years AUTOMOTIVE GROWTH DRIVEN BY ASIA AND EUROPE CHINA 11
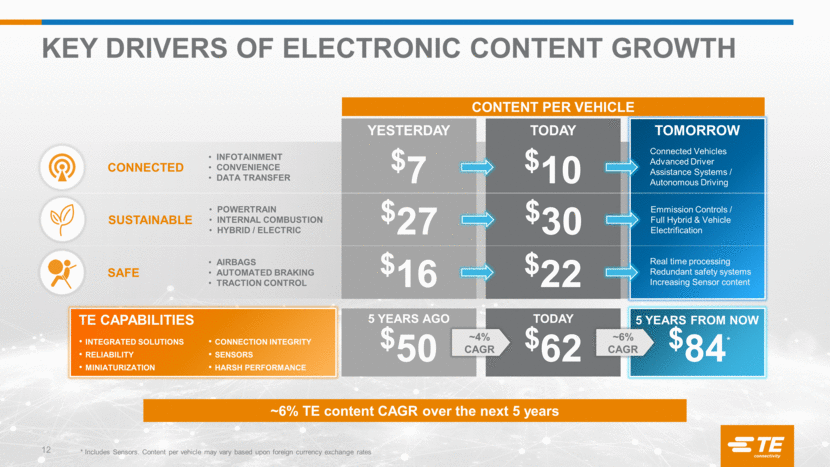
KEY DRIVERS OF ELECTRONIC CONTENT GROWTH ~6% TE content CAGR over the next 5 years * Includes Sensors. Content per vehicle may vary based upon foreign currency exchange rates $50 $27 $7 YESTERDAY 5 YEARS AGO INTEGRATED SOLUTIONS RELIABILITY MINIATURIZATION TE CAPABILITIES $84 5 YEARS FROM NOW CONNECTION INTEGRITY SENSORS HARSH PERFORMANCE Emmission Controls / Full Hybrid & Vehicle Electrification INFOTAINMENT CONVENIENCE DATA TRANSFER POWERTRAIN INTERNAL COMBUSTION HYBRID / ELECTRIC TOMORROW CONNECTED SUSTAINABLE CONTENT PER VEHICLE $62 $30 $10 TODAY TODAY * ~4% CAGR ~6% CAGR $16 Connected Vehicles Advanced Driver Assistance Systems / Autonomous Driving AIRBAGS AUTOMATED BRAKING TRACTION CONTROL SAFE $22 Real time processing Redundant safety systems Increasing Sensor content 12
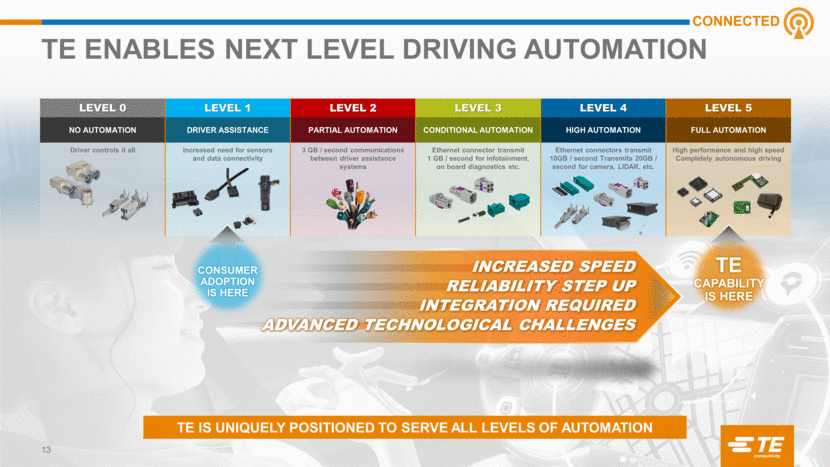
13 LEVEL 0 LEVEL 1 LEVEL 2 LEVEL 3 LEVEL 4 LEVEL 5 NO AUTOMATION DRIVER ASSISTANCE PARTIAL AUTOMATION CONDITIONAL AUTOMATION HIGH AUTOMATION FULL AUTOMATION Driver controls it all Increased need for sensors and data connectivity 3 GB / second communications between driver assistance systems Ethernet connector transmit 1 GB / second for infotainment, on board diagnostics etc. Ethernet connectors transmit 10GB / second Transmits 20GB / second for camera, LIDAR, etc. High performance and high speed Completely autonomous driving TE ENABLES NEXT LEVEL DRIVING AUTOMATION CONNECTED TE IS UNIQUELY POSITIONED TO SERVE ALL LEVELS OF AUTOMATION TE CAPABILITY IS HERE CONSUMER ADOPTION IS HERE INCREASED SPEED RELIABILITY STEP UP INTEGRATION REQUIRED ADVANCED TECHNOLOGICAL CHALLENGES
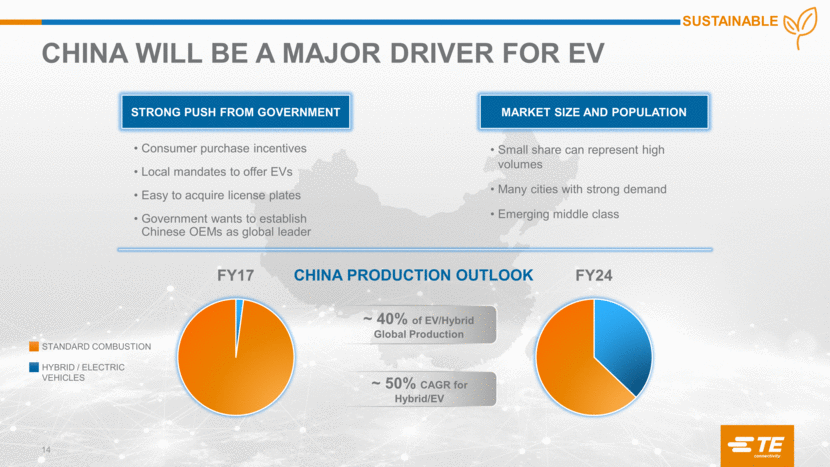
14 CHINA WILL BE A MAJOR DRIVER FOR EV Consumer purchase incentives Local mandates to offer EVs Easy to acquire license plates Government wants to establish Chinese OEMs as global leader STRONG PUSH FROM GOVERNMENT Small share can represent high volumes Many cities with strong demand Emerging middle class MARKET SIZE AND POPULATION CHINA PRODUCTION OUTLOOK FY17 FY24 STANDARD COMBUSTION HYBRID / ELECTRIC VEHICLES ~ 40% of EV/Hybrid Global Production ~ 50% CAGR for Hybrid/EV SUSTAINABLE
15 TE IS WINNING GLOBALLY WITH EV OEMS Tesla Model 3 EXPANDING OUR TECHNICAL EXPERTISE NIO New Energy Vehicle EXPANDING OUR CONTENT & OUR CUSTOMER BASE CPV $500+ CPV $100+ CPV SUSTAINABLE $120 TE EV AVERAGE

16 CHARGING CABLES & INLETS TEMPERATURE SENSORS CONNECTORS CABLES CURRENT SENSORS E-MOTORS MULTI-COIL RESOLVER RESOLVER ROTARY POSITION SENSOR TEMPERATURE SENSOR CABLE ASSEMBLY CONNECTORS BATTERY PERFORMANCE BATTERY DISCONNECT UNIT HIGH VOLTAGE CONNECTORS RELAYS & CONTACTORS RESISTORS UNIQUELY POSITIONED TO DELIVER END TO END SOLUTIONS FOR ELECTRIC VEHICLES SUSTAINABLE

TE INTEGRATED SOLUTIONS FOR EV BATTERIES BATTERY DISCONNECT UNIT SERVICE DISCONNECT CONNECTION ASSEMBLY CONNECTOR CONTACTORS RESISTORS & SENSORS (THERMAL & CURRENT) INTEGRATED CELL CONNECTION SYSTEM SENSORS (THERMAL & CURRENT) CONNECTOR TRADITIONAL Connector Only Content $20 INTEGRATED Content $200 SUSTAINABLE 17

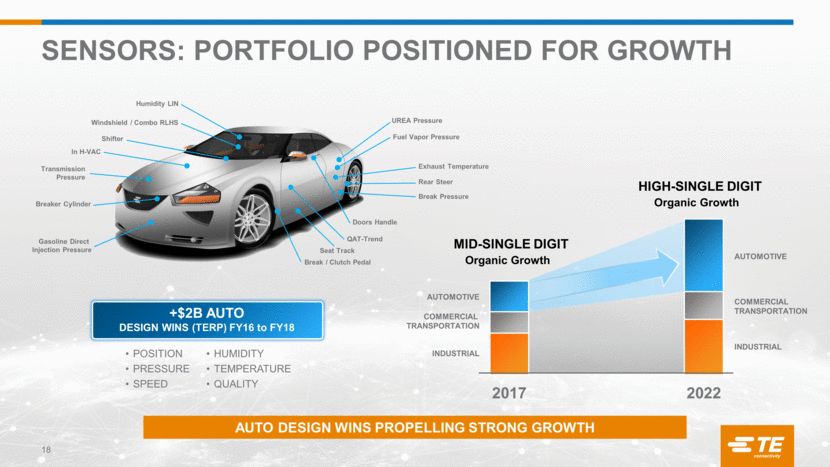
SENSORS: PORTFOLIO POSITIONED FOR GROWTH AUTO DESIGN WINS PROPELLING STRONG GROWTH INDUSTRIAL COMMERCIAL TRANSPORTATION AUTOMOTIVE INDUSTRIAL COMMERCIAL TRANSPORTATION AUTOMOTIVE +$2B AUTO DESIGN WINS (TERP) FY16 to FY18 POSITION PRESSURE SPEED HUMIDITY TEMPERATURE QUALITY Organic Growth HIGH-SINGLE DIGIT Organic Growth MID-SINGLE DIGIT Humidity LIN Windshield / Combo RLHS In H-VAC Shifter Breaker Cylinder Break / Clutch Pedal Seat Track Doors Handle Rear Steer Exhaust Temperature QAT-Trend Transmission Pressure Break Pressure Fuel Vapor Pressure UREA Pressure Gasoline Direct Injection Pressure 18
INDUSTRIAL SOLUTIONS 19

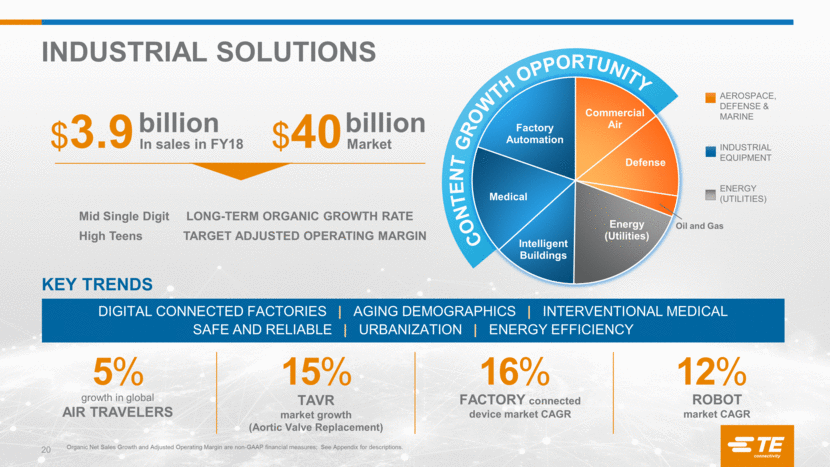
INDUSTRIAL SOLUTIONS 5% growth in global AIR TRAVELERS 15% TAVR market growth (Aortic Valve Replacement) 16% Mid Single Digit LONG-TERM ORGANIC GROWTH RATE High Teens TARGET ADJUSTED OPERATING MARGIN billion In sales in FY18 $3.9 billion Market $40 KEY TRENDS DIGITAL CONNECTED FACTORIES AGING DEMOGRAPHICS INTERVENTIONAL MEDICAL SAFE AND RELIABLE URBANIZATION ENERGY EFFICIENCY AEROSPACE, DEFENSE & MARINE INDUSTRIAL EQUIPMENT ENERGY (UTILITIES) Oil and Gas FACTORY connected device market CAGR 12% ROBOT market CAGR CONTENT GROWTH OPPORTUNITY Organic Net Sales Growth and Adjusted Operating Margin are non-GAAP financial measures; See Appendix for descriptions. 20
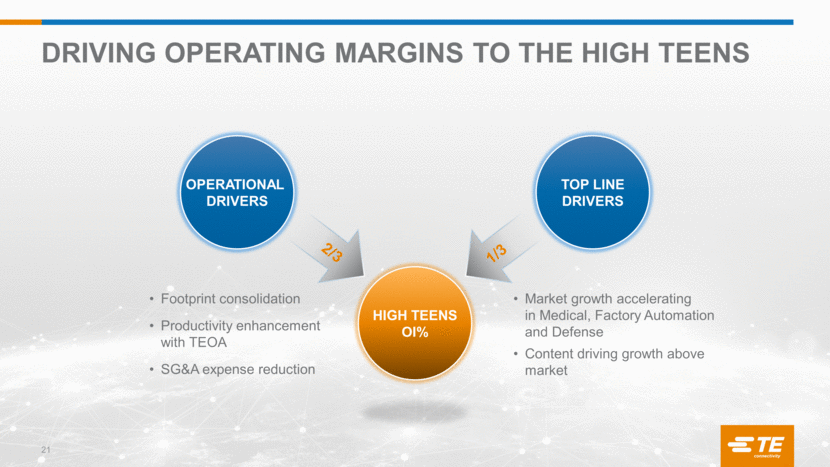
TOP LINE DRIVERS 21 DRIVING OPERATING MARGINS TO THE HIGH TEENS Footprint consolidation Productivity enhancement with TEOA SG&A expense reduction Market growth accelerating in Medical, Factory Automation and Defense Content driving growth above market OPERATIONAL DRIVERS HIGH TEENS OI% 2/3 1/3
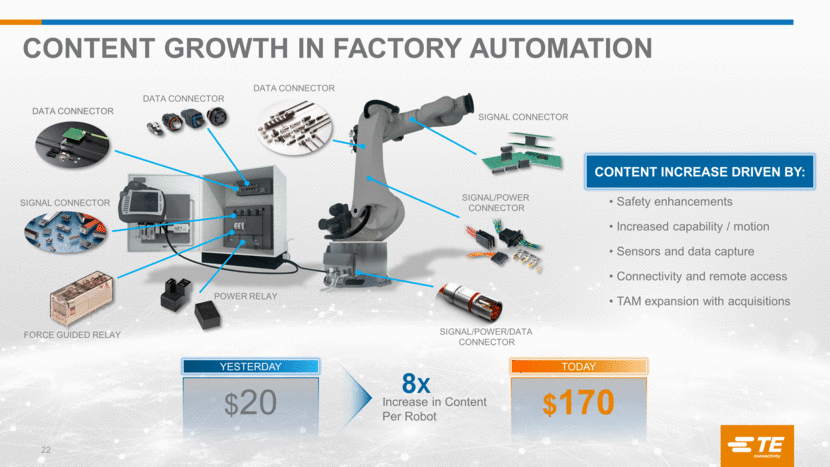
22 CONTENT GROWTH IN FACTORY AUTOMATION Safety enhancements Increased capability / motion Sensors and data capture Connectivity and remote access TAM expansion with acquisitions CONTENT INCREASE DRIVEN BY: $20 $170 YESTERDAY TODAY 8X Increase in Content Per Robot DATA CONNECTOR DATA CONNECTOR DATA CONNECTOR SIGNAL CONNECTOR SIGNAL/POWER CONNECTOR SIGNAL/POWER/DATA CONNECTOR POWER RELAY FORCE GUIDED RELAY SIGNAL CONNECTOR
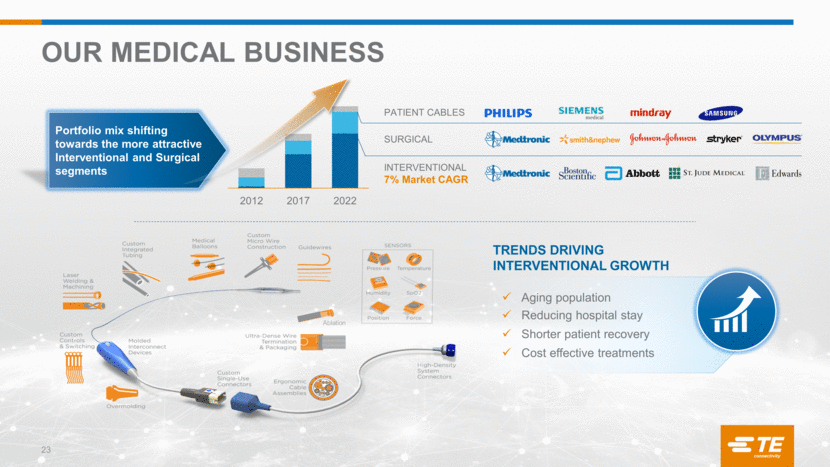
OUR MEDICAL BUSINESS Portfolio mix shifting towards the more attractive Interventional and Surgical segments Ablation TRENDS DRIVING INTERVENTIONAL GROWTH 2017 2022 2012 Aging population Reducing hospital stay Shorter patient recovery Cost effective treatments PATIENT CABLES SURGICAL INTERVENTIONAL 7% Market CAGR 23
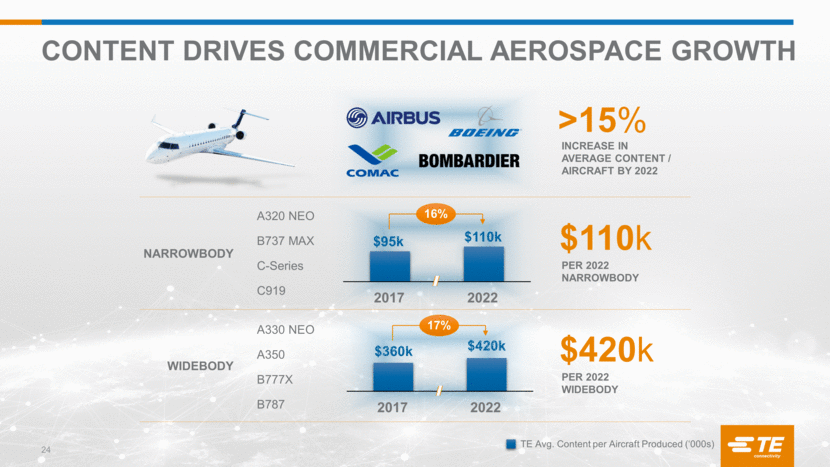
CONTENT DRIVES COMMERCIAL AEROSPACE GROWTH $420k PER 2022 Widebody $110k Per 2022 narrowbody >15% INCREASE IN AVERAGE Content / Aircraft by 2022 NARROWBODY WIDEBODY A320 NEO B737 MAX C-Series C919 2017 16% 2022 17% 2017 2022 A330 NEO A350 B777X B787 TE Avg. Content per Aircraft Produced (‘000s) 24 $95 k $110 k $360 k $420 k
COMMUNICATIONS SOLUTIONS 25

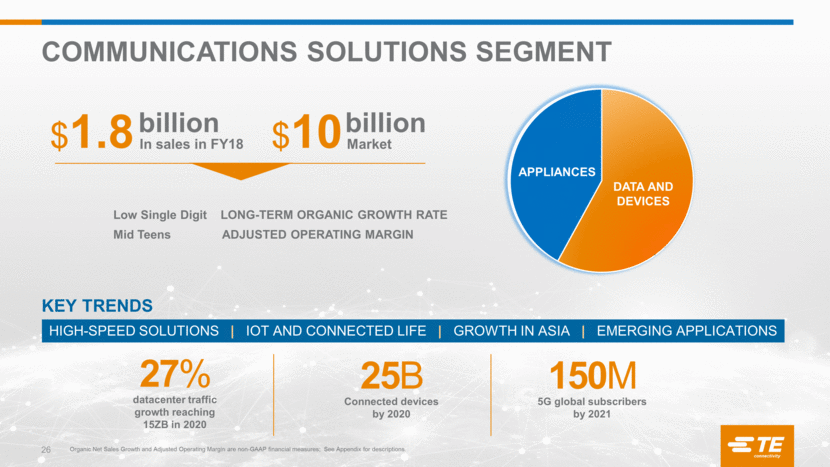
COMMUNICATIONS SOLUTIONS SEGMENT 27% datacenter traffic growth reaching 15ZB in 2020 150M 5G global subscribers by 2021 25B Connected devices by 2020 KEY TRENDS HIGH-SPEED SOLUTIONS IOT AND CONNECTED LIFE GROWTH IN ASIA EMERGING APPLICATIONS Low Single Digit LONG-TERM ORGANIC GROWTH RATE Mid Teens ADJUSTED OPERATING MARGIN billion In sales in FY18 $1.8 billion Market $10 DATA AND DEVICES APPLIANCES Organic Net Sales Growth and Adjusted Operating Margin are non-GAAP financial measures; See Appendix for descriptions. 26
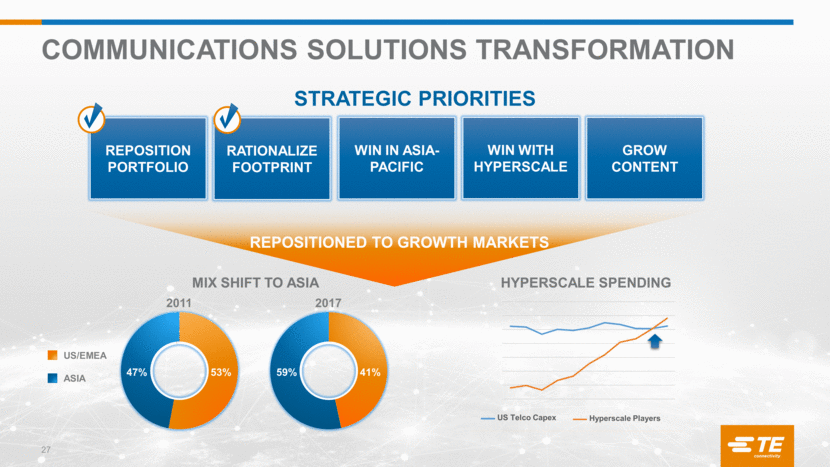
27 COMMUNICATIONS SOLUTIONS TRANSFORMATION GROW CONTENT REPOSITION PORTFOLIO WIN IN ASIA-PACIFIC WIN WITH HYPERSCALE RATIONALIZE FOOTPRINT STRATEGIC PRIORITIES HYPERSCALE SPENDING US Telco Capex Hyperscale Players REPOSITIONED TO GROWTH MARKETS MIX SHIFT TO ASIA 2011 2017 53% 47% 41% 59% US/EMEA ASIA
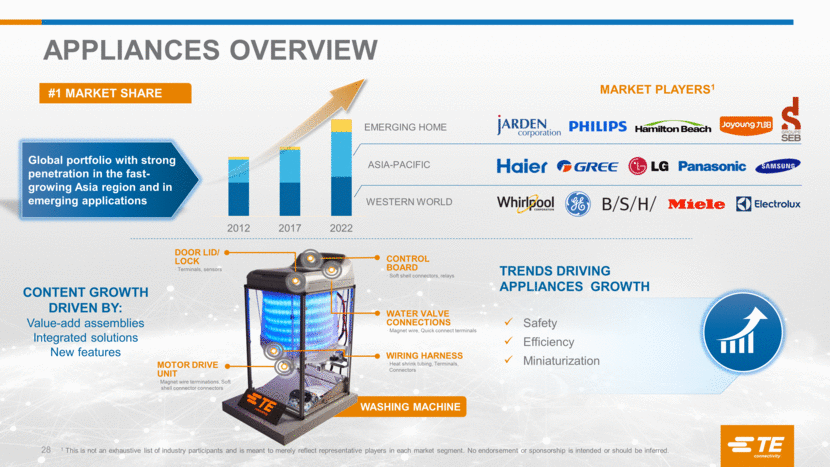
APPLIANCES OVERVIEW Global portfolio with strong penetration in the fast-growing Asia region and in emerging applications TRENDS DRIVING APPLIANCES GROWTH Safety Efficiency Miniaturization WESTERN WORLD ASIA-PACIFIC EMERGING HOME CONTENT GROWTH DRIVEN BY: Value-add assemblies Integrated solutions New features #1 MARKET SHARE MARKET PLAYERS1 CONTROL BOARD · Soft shell connectors, relays WIRING HARNESS · Heat shrink tubing, Terminals, Connectors WATER VALVE CONNECTIONS · Magnet wire, Quick connect terminals MOTOR DRIVE UNIT · Magnet wire terminations, Soft shell connector connectors DOOR LID/ LOCK · Terminals, sensors WASHING MACHINE 1 This is not an exhaustive list of industry participants and is meant to merely reflect representative players in each market segment. No endorsement or sponsorship is intended or should be inferred. 28 2012 2017 2022
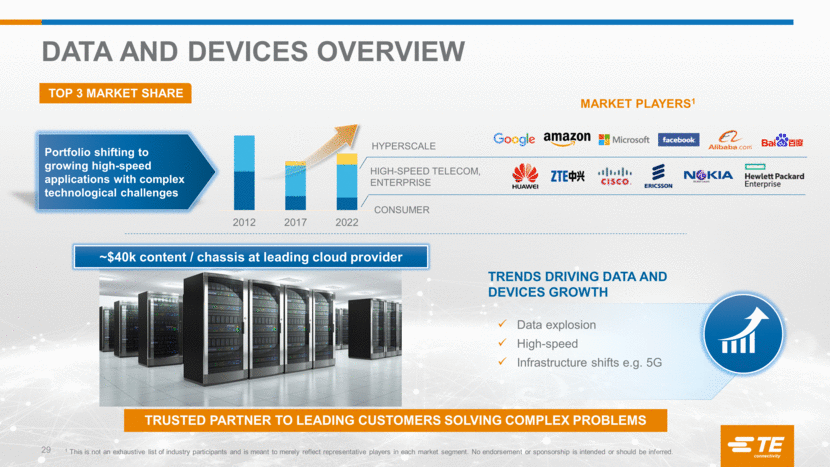
DATA AND DEVICES OVERVIEW Portfolio shifting to growing high-speed applications with complex technological challenges TRENDS DRIVING DATA AND DEVICES GROWTH Data explosion High-speed Infrastructure shifts e.g. 5G HIGH-SPEED TELECOM, ENTERPRISE CONSUMER HYPERSCALE TRUSTED PARTNER TO LEADING CUSTOMERS SOLVING COMPLEX PROBLEMS TOP 3 MARKET SHARE MARKET PLAYERS1 ~$40k content / chassis at leading cloud provider 1 This is not an exhaustive list of industry participants and is meant to merely reflect representative players in each market segment. No endorsement or sponsorship is intended or should be inferred. 29 2012 2017 2022
30 Appendix

31 Non-GAAP Financial Measures We present non-GAAP performance and liquidity measures as we believe it is appropriate for investors to consider adjusted financial measures in addition to results in accordance with accounting principles generally accepted in the U.S. (“GAAP”). These non-GAAP financial measures provide supplemental information and should not be considered replacements for results in accordance with GAAP. Management uses non-GAAP financial measures internally for planning and forecasting purposes and in its decision-making processes related to the operations of our company. We believe these measures provide meaningful information to us and investors because they enhance the understanding of our operating performance, ability to generate cash, and the trends of our business. Additionally, we believe that investors benefit from having access to the same financial measures that management uses in evaluating our operations. The primary limitation of these measures is that they exclude the financial impact of items that would otherwise either increase or decrease our reported results. This limitation is best addressed by using these non-GAAP financial measures in combination with the most directly comparable GAAP financial measures in order to better understand the amounts, character, and impact of any increase or decrease in reported amounts. These non-GAAP financial measures may not be comparable to similarly-titled measures reported by other companies. The following provides additional information regarding our non-GAAP financial measures: Organic Net Sales Growth – represents net sales growth (the most comparable GAAP financial measure) excluding the impact of foreign currency exchange rates, and acquisitions and divestitures that occurred in the preceding twelve months, if any. Organic Net Sales Growth is a useful measure of our performance because it excludes items that are not completely under management’s control, such as the impact of changes in foreign currency exchange rates, and items that do not reflect the underlying growth of the company, such as acquisition and divestiture activity. This measure is a significant component in our incentive compensation plans. Adjusted Operating Income and Adjusted Operating Margin – represent operating income and operating margin, respectively, (the most comparable GAAP financial measures) before special items including restructuring and other charges, acquisition related charges, and other income or charges, if any. We utilize these adjusted measures in combination with operating income and operating margin to assess segment level operating performance and to provide insight to management in evaluating segment operating plan execution and market conditions. Adjusted Operating Income is a significant component in our incentive compensation plans. Adjusted Other Income (Expense), Net – represents net other income (expense) (the most comparable GAAP financial measure) before special items including tax sharing income related to adjustments to prior period tax returns and other items, if any. Adjusted Income Tax Expense and Adjusted Effective Tax Rate – represent income tax expense and effective tax rate, respectively, (the most comparable GAAP financial measures) after adjusting for the tax effect of special items including restructuring and other charges, acquisition related charges, other income or charges, and certain significant tax items, if any. Adjusted Income from Continuing Operations – represents income from continuing operations (the most comparable GAAP financial measure) before special items including restructuring and other charges, acquisition related charges, tax sharing income related to adjustments to prior period tax returns and other tax items, other income or charges, and certain significant tax items, if any, and, if applicable, the related tax effects. Adjusted Earnings Per Share – represents diluted earnings per share from continuing operations (the most comparable GAAP financial measure) before special items including restructuring and other charges, acquisition related charges, tax sharing income related to adjustments to prior period tax returns and other tax items, other income or charges, and certain significant tax items, if any, and, if applicable, the related tax effects. This measure is a significant component in our incentive compensation plans. Net Sales Excluding the Impact of the Additional Week, Net Sales Growth Excluding the Impact of the Additional Week, Organic Net Sales Growth Excluding the Impact of the Additional Week, Adjusted Operating Income Excluding the Impact of the Additional Week, Adjusted Operating Margin Excluding the Impact of the Additional Week and Adjusted Earnings Per Share Excluding the Impact of the Additional Week – represent certain GAAP and non-GAAP financial measures excluding the impact of the additional week in the fourth quarter of the fiscal year for fiscal years which are 53 weeks in length. The impact of the additional week is estimated using an average weekly sales figure for the last month of the fiscal year.
32 Free Cash Flow (FCF) – is a useful measure of our ability to generate cash. The difference between net cash provided by continuing operating activities (the most comparable GAAP financial measure) and Free Cash Flow consists mainly of significant cash outflows and inflows that we believe are useful to identify. We believe Free Cash Flow provides useful information to investors as it provides insight into the primary cash flow metric used by management to monitor and evaluate cash flows generated from our operations. Free Cash Flow is defined as net cash provided by continuing operating activities excluding voluntary pension contributions and the cash impact of special items, if any, minus net capital expenditures. Voluntary pension contributions are excluded from the GAAP financial measure because this activity is driven by economic financing decisions rather than operating activity. Certain special items, including net payments related to pre-separation tax matters and cash paid (collected) pursuant to collateral requirements related to cross currency swaps, are also excluded by management in evaluating Free Cash Flow. Net capital expenditures consist of capital expenditures less proceeds from the sale of property, plant, and equipment. These items are subtracted because they represent long-term commitments. In the calculation of Free Cash Flow, we subtract certain cash items that are ultimately within management’s and the Board of Directors’ discretion to direct and may imply that there is less or more cash available for our programs than the most comparable GAAP financial measure indicates. It should not be inferred that the entire Free Cash Flow amount is available for future discretionary expenditures, as our definition of Free Cash Flow does not consider certain non-discretionary expenditures, such as debt payments. In addition, we may have other discretionary expenditures, such as discretionary dividends, share repurchases, and business acquisitions, that are not considered in the calculation of Free Cash Flow. Adjusted Return on Invested Capital (ROIC) – represents adjusted net operating profit after tax divided by average invested capital. We use Adjusted Return on Invested Capital as an indicator of our capital efficiency. Adjusted Return on Invested Capital is not a measure defined by GAAP. It is calculated by us, in part, using non-GAAP financial measures. We are providing our calculation of Adjusted Return on Invested Capital as this measure may not be defined and calculated by other companies in the same manner. Non-GAAP Financial Measures (continued)
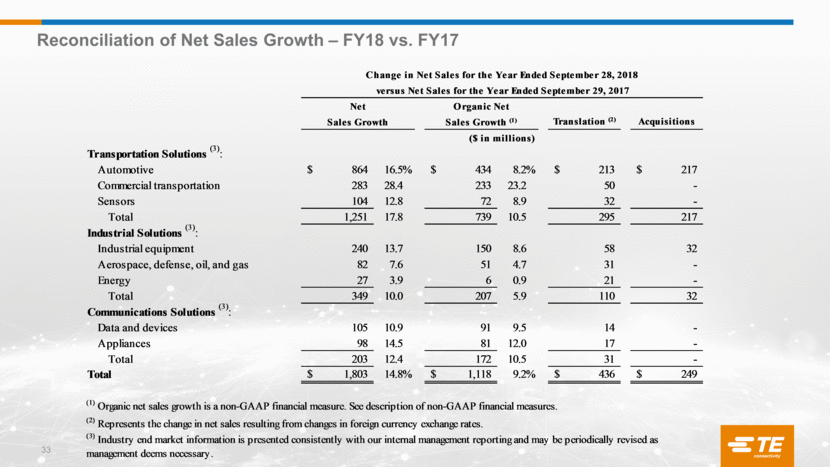
33 Reconciliation of Net Sales Growth – FY18 vs. FY17 Translation (2) Acquisitions Transportation Solutions (3) : Automotive 864 $ 16.5% 434 $ 8.2% 213 $ 217 $ Commercial transportation 283 28.4 233 23.2 50 - Sensors 104 12.8 72 8.9 32 - Total 1,251 17.8 739 10.5 295 217 Industrial Solutions (3) : Industrial equipment 240 13.7 150 8.6 58 32 Aerospace, defense, oil, and gas 82 7.6 51 4.7 31 - Energy 27 3.9 6 0.9 21 - Total 349 10.0 207 5.9 110 32 Communications Solutions (3) : Data and devices 105 10.9 91 9.5 14 - Appliances 98 14.5 81 12.0 17 - Total 203 12.4 172 10.5 31 - Total 1,803 $ 14.8% 1,118 $ 9.2% 436 $ 249 $ (1) Organic net sales growth is a non-GAAP financial measure. See description of non-GAAP financial measures. (2) Represents the change in net sales resulting from changes in foreign currency exchange rates. (3) Industry end market information is presented consistently with our internal management reporting and may be periodically revised as management deems necessary. Sales Growth Sales Growth (1) ($ in millions) Change in Net Sales for the Year Ended September 28, 2018 versus Net Sales for the Year Ended September 29, 2017 Net Organic Net
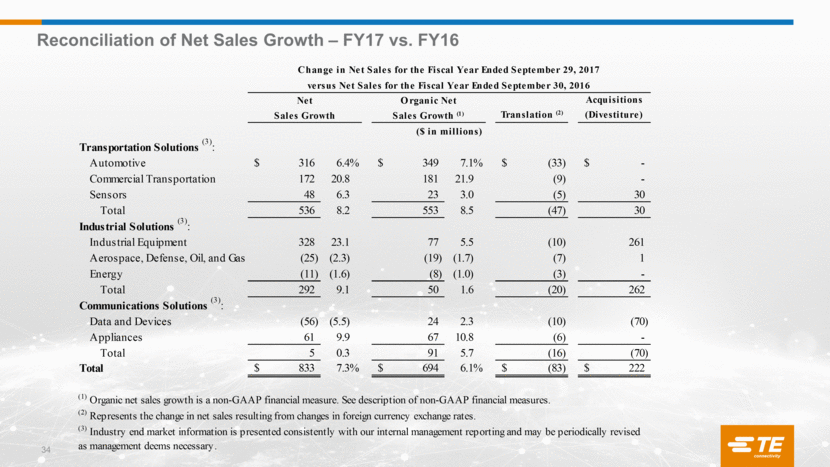
34 Reconciliation of Net Sales Growth – FY17 vs. FY16 Acquisitions Translation (2) (Divestiture) Transportation Solutions (3) : Automotive 316 $ 6.4% 349 $ 7.1% (33) $ - $ Commercial Transportation 172 20.8 181 21.9 (9) - Sensors 48 6.3 23 3.0 (5) 30 Total 536 8.2 553 8.5 (47) 30 Industrial Solutions (3) : Industrial Equipment 328 23.1 77 5.5 (10) 261 Aerospace, Defense, Oil, and Gas (25) (2.3) (19) (1.7) (7) 1 Energy (11) (1.6) (8) (1.0) (3) - Total 292 9.1 50 1.6 (20) 262 Communications Solutions (3) : Data and Devices (56) (5.5) 24 2.3 (10) (70) Appliances 61 9.9 67 10.8 (6) - Total 5 0.3 91 5.7 (16) (70) Total 833 $ 7.3% 694 $ 6.1% (83) $ 222 $ Sales Growth (1) (1) Organic net sales growth is a non-GAAP financial measure. See description of non-GAAP financial measures. (2) Represents the change in net sales resulting from changes in foreign currency exchange rates. (3) Industry end market information is presented consistently with our internal management reporting and may be periodically revised as management deems necessary. ($ in millions) versus Net Sales for the Fiscal Year Ended September 30, 2016 Change in Net Sales for the Fiscal Year Ended September 29, 2017 Net Organic Net Sales Growth
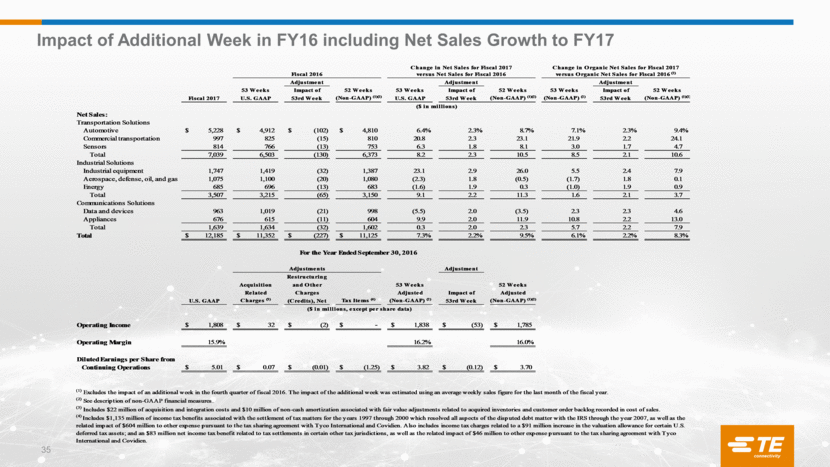
35 Impact of Additional Week in FY16 including Net Sales Growth to FY17 Adjustment Adjustment Adjustment 53 Weeks Impact of 52 Weeks 53 Weeks Impact of 52 Weeks 53 Weeks Impact of 52 Weeks U.S. GAAP 53rd Week (Non-GAAP) (1)(2) U.S. GAAP 53rd Week (Non-GAAP) (1)(2) (Non-GAAP) (2) 53rd Week (Non-GAAP) (1)(2) Net Sales: Transportation Solutions Automotive 5,228 $ 4,912 $ (102) $ 4,810 $ 6.4% 2.3% 8.7% 7.1% 2.3% 9.4% Commercial transportation 997 825 (15) 810 20.8 2.3 23.1 21.9 2.2 24.1 Sensors 814 766 (13) 753 6.3 1.8 8.1 3.0 1.7 4.7 Total 7,039 6,503 (130) 6,373 8.2 2.3 10.5 8.5 2.1 10.6 Industrial Solutions Industrial equipment 1,747 1,419 (32) 1,387 23.1 2.9 26.0 5.5 2.4 7.9 Aerospace, defense, oil, and gas 1,075 1,100 (20) 1,080 (2.3) 1.8 (0.5) (1.7) 1.8 0.1 Energy 685 696 (13) 683 (1.6) 1.9 0.3 (1.0) 1.9 0.9 Total 3,507 3,215 (65) 3,150 9.1 2.2 11.3 1.6 2.1 3.7 Communications Solutions Data and devices 963 1,019 (21) 998 (5.5) 2.0 (3.5) 2.3 2.3 4.6 Appliances 676 615 (11) 604 9.9 2.0 11.9 10.8 2.2 13.0 Total 1,639 1,634 (32) 1,602 0.3 2.0 2.3 5.7 2.2 7.9 Total 12,185 $ 11,352 $ (227) $ 11,125 $ 7.3% 2.2% 9.5% 6.1% 2.2% 8.3% Adjustment Restructuring Acquisition and Other 53 Weeks 52 Weeks Related Charges Adjusted Impact of Adjusted U.S. GAAP Charges (3) (Credits), Net Tax Items (4) (Non-GAAP) (2) 53rd Week (Non-GAAP) (1)(2) Operating Income 1,808 $ 32 $ (2) $ - $ 1,838 $ (53) $ 1,785 $ Operating Margin 15.9% 16.2% 16.0% Diluted Earnings per Share from Continuing Operations 5.01 $ 0.07 $ (0.01) $ (1.25) $ 3.82 $ (0.12) $ 3.70 $ (3) Includes $22 million of acquisition and integration costs and $10 million of non-cash amortization associated with fair value adjustments related to acquired inventories and customer order backlog recorded in cost of sales. (4) Includes $1,135 million of income tax benefits associated with the settlement of tax matters for the years 1997 through 2000 which resolved all aspects of the disputed debt matter with the IRS through the year 2007, as well as the related impact of $604 million to other expense pursuant to the tax sharing agreement with Tyco International and Covidien. Also includes income tax charges related to a $91 million increase in the valuation allowance for certain U.S. deferred tax assets; and an $83 million net income tax benefit related to tax settlements in certain other tax jurisdictions, as well as the related impact of $46 million to other expense pursuant to the tax sharing agreement with Tyco International and Covidien. ($ in millions) For the Year Ended September 30, 2016 Adjustments ($ in millions, except per share data) (1) Excludes the impact of an additional week in the fourth quarter of fiscal 2016. The impact of the additional week was estimated using an average weekly sales figure for the last month of the fiscal year. (2) See description of non-GAAP financial measures. Change in Net Sales for Fiscal 2017 versus Net Sales for Fiscal 2016 Change in Organic Net Sales for Fiscal 2017 versus Organic Net Sales for Fiscal 2016 (2) Fiscal 2017 Fiscal 2016
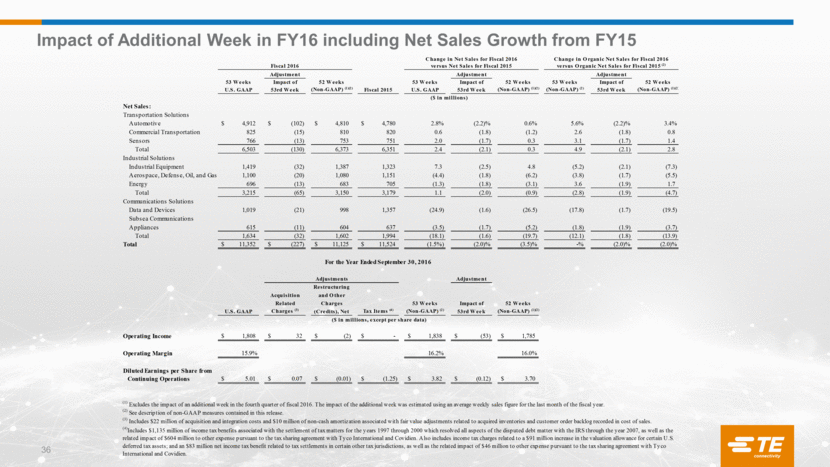
36 Impact of Additional Week in FY16 including Net Sales Growth from FY15 Adjustment Adjustment Adjustment 53 Weeks Impact of 52 Weeks 53 Weeks Impact of 52 Weeks 53 Weeks Impact of 52 Weeks U.S. GAAP 53rd Week (Non-GAAP) (1)(2) U.S. GAAP 53rd Week (Non-GAAP) (1)(2) (Non-GAAP) (2) 53rd Week (Non-GAAP) (1)(2) Net Sales: Transportation Solutions Automotive 4,912 $ (102) $ 4,810 $ 4,780 $ 2.8% (2.2)% 0.6% 5.6% (2.2)% 3.4% Commercial Transportation 825 (15) 810 820 0.6 (1.8) (1.2) 2.6 (1.8) 0.8 Sensors 766 (13) 753 751 2.0 (1.7) 0.3 3.1 (1.7) 1.4 Total 6,503 (130) 6,373 6,351 2.4 (2.1) 0.3 4.9 (2.1) 2.8 Industrial Solutions Industrial Equipment 1,419 (32) 1,387 1,323 7.3 (2.5) 4.8 (5.2) (2.1) (7.3) Aerospace, Defense, Oil, and Gas 1,100 (20) 1,080 1,151 (4.4) (1.8) (6.2) (3.8) (1.7) (5.5) Energy 696 (13) 683 705 (1.3) (1.8) (3.1) 3.6 (1.9) 1.7 Total 3,215 (65) 3,150 3,179 1.1 (2.0) (0.9) (2.8) (1.9) (4.7) Communications Solutions Data and Devices 1,019 (21) 998 1,357 (24.9) (1.6) (26.5) (17.8) (1.7) (19.5) Subsea Communications Appliances 615 (11) 604 637 (3.5) (1.7) (5.2) (1.8) (1.9) (3.7) Total 1,634 (32) 1,602 1,994 (18.1) (1.6) (19.7) (12.1) (1.8) (13.9) Total 11,352 $ (227) $ 11,125 $ 11,524 $ (1.5%) (2.0)% (3.5)% -% (2.0)% (2.0)% Adjustment Restructuring Acquisition and Other Related Charges 53 Weeks Impact of 52 Weeks U.S. GAAP Charges (3) (Credits), Net Tax Items (4) (Non-GAAP) (2) 53rd Week (Non-GAAP) (1)(2) Operating Income 1,808 $ 32 $ (2) $ - $ 1,838 $ (53) $ 1,785 $ Operating Margin 15.9% 16.2% 16.0% Diluted Earnings per Share from Continuing Operations 5.01 $ 0.07 $ (0.01) $ (1.25) $ 3.82 $ (0.12) $ 3.70 $ For the Year Ended September 30, 2016 Change in Net Sales for Fiscal 2016 versus Net Sales for Fiscal 2015 Change in Organic Net Sales for Fiscal 2016 versus Organic Net Sales for Fiscal 2015 (2) Fiscal 2016 Fiscal 2015 (4) Includes $1,135 million of income tax benefits associated with the settlement of tax matters for the years 1997 through 2000 which resolved all aspects of the disputed debt matter with the IRS through the year 2007, as well as the related impact of $604 million to other expense pursuant to the tax sharing agreement with Tyco International and Covidien. Also includes income tax charges related to a $91 million increase in the valuation allowance for certain U.S. deferred tax assets; and an $83 million net income tax benefit related to tax settlements in certain other tax jurisdictions, as well as the related impact of $46 million to other expense pursuant to the tax sharing agreement with Tyco International and Covidien. ($ in millions) Adjustments ($ in millions, except per share data) (1) Excludes the impact of an additional week in the fourth quarter of fiscal 2016. The impact of the additional week was estimated using an average weekly sales figure for the last month of the fiscal year. (2) See description of non-GAAP measures contained in this release. (3) Includes $22 million of acquisition and integration costs and $10 million of non-cash amortization associated with fair value adjustments related to acquired inventories and customer order backlog recorded in cost of sales.
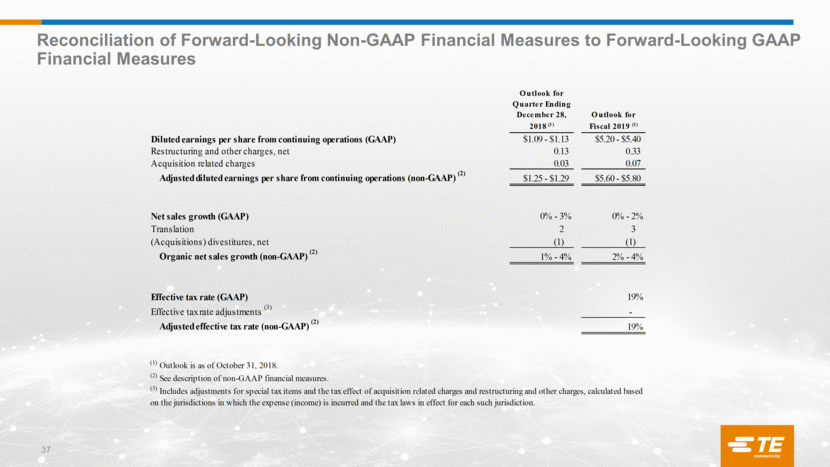
37 Reconciliation of Forward-Looking Non-GAAP Financial Measures to Forward-Looking GAAP Financial Measures Outlook for Quarter Ending December 28, Outlook for 2018 (1) Fiscal 2019 (1) Diluted earnings per share from continuing operations (GAAP) $1.09 - $1.13 $5.20 - $5.40 Restructuring and other charges, net 0.13 0.33 Acquisition related charges 0.03 0.07 Adjusted diluted earnings per share from continuing operations (non-GAAP) (2) $1.25 - $1.29 $5.60 - $5.80 Net sales growth (GAAP) 0% - 3% 0% - 2% Translation 2 3 (Acquisitions) divestitures, net (1) (1) Organic net sales growth (non-GAAP) (2) 1% - 4% 2% - 4% Effective tax rate (GAAP) 19% Effective tax rate adjustments (3) - Adjusted effective tax rate (non-GAAP) (2) 19% (3) Includes adjustments for special tax items and the tax effect of acquisition related charges and restructuring and other charges, calculated based on the jurisdictions in which the expense (income) is incurred and the tax laws in effect for each such jurisdiction. (1) Outlook is as of October 31, 2018. (2) See description of non-GAAP financial measures.
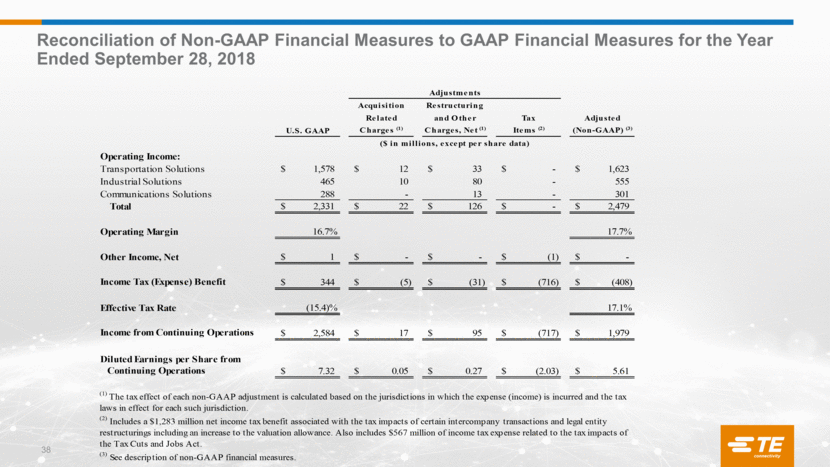
38 Reconciliation of Non-GAAP Financial Measures to GAAP Financial Measures for the Year Ended September 28, 2018 Acquisition Restructuring Related and Other Tax Adjusted U.S. GAAP Charges (1) Charges, Net (1) Items (2) (Non-GAAP) (3) Operating Income: Transportation Solutions 1,578 $ 12 $ 33 $ - $ 1,623 $ Industrial Solutions 465 10 80 - 555 Communications Solutions 288 - 13 - 301 Total 2,331 $ 22 $ 126 $ - $ 2,479 $ Operating Margin 16.7% 17.7% Other Income, Net 1 $ - $ - $ (1) $ - $ Income Tax (Expense) Benefit 344 $ (5) $ (31) $ (716) $ (408) $ Effective Tax Rate (15.4)% 17.1% Income from Continuing Operations 2,584 $ 17 $ 95 $ (717) $ 1,979 $ Diluted Earnings per Share from Continuing Operations 7.32 $ 0.05 $ 0.27 $ (2.03) $ 5.61 $ (3) See description of non-GAAP financial measures. ($ in millions, except per share data) (1) The tax effect of each non-GAAP adjustment is calculated based on the jurisdictions in which the expense (income) is incurred and the tax laws in effect for each such jurisdiction. Adjustments (2) Includes a $1,283 million net income tax benefit associated with the tax impacts of certain intercompany transactions and legal entity restructurings including an increase to the valuation allowance. Also includes $567 million of income tax expense related to the tax impacts of the Tax Cuts and Jobs Act.
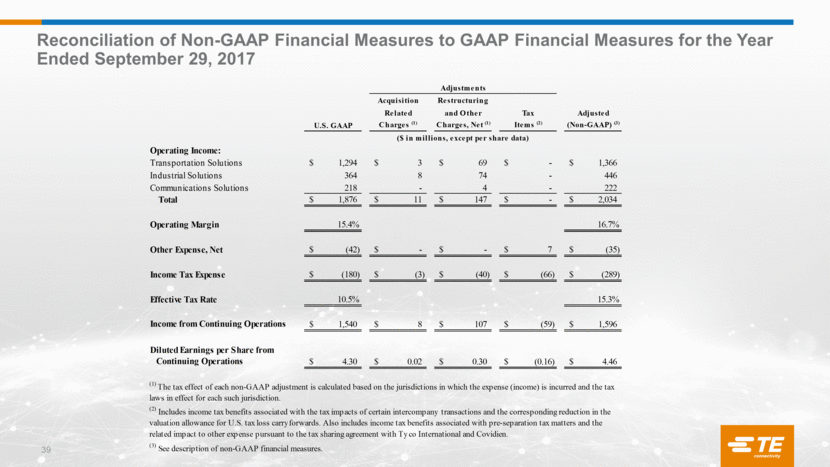
39 Reconciliation of Non-GAAP Financial Measures to GAAP Financial Measures for the Year Ended September 29, 2017 Acquisition Restructuring Related and Other Tax Adjusted U.S. GAAP Charges (1) Charges, Net (1) Items (2) (Non-GAAP) (3) Operating Income: Transportation Solutions 1,294 $ 3 $ 69 $ - $ 1,366 $ Industrial Solutions 364 8 74 - 446 Communications Solutions 218 - 4 - 222 Total 1,876 $ 11 $ 147 $ - $ 2,034 $ Operating Margin 15.4% 16.7% Other Expense, Net (42) $ - $ - $ 7 $ (35) $ Income Tax Expense (180) $ (3) $ (40) $ (66) $ (289) $ Effective Tax Rate 10.5% 15.3% Income from Continuing Operations 1,540 $ 8 $ 107 $ (59) $ 1,596 $ Diluted Earnings per Share from Continuing Operations 4.30 $ 0.02 $ 0.30 $ (0.16) $ 4.46 $ (1) The tax effect of each non-GAAP adjustment is calculated based on the jurisdictions in which the expense (income) is incurred and the tax laws in effect for each such jurisdiction. (2) Includes income tax benefits associated with the tax impacts of certain intercompany transactions and the corresponding reduction in the valuation allowance for U.S. tax loss carryforwards. Also includes income tax benefits associated with pre-separation tax matters and the related impact to other expense pursuant to the tax sharing agreement with Tyco International and Covidien. (3) See description of non-GAAP financial measures. Adjustments ($ in millions, except per share data)
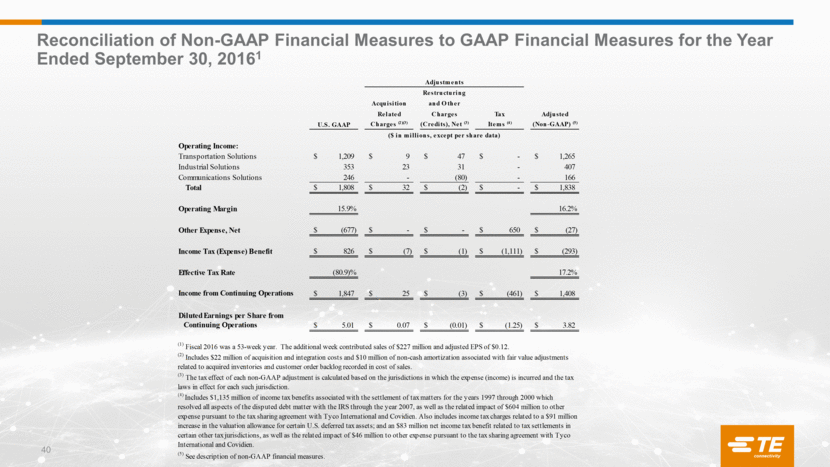
40 Reconciliation of Non-GAAP Financial Measures to GAAP Financial Measures for the Year Ended September 30, 20161 Restructuring Acquisition and Other Related Charges Tax Adjusted U.S. GAAP Charges (2)(3) (Credits), Net (3) Items (4) (Non-GAAP) (5) Operating Income: Transportation Solutions 1,209 $ 9 $ 47 $ - $ 1,265 $ Industrial Solutions 353 23 31 - 407 Communications Solutions 246 - (80) - 166 Total 1,808 $ 32 $ (2) $ - $ 1,838 $ Operating Margin 15.9% 16.2% Other Expense, Net (677) $ - $ - $ 650 $ (27) $ Income Tax (Expense) Benefit 826 $ (7) $ (1) $ (1,111) $ (293) $ Effective Tax Rate (80.9)% 17.2% Income from Continuing Operations 1,847 $ 25 $ (3) $ (461) $ 1,408 $ Diluted Earnings per Share from Continuing Operations 5.01 $ 0.07 $ (0.01) $ (1.25) $ 3.82 $ ($ in millions, except per share data) Adjustments (1) Fiscal 2016 was a 53-week year. The additional week contributed sales of $227 million and adjusted EPS of $0.12. (2) Includes $22 million of acquisition and integration costs and $10 million of non-cash amortization associated with fair value adjustments related to acquired inventories and customer order backlog recorded in cost of sales. (3) The tax effect of each non-GAAP adjustment is calculated based on the jurisdictions in which the expense (income) is incurred and the tax laws in effect for each such jurisdiction. (4) Includes $1,135 million of income tax benefits associated with the settlement of tax matters for the years 1997 through 2000 which resolved all aspects of the disputed debt matter with the IRS through the year 2007, as well as the related impact of $604 million to other expense pursuant to the tax sharing agreement with Tyco International and Covidien. Also includes income tax charges related to a $91 million increase in the valuation allowance for certain U.S. deferred tax assets; and an $83 million net income tax benefit related to tax settlements in certain other tax jurisdictions, as well as the related impact of $46 million to other expense pursuant to the tax sharing agreement with Tyco International and Covidien. (5) See description of non-GAAP financial measures.
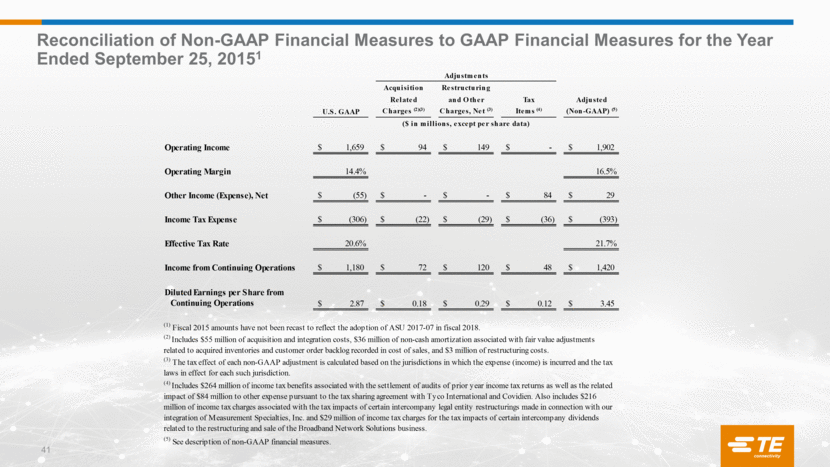
41 Reconciliation of Non-GAAP Financial Measures to GAAP Financial Measures for the Year Ended September 25, 20151 Acquisition Restructuring Related and Other Tax Adjusted U.S. GAAP Charges (2)(3) Charges, Net (3) Items (4) (Non-GAAP) (5) Operating Income 1,659 $ 94 $ 149 $ - $ 1,902 $ Operating Margin 14.4% 16.5% Other Income (Expense), Net (55) $ - $ - $ 84 $ 29 $ Income Tax Expense (306) $ (22) $ (29) $ (36) $ (393) $ Effective Tax Rate 20.6% 21.7% Income from Continuing Operations 1,180 $ 72 $ 120 $ 48 $ 1,420 $ Diluted Earnings per Share from Continuing Operations 2.87 $ 0.18 $ 0.29 $ 0.12 $ 3.45 $ ($ in millions, except per share data) Adjustments (3) The tax effect of each non-GAAP adjustment is calculated based on the jurisdictions in which the expense (income) is incurred and the tax laws in effect for each such jurisdiction. (4) Includes $264 million of income tax benefits associated with the settlement of audits of prior year income tax returns as well as the related impact of $84 million to other expense pursuant to the tax sharing agreement with Tyco International and Covidien. Also includes $216 million of income tax charges associated with the tax impacts of certain intercompany legal entity restructurings made in connection with our integration of Measurement Specialties, Inc. and $29 million of income tax charges for the tax impacts of certain intercompany dividends related to the restructuring and sale of the Broadband Network Solutions business. (5) See description of non-GAAP financial measures. (1) Fiscal 2015 amounts have not been recast to reflect the adoption of ASU 2017-07 in fiscal 2018. (2) Includes $55 million of acquisition and integration costs, $36 million of non-cash amortization associated with fair value adjustments related to acquired inventories and customer order backlog recorded in cost of sales, and $3 million of restructuring costs.