Attached files
| file | filename |
|---|---|
| 8-K - FORM 8-K 11/7/2018 - KITE REALTY GROUP TRUST | a8-kshell.htm |

investor-presentation-11-5-18B.indd 1 11/5/18 1:18 PM
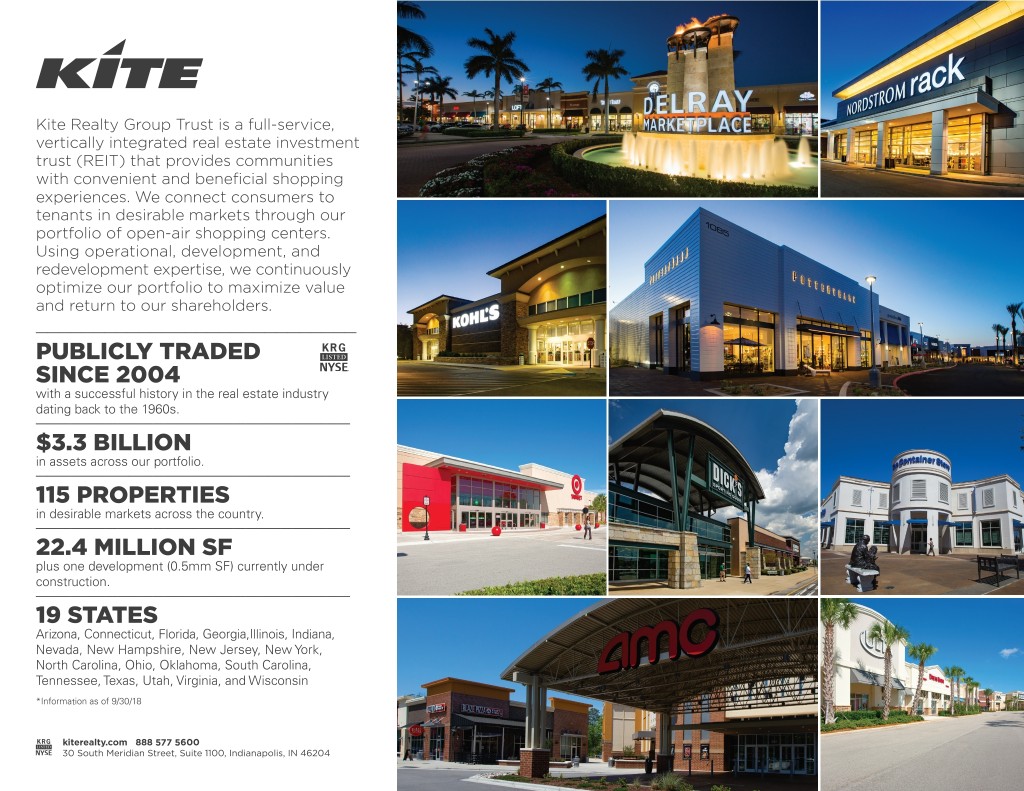
Kite Realty Group Trust is a full-service, vertically integrated real estate investment trust (REIT) that provides communities with convenient and beneficial shopping experiences. We connect consumers to tenants in desirable markets through our portfolio of open-air shopping centers. Using operational, development, and redevelopment expertise, we continuously optimize our portfolio to maximize value and return to our shareholders. ____________________________ PUBLICLY TRADED SINCE 2004 with a successful history in the real estate industry ___________________________dating back to the 1960s. $3.3 BILLION ___________________________in assets across our portfolio. 115 PROPERTIES ___________________________in desirable markets across the country. 22.4 MILLION SF plus one development (0.5mm SF) currently under ___________________________construction. 19 STATES Arizona, Connecticut, Florida, Georgia,Illinois, Indiana, Nevada, New Hampshire, New Jersey, New York, North Carolina, Ohio, Oklahoma, South Carolina, Tennessee, Texas, Utah, Virginia, and Wisconsin *Information as of 9/30/18 kiterealty.com 888 577 5600 30 South Meridian Street, Suite 1100, Indianapolis, IN 46204 investor-presentation-11-5-18B.indd 2 11/5/18 1:18 PM

WHY KITE? KRG FACTS • High-quality, geographically Number of Properties 115 November 2018 balanced portfolio with Total GLA (SF) 22.4mm INVESTOR UPDATE diverse tenant base Total Retail Operating Portfolio Leased 93.5% • Self-funded redevelopment, Percent Leased Anchors 94.7% Percent Leased Shops repurpose, and reposition 90.9% Annualized Base ("3-R") program1 Rent (ABR) Per SF $16.77 Average Center Size (SF) ~200,000 COMPANY • Investment grade, flexible Dividend Yield1 7.4% SNAPSHOT balance sheet FFO Payout 61.1% Moody's / S&P Ratings Baa3 / BBB- Community-Driven • Well-covered dividend with Open-Air Shopping attractive yield1 SMALL SHOP LEASED % Centers • Experienced, disciplined 90.9% team focused on operational 89.7% excellence 88.7% 87.5% Q3 2015 Q3 2016 Q3 2017 Q3 2018 Note: Unless otherwise indicated, the source of all Company data is publicly available information that has been filed with the Securities and Exchange Commission as of September 30, 2018. (1) Dividend yield calculated as most recent quarterly dividend, annualized and expressed as a percentage of the share price. Future dividends will be declared solely at the discretion of the Board of Trustees. 3 investor-presentation-11-5-18B.indd 3 11/5/18 1:18 PM

BUILDING VALUE AND CRITICAL MASS AROUND REGIONAL FOOTPRINTS November 2018 INVESTOR UPDATE Focused on experiential and diverse tenant offerings % of ABR derived from top 50 MSAs HIGH-QUALITY 76 and destination locations1 PORTFOLIO 93% of tenants are service/specialty/multi-channel % of ABR derived from community centers / 81 neighborhood centers / lifestyle centers Completed joint venture with TH Real Estate and will continue CORE to capitalize on portfolio-strengthening opportunities STRATEGY of additional cash NOI from in-process OPERATIONS $3.1mm 3-R and transitional projects AND GROWTH average annual same-property NOI growth OPPORTUNITIES % 3.0 over the last four years2 % annualized return on four completed 8.9 2018 3-R projects Well-laddered maturity schedule with all-time high liquidity level of close to $500 million in debt maturities through 2020 INVESTMENT $20.7mm GRADE % floating rate debt exposure BALANCE 10 SHEET 6.7x Net Debt to EBITDA ratio % maximum amount of total debt coming due in 20 any single calendar year (1) Destination locations include Naples, FL properties and college markets. (2) Historical numbers adjusted to include bad debt expense. 4 investor-presentation-11-5-18B.indd 4 11/5/18 1:18 PM
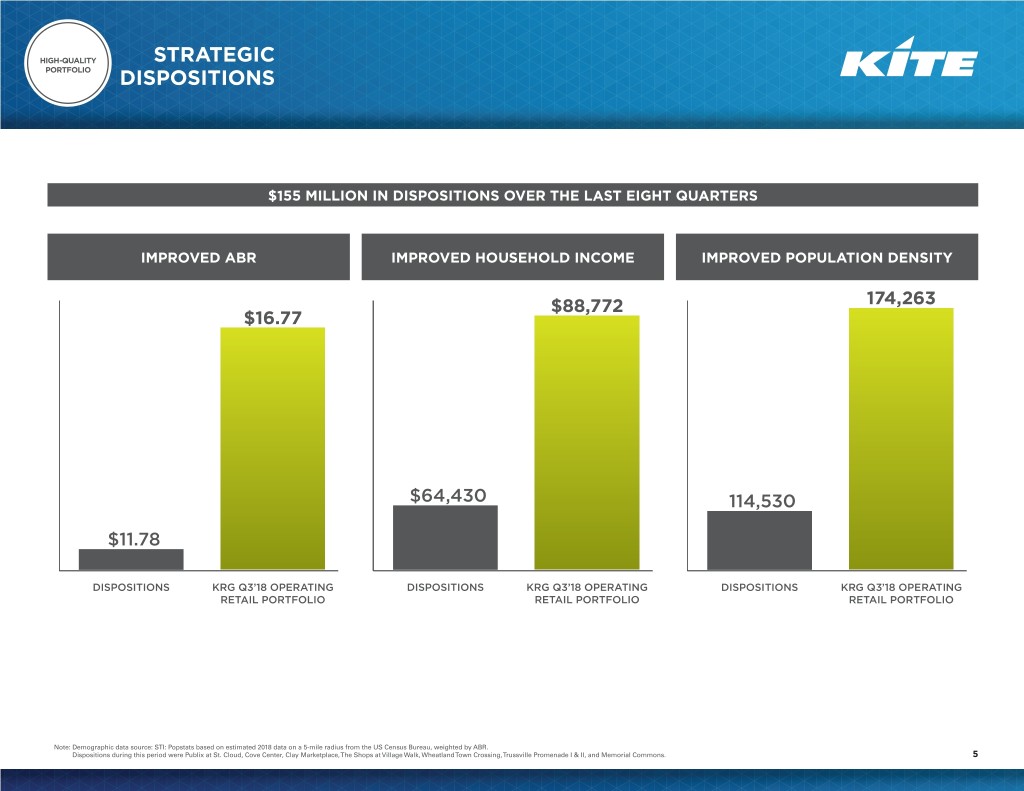
HIGH-QUALITY STRATEGIC PORTFOLIO DISPOSITIONS $155 MILLION IN DISPOSITIONS OVER THE LAST EIGHT QUARTERS IMPROVED ABR IMPROVED HOUSEHOLD INCOME IMPROVED POPULATION DENSITY $88,772 174,263 $16.77 $64,430 114,530 $11.78 DISPOSITIONS KRG Q3’18 OPERATING DISPOSITIONS KRG Q3’18 OPERATING DISPOSITIONS KRG Q3’18 OPERATING RETAIL PORTFOLIO RETAIL PORTFOLIO RETAIL PORTFOLIO Note: Demographic data source: STI: Popstats based on estimated 2018 data on a 5-mile radius from the US Census Bureau, weighted by ABR. Dispositions during this period were Publix at St. Cloud, Cove Center, Clay Marketplace, The Shops at Village Walk, Wheatland Town Crossing, Trussville Promenade I & II, and Memorial Commons. 5 investor-presentation-11-5-18B.indd 5 11/5/18 1:18 PM
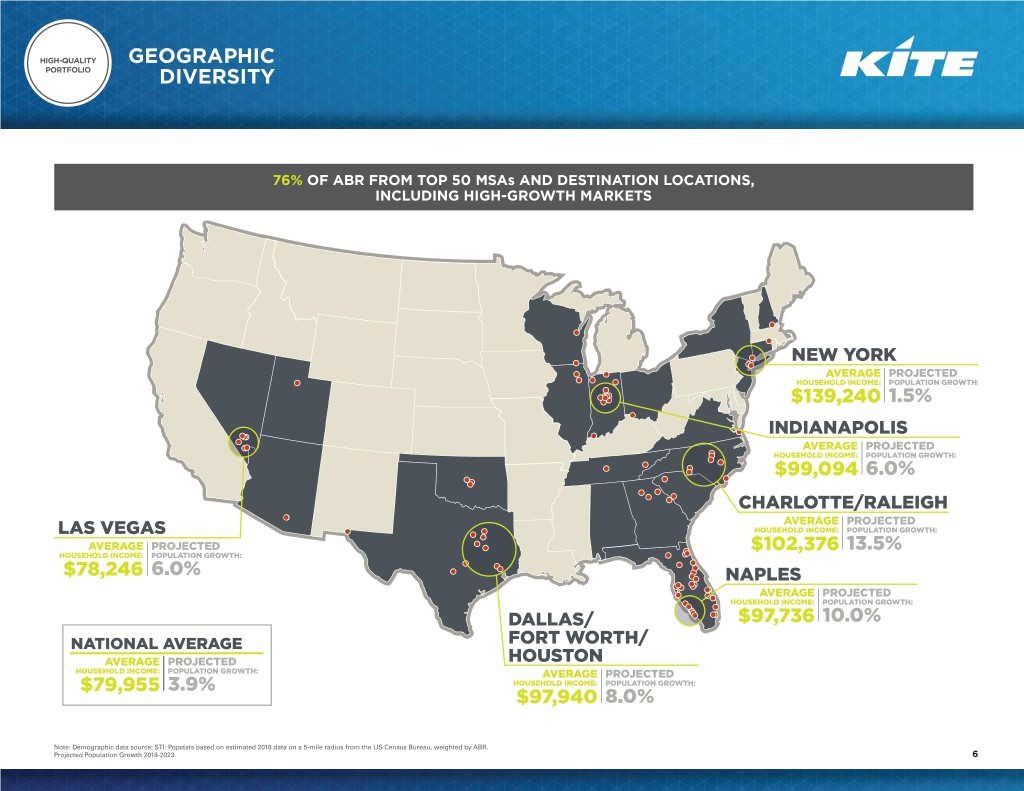
HIGH-QUALITY GEOGRAPHIC PORTFOLIO DIVERSITY 76% OF ABR FROM TOP 50 MSAs AND DESTINATION LOCATIONS, INCLUDING HIGH-GROWTH MARKETS NEW YORK AVERAGE PROJECTED HOUSEHOLD INCOME: POPULATION GROWTH: $139,240 1.5% INDIANAPOLIS AVERAGE PROJECTED HOUSEHOLD INCOME: POPULATION GROWTH: $99,094 6.0% CHARLOTTE/RALEIGH AVERAGE PROJECTED LAS VEGAS HOUSEHOLD INCOME: POPULATION GROWTH: AVERAGE PROJECTED $102,376 13.5% HOUSEHOLD INCOME: POPULATION GROWTH: $78,246 6.0% NAPLES AVERAGE PROJECTED HOUSEHOLD INCOME: POPULATION GROWTH: DALLAS/ $97,736 10.0% NATIONAL AVERAGE FORT WORTH/ AVERAGE PROJECTED HOUSTON HOUSEHOLD INCOME: POPULATION GROWTH: AVERAGE PROJECTED $79,955 3.9% HOUSEHOLD INCOME: POPULATION GROWTH: $97,940 8.0% Note: Demographic data source: STI: Popstats based on estimated 2018 data on a 5-mile radius from the US Census Bureau, weighted by ABR. Projected Population Growth 2018-2023. 6 investor-presentation-11-5-18B.indd 6 11/5/18 1:18 PM

HIGH-QUALITY STRATEGIC PORTFOLIO ASSET MIX PROPERTY CLASSIFICATION BY ABR1 COMMUNITY % NEIGHBORHOOD CENTER/ % POWER CENTER % 57 LIFESTYLE CENTER/ 24 19 CENTER PORTFOLIO OF ABR OTHER PORTFOLIO OF ABR PORTFOLIO OF ABR Average 2018 Average 2018 Average 2018 Household Income $90,101 Household Income $89,139 Household Income $84,360 Average 2018 Average 2018 Average 2018 Population 176,990 Population 159,135 Population 185,120 PARKSIDE TOWN COMMONS MSA: Raleigh, NC COBBLESTONE PLAZA MSA: Pembroke Pines, FL LANDSTOWN COMMONS MSA: Virginia Beach, VA (1) STI: Popstats based on estimated 2018 data on a 5-mile radius from the U.S. Census Bureau, weighted by ABR. Property classification based on definition by Green Street Advisors. In summary: Neighborhood Center: Convenience-oriented center often anchored by a grocery. Community Center: Larger center with general merchandise or convenience-oriented offerings. Power Center: Category-dominant anchors, including discount, off-price, and wholesale clubs with minimal small shop tenants. 7 investor-presentation-11-5-18B.indd 7 11/5/18 1:18 PM

HIGH-QUALITY DIVERSE PORTFOLIO TENANT BASE Top 10 Tenants by ABR1 Credit Rating2 # Stores1 % ABR1 RECENT LEASE ACTIVITY EXAMPLES 1 The TJX Companies, Inc. A+ 22 2.6% 2 Publix Supermarkets, Inc. NR 14 2.5% 3 Bed Bath & Beyond, Inc. BB+ 19 2.3% 4 Petsmart, Inc. CCC 18 2.1% 5 Ross Stores, Inc. A- 17 2.0% 6 Lowe's Companies, Inc. A- 5 1.9% 7 Dick's Sporting Goods, Inc. NR 8 1.6% 8 Michaels Stores, Inc. BB- 15 1.6% 9 Nordstrom, Inc. BBB+ 6 1.5% 10 Ascena Retail Group B 32 1.5% TOTAL 156 19.6% (1) Per the Q3'18 supplemental. (2) Credit Rating from S&P, as of 11/1/18 8 investor-presentation-11-5-18B.indd 8 11/5/18 1:18 PM

HIGH-QUALITY DIVERSE PORTFOLIO TENANT BASE WELL-POSITIONED TO MANAGE EVOLVING CONSUMER PREFERENCES % 17.2 RESTAURANTS % SERVICES, ENTERTAINMENT 21.6 % 15.8 GROCER, SPECIALTY STORES TENANT TYPE % OFFICE SUPPLIES 1.9 COMPOSITION BY ABR % SPORTING GOODS 3.4 % ELECTRONICS & BOOKS 5.0 % 12.9 SOFT GOODS % DISCOUNT RETAILERS 11.0 % 11.2 HOME IMPROVEMENT GOODS 9 investor-presentation-11-5-18B.indd 9 11/5/18 1:18 PM
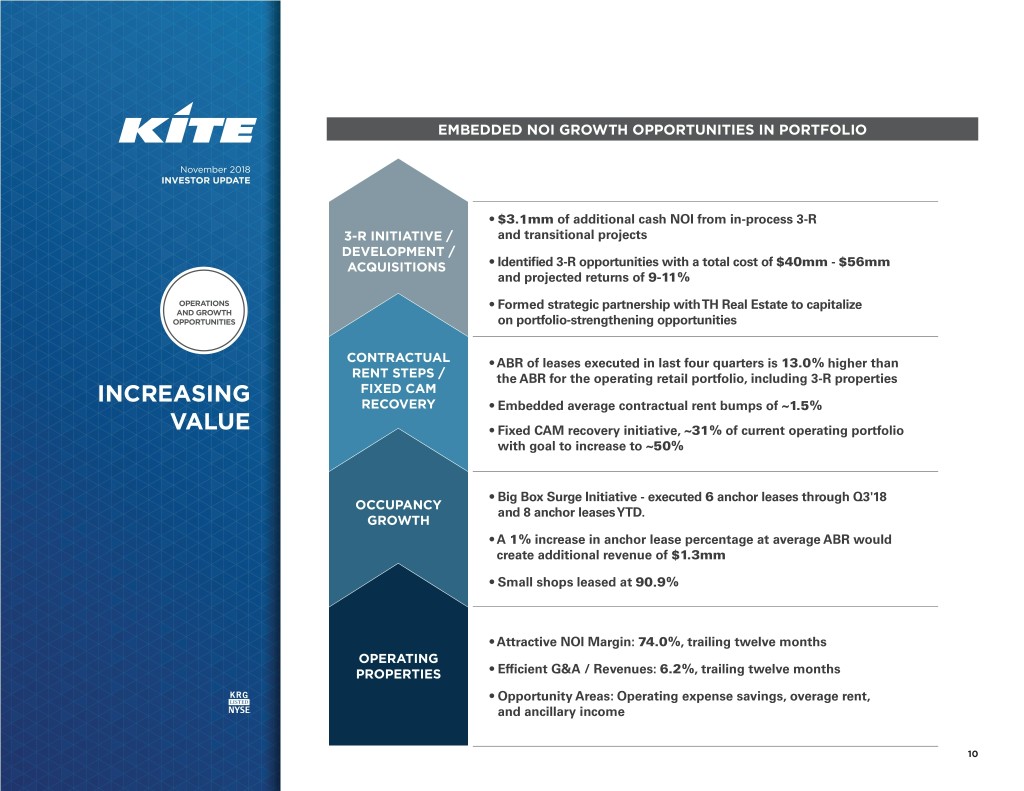
EMBEDDED NOI GROWTH OPPORTUNITIES IN PORTFOLIO November 2018 INVESTOR UPDATE • $3.1mm of additional cash NOI from in-process 3-R 3-R INITIATIVE / and transitional projects DEVELOPMENT / ACQUISITIONS • Identified 3-R opportunities with a total cost of $40mm - $56mm and projected returns of 9-11% OPERATIONS • Formed strategic partnership with TH Real Estate to capitalize AND GROWTH OPPORTUNITIES on portfolio-strengthening opportunities CONTRACTUAL • ABR of leases executed in last four quarters is 13.0% higher than RENT STEPS / the ABR for the operating retail portfolio, including 3-R properties FIXED CAM INCREASING RECOVERY • Embedded average contractual rent bumps of ~1.5% VALUE • Fixed CAM recovery initiative, ~31% of current operating portfolio with goal to increase to ~50% • Big Box Surge Initiative - executed 6 anchor leases through Q3'18 OCCUPANCY and 8 anchor leases YTD. GROWTH • A 1% increase in anchor lease percentage at average ABR would create additional revenue of $1.3mm • Small shops leased at 90.9% • Attractive NOI Margin: 74.0%, trailing twelve months OPERATING PROPERTIES • Efficient G&A / Revenues: 6.2%, trailing twelve months • Opportunity Areas: Operating expense savings, overage rent, and ancillary income 10 investor-presentation-11-5-18B.indd 10 11/5/18 1:18 PM

KITE'S 3-R PLATFORM HAS GENERATED ATTRACTIVE RISK-ADJUSTED RETURNS, IMPROVING CASH FLOW AND ASSET QUALITY November 2018 REDEVELOP REPURPOSE REPOSITION INVESTOR UPDATE Substantial renovations, Significant property Less substantial asset including teardowns, alterations, including enhancements, generally remerchandising, product-type changes representing investment and exterior/interior of $5mm or less improvements OPERATIONS IDENTIFIED AND GROWTH COMPLETED IN-PROCESS OPPORTUNITIES OPPORTUNITIES $44.1mm of 3-R projects $24.5mm - $27.5mm of $40mm - $56mm of in 2018 with 8.9% Return projects with 9.0-10.0% ROI projects with 9-11% ROI on Investment (ROI) 3-R OVERVIEW CITY CENTER MSA: White Plains, NY PORTOFINO SHOPPING CENTER MSA: Houston, TX SOURCES OF CAPITAL Free cash flow + strategic property sales 11 investor-presentation-11-5-18B.indd 11 11/5/18 1:18 PM
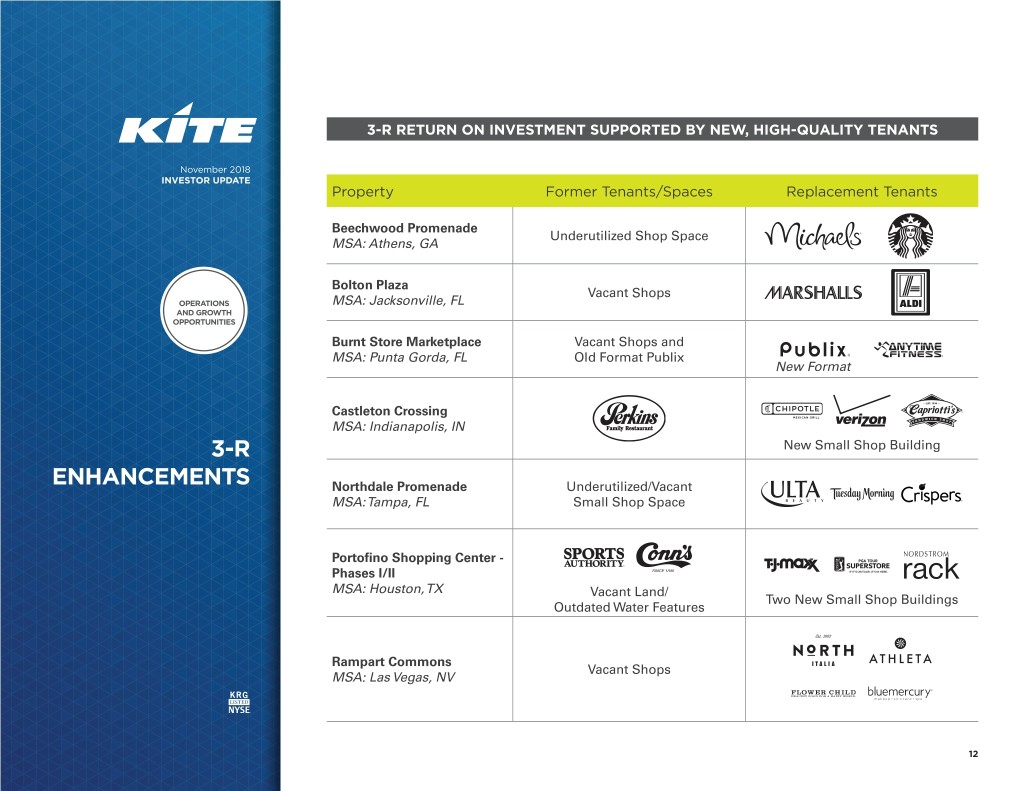
3-R RETURN ON INVESTMENT SUPPORTED BY NEW, HIGH-QUALITY TENANTS November 2018 INVESTOR UPDATE Property Former Tenants/Spaces Replacement Tenants Beechwood Promenade Underutilized Shop Space MSA: Athens, GA Bolton Plaza Vacant Shops OPERATIONS MSA: Jacksonville, FL AND GROWTH OPPORTUNITIES Burnt Store Marketplace Vacant Shops and MSA: Punta Gorda, FL Old Format Publix New Format Castleton Crossing MSA: Indianapolis, IN 3-R New Small Shop Building ENHANCEMENTS Northdale Promenade Underutilized/Vacant MSA: Tampa, FL Small Shop Space Portofino Shopping Center - Phases I/II MSA: Houston, TX Vacant Land/ Two New Small Shop Buildings Outdated Water Features Rampart Commons Vacant Shops MSA: Las Vegas, NV 12 investor-presentation-11-5-18B.indd 12 11/5/18 1:18 PM

INVESTMENT STRONG GRADE BALANCE Well-Staggered Debt Maturity Profile SHEET BALANCE SHEET SCHEDULE OF DEBT MATURITIES ($ IN MILLIONS)1 20% of total company debt 250 150.0 95.0 300 212.9 24.3 181.9 Only $20.7mm of debt 166.4 maturing through 2020 80.0 75 10.3 10.4 20.7 16.9 10.2 2018 2019 2020 2021 2022 2023 2024 2025 2026 2027+ MORTGAGE DEBT UNCONSOLIDATED LINE OF CREDIT UNSECURED TERM LOAN UNSECURED DEBT (1) Chart as of 10/31/18. Excludes annual principal payments and net premiums on fixed rate debt. 13 investor-presentation-11-5-18B.indd 13 11/5/18 1:18 PM

DISCLAIMER FORWARD-LOOKING STATEMENTS This supplemental information package, together with other statements and information publicly disseminated by us, contains certain forward-looking statements within the meaning of Section 27A of the Securities Act of 1933 and Section 21E of the Securities Exchange Act of 1934. Such statements are based on assumptions and expectations that may not be realized and are inherently subject to risks, uncertainties and other factors, many of which cannot be predicted with accuracy and some of which might not even be anticipated. Future events and actual results, performance, transactions or achievements, financial or otherwise, may differ materially from the results, performance, transactions or achievements, financial or otherwise, expressed or implied by the forward-looking statements. Risks, uncertainties and other factors that might cause such differences, some of which could be material, include but are not limited to: • national and local economic, business, real estate and other market conditions, particularly in light of low growth in the U.S. economy as well as economic uncertainty caused by fluctuations in the prices of oil and other energy sources and inflationary trends or outlook; • financing risks, including the availability of, and costs associated with, sources of liquidity; • our ability to refinance, or extend the maturity dates of, our indebtedness; • the level and volatility of interest rates; • the financial stability of tenants, including their ability to pay rent and the risk of tenant bankruptcies; • the competitive environment in which the Company operates; • acquisition, disposition, development and joint venture risks; • property ownership and management risks; • our ability to maintain our status as a real estate investment trust for federal income tax purposes; • potential environmental and other liabilities; • impairment in the value of real estate property the Company owns; • the actual and perceived impact of online retail on the value of shopping center assets; • risks related to the geographical concentration of our properties in Florida, Indiana and Texas; • insurance costs and coverage; • risks associated with cybersecurity attacks and the loss of confidential information and other business disruptions; • other factors affecting the real estate industry generally; and • other risks identified in reports the Company files with the Securities and Exchange Commission (“the SEC”) or in other documents that it publicly disseminates, including, in particular, the section titled “Risk Factors” in our Annual Report on Form 10-K for the fiscal year ended December 31, 2017, and in our quarterly reports on Form 10-Q. The Company undertakes no obligation to publicly update or revise these forward-looking statements, whether as a result of new information, future events or otherwise. 14 investor-presentation-11-5-18B.indd 14 11/5/18 1:18 PM

NON-GAAP FINANCIAL MEASURES FUNDS FROM OPERATIONS Funds from Operations (FFO) is a widely used performance measure for real estate companies and is provided here as a supplemental measure of operating performance. The Company calculates FFO, a non-GAAP financial measure, in accordance with the best practices described in the April 2002 National Policy Bulletin of the National Association of Real Estate Investment Trusts ("NAREIT"). The NAREIT white paper defines FFO as net income (determined in accordance with GAAP), excluding gains (or losses) from sales and impairments of depreciated property, plus de- preciation and amortization, and after adjustments for unconsolidated partnerships and joint ventures. Considering the nature of our business as a real estate owner and operator, the Company believes that FFO is helpful to investors in measuring our operational performance because it excludes various items included in net income that do not relate to or are not indicative of our operating performance, such as gains or losses from sales of depreciated property and depreciation and amortization, which can make periodic and peer analyses of operating performance more difficult. FFO should not be considered as an alternative to net income (determined in accordance with GAAP) as an indicator of our financial performance, is not an alternative to cash flow from operating activities (determined in accordance with GAAP) as a measure of our liquidity, and is not indicative of funds available to satisfy our cash needs, including our ability to make distribu- tions. Our computation of FFO may not be comparable to FFO reported by other REITs that do not define the term in accordance with the current NAREIT definition or that interpret the current NAREIT definition differently than we do. A reconciliation of net income (computed in accordance with GAAP) to FFO is included in the Q3'18 Financial Supplement. 15 investor-presentation-11-5-18B.indd 15 11/5/18 1:18 PM

NON-GAAP FINANCIAL MEASURES NET OPERATING INCOME AND SAME PROPERTY NET OPERATING INCOME The Company uses property net operating income (“NOI”), a non-GAAP financial measure, to evaluate the performance of our properties. The Company defines NOI as income from our real estate, including lease termination fees received from tenants, less our property operating expenses. NOI excludes amortization of capitalized tenant improvement costs and leasing commissions and certain corporate level expenses. The Company believes that NOI is helpful to investors as a measure of our operating performance because it excludes various items included in net income that do not relate to or are not indicative of our operating performance, such as depreciation and amortization, interest expense, and impairment, if any. The Company also uses same property NOI ("Same Property NOI"), a non-GAAP financial measure, to evaluate the performance of our prop- erties. Same Property NOI excludes properties that have not been owned for the full period presented. It also excludes net gains from outlot sales, straightline rent revenue, lease termination fees, amortization of lease intangibles and significant prior period expense recoveries and adjustments, if any. The Company believes that Same Property NOI is helpful to investors as a measure of our operating performance because it includes only the NOI of properties that have been owned and fully operational for the full quarters presented. The Company believes such presentation eliminates disparities in net income due to the acquisition or disposition of properties during the particular quarters presented and thus provides a more consistent comparison of our properties. The year-to-date results represent the sum of the individual quarters, as reported. NOI and Same Property NOI should not, however, be considered as alternatives to net income (calculated in accordance with GAAP) as indicators of our financial performance. Our computation of NOI and Same Property NOI may differ from the methodology used by other REITs, and therefore may not be comparable to such other REITs. When evaluating the properties that are included in the same property pool, the Company has established specific criteria for determining the inclusion of properties acquired or those recently under development. An acquired property is included in the same property pool when there is a full quarter of operations in both years subsequent to the acquisition date. Development and redevelopment properties are included in the same property pool four full quarters after the properties have been transferred to the operating portfolio. A redevelopment property is first excluded from the same property pool when the execution of a redevelopment plan is likely and the Company begins recapturing space from tenants. For the quarter ended September 30, 2018, the Company excluded five redevelopment properties and the recently completed City Center, Burnt Store Marketplace, and Fishers Station redevelopments from the same property pool that met these criteria and were owned in both comparable periods. 16 investor-presentation-11-5-18B.indd 16 11/5/18 1:18 PM

APPENDIX – RECONCILIATION OF SAME PROPERTY NOI TO NET INCOME SAME PROPERTY NET OPERATING INCOME (NOI) ($ in thousands) Three Months Ended September 30, Nine Months Ended September 30, % % 2018 2017 Change 2018 2017 Change Number of properties for the quarter1 104 104 Leased percentage at period end 93.9% 94.4% 93.9% 94.4% Economic Occupancy percentage2 92.3% 93.0% 92.9% 93.6% Minimum rent $ 59,913 $ 58,820 $ 175,734 $ 173,448 Tenant recoveries 17,299 16,188 50,432 48,722 Other income 430 391 941 849 77,642 75,399 227,107 223,019 Property operating expenses (11,144) (10,368) (32,611) (30,873) Bad debt expense (537) (508) (1,352) (1,971) Real estate taxes (10,601) (9,981) (30,291) (29,693) (22,282) (20,857) (64,254) (62,537) Same Property NOI3 $ 55,360 $ 54,542 1.5% $ 162,853 $ 160,482 1.5% Reconciliation of Same Property NOI to Most Directly Comparable GAAP Measure: Net operating income - same properties $ 55,360 $ 54,542 $ 162,853 $ 160,482 Net operating income - non-same activity4 6,985 9,911 32,427 40,084 Other (expense) income, net (247) (61) 1,865 (250) General, administrative and other (4,865) (5,431) (16,364) (16,389) Impairment charges — — (38,847) (7,411) Depreciation and amortization expense (36,858) (42,793) (115,864) (131,333) Interest expense (16,058) (16,372) (49,141) (49,250) Gains on sales of operating properties — — 8,329 15,160 Net income attributable to noncontrolling interests (379) (418) (604) (1,528) Net (loss) income attributable to common shareholders $ 3,938 $ (622) $ (15,346) $ 9,565 ____________________ 1 Same Property NOI excludes five properties in redevelopment, the recently completed City Center, Burnt Store Marketplace, and Fishers Station redevelopments as well as office properties (Thirty South Meridian and Eddy Street Commons). 2 Excludes leases that are signed but for which tenants have not yet commenced the payment of cash rent. Calculated as a weighted average based on the timing of cash rent commencement and expiration during the period. (1) Same Property NOI excludes five properties in redevelopment, the recently completed City Center, Burnt Store Marketplace, and Fishers Station redevelopments as well as office properties (Thirty South Meridian and Eddy Street Commons). (2) Excludes leases that are signed but for which3 tenantsSame have Property not yet commenced NOI excludes the payment net of gains cash rent.from Calculated outlot sales,as a weighted straight-line average based rent onrevenue, the timing lease of cash termination rent commencement fees, amortization and expiration duringof lea these period.intangibles, fee income (3) Same Property NOI excludes net gains from outlot andsales, significant straight-line rentprior revenue, period lease expense termination recoveries fees, amortization and adjustments, of lease intangibles, if any fee. income and significant prior period expense recoveries and adjustments, if any. (4) Includes non-cash activity across the portfolio as well as net operating income from properties not included in the same property pool. 17 4 Includes non-cash activity across the portfolio as well as net operating income from properties not included in the same property pool. investor-presentation-11-5-18B.indd 17 11/5/18 1:18 PM p. 16 Kite Realty Group Trust Supplemental Financial and Operating Statistics –9/30/18

30 S MERIDIAN STREET SUITE 1100 INDIANAPOLIS, IN 46204 888 577 5600 kiterealty.com investor-presentation-11-5-18B.indd 18 11/5/18 1:18 PM

2018 FULL YEAR FFO GUIDANCE: $1.98 - $2.01 November 2018 INVESTOR UPDATE Year over Year Impact 2019 Eddy Street Commons Development Fee ($0.03) TH Real Estate Joint Venture ($0.02) OPERATIONS 2018 Transactional Activity (excluding TH) ($0.01) AND GROWTH OPPORTUNITIES Toys Impact ($0.03) New Lease Accounting Rules ($0.05) 2019 FFO Term Loan Interest Expense ($0.025) PREVIEW Executed Anchor Leases Commencing in 2019 $0.025 Total Known Impact ($0.14) 2019 NOI Growth TBD 2019 Fee and Ancillary Income TBD 2019 Transactional Activity1 (TBD) (1) Assumes KRG will be a net seller in 2019.
