Attached files
| file | filename |
|---|---|
| 8-K - 8-K - HarborOne Bancorp, Inc. | a18-39545_28k.htm |
Investor Presentation Growth Oriented. Community Driven. Trusted and Respected. November 2018

Forward Looking Statements Certain statements herein constitute forward-looking statements within the meaning of Section 27A of the Securities Act of 1933, as amended, and Section 21E of the Exchange Act and are intended to be covered by the safe harbor provisions of the Private Securities Litigation Reform Act of 1995. Such statements may be identified by words such as “believes,” “will,” “would,” “expects,” “project,” “may,” “could,” “developments,” “strategic,” “launching,” “opportunities,” “anticipates,” “estimates,” “intends,” “plans,” “targets” and similar expressions. These statements are based upon the current beliefs and expectations of the Company’s management and are subject to significant risks and uncertainties. Actual results may differ materially from those set forth in the forward-looking statements as a result of numerous factors. Factors that could cause such differences to exist include, but are not limited to, the Company’s ability to achieve the synergies and value creation contemplated by the Coastway acquisition; adverse conditions in the capital and debt markets and the impact of such conditions on the Company’s business activities; changes in interest rates; competitive pressures from other financial institutions; the effects of general economic conditions on a national basis or in the local markets in which the Company operates, including changes that adversely affect borrowers’ ability to service and repay the Company’s loans; changes in the value of securities in the Company’s investment portfolio; changes in loan default and charge-off rates; fluctuations in real estate values; the adequacy of loan loss reserves; decreases in deposit levels necessitating increased borrowing to fund loans and investments; operational risks including, but not limited to, cybersecurity, fraud and natural disasters; changes in government regulation; changes in accounting standards and practices; the risk that goodwill and intangibles recorded in the Company’s financial statements will become impaired; demand for loans in the Company’s market area; the Company’s ability to attract and maintain deposits; risks related to the implementation of acquisitions, dispositions, and restructurings; the risk that the Company may not be successful in the implementation of its business strategy; changes in assumptions used in making such forward-looking statements and the risk factors described in the Annual Report on Form 10-K and Quarterly Reports on Form 10-Q as filed with the Securities and Exchange Commission (the “SEC”), which are available at the SEC’s website, www.sec.gov. Should one or more of these risks materialize or should underlying beliefs or assumptions prove incorrect, HarborOne Bancorp, Inc.’s actual results could differ materially from those discussed. Readers are cautioned not to place undue reliance on these forward-looking statements, which speak only as of the date of this release. The Company disclaims any obligation to publicly update or revise any forward-looking statements to reflect changes in underlying assumptions or factors, new information, future events or other changes, except as required by law. 2 2
A Company ontheMove “A ship in Harbor is safe, but that’s not why ships are built.” -John A. Shedd 3

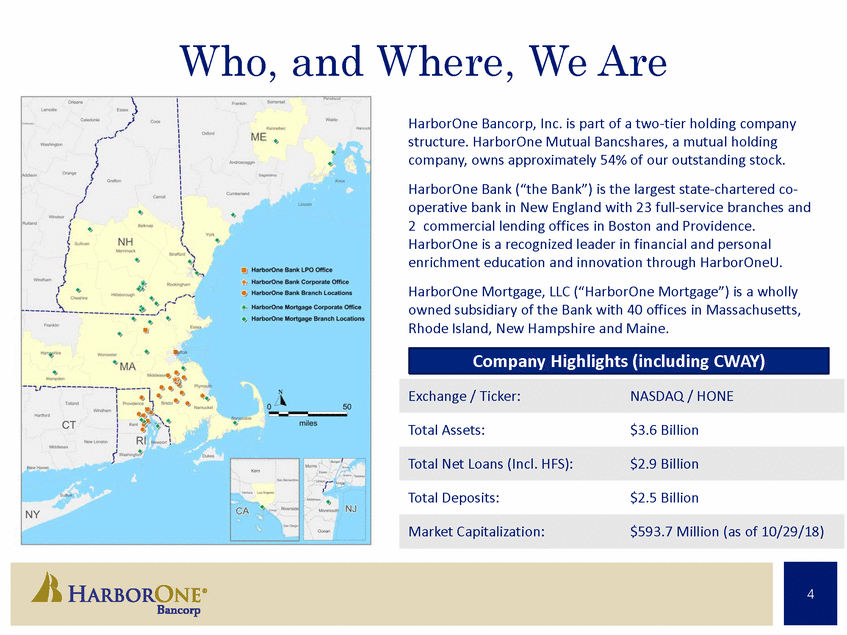
Who, and Where, We Are HarborOne Bancorp, Inc. is part of a two-tier holding company structure. HarborOne Mutual Bancshares, a mutual holding company, owns approximately 54% of our outstanding stock. HarborOne Bank (“the Bank”) is the largest state-chartered co-operative bank in New England with 23 full-service branches and 2 commercial lending offices in Boston and Providence. HarborOne is a recognized leader in financial and personal enrichment education and innovation through HarborOneU. HarborOne Mortgage, LLC (“HarborOne Mortgage”) is a wholly owned subsidiary of the Bank with 40 offices in Massachusetts, Rhode Island, New Hampshire and Maine. Exchange / Ticker: NASDAQ / HONE Total Assets: $3.6 Billion Total Net Loans (Incl. HFS): $2.9 Billion Total Deposits: $2.5 Billion Market Capitalization: $593.7 Million (as of 10/29/18) 4 Company Highlights (including CWAY)
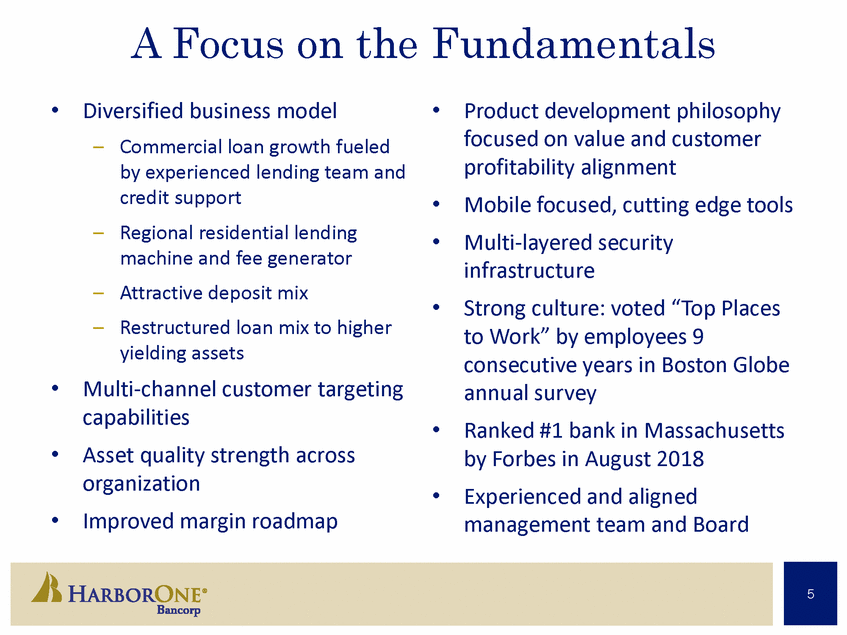
A Focusonthe Diversified business model Fundamentals • • Product development philosophy focused on value and customer profitability alignment Mobile focused, cutting edge tools Multi-layered security infrastructure Strong culture: voted “Top Places to Work” by employees 9 consecutive years in Boston Globe annual survey Ranked #1 bank in Massachusetts by Forbes in August 2018 Experienced and aligned management team and Board – Commercial loan growth fueled by experienced lending team and credit support Regional residential lending machine and fee generator Attractive deposit mix Restructured loan mix to higher yielding assets • • – – – • • Multi-channel customer targeting capabilities Asset quality strength across organization Improved margin roadmap • • • • 5
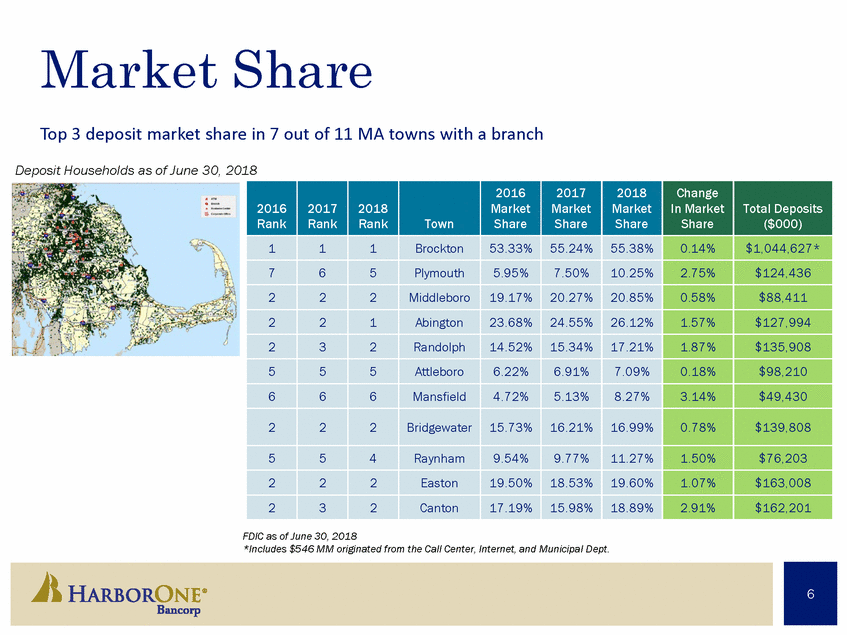
Market Share Top 3 deposit market share in 7 out of 11 MA towns with a branch Deposit Households as of June 30, 2018 FDIC as of June 30, 2018 *Includes $546 MM originated from the Call Center, Internet, and Municipal Dept. 6 20162017 201620172018MarketMarket RankRankRankTownShareShare 2018 Market Share Change In Market Share Total Deposits ($000) 111Brockton53.33%55.24% 55.38% 0.14% $1,044,627* 765Plymouth5.95%7.50% 10.25% 2.75% $124,436 222Middleboro19.17%20.27% 20.85% 0.58% $88,411 221Abington23.68%24.55% 26.12% 1.57% $127,994 232Randolph14.52%15.34% 17.21% 1.87% $135,908 555Attleboro6.22%6.91% 7.09% 0.18% $98,210 666Mansfield4.72%5.13% 8.27% 3.14% $49,430 222Bridgewater15.73%16.21% 16.99% 0.78% $139,808 554Raynham9.54%9.77% 11.27% 1.50% $76,203 222Easton19.50%18.53% 19.60% 1.07% $163,008 232Canton17.19%15.98% 18.89% 2.91% $162,201
A Tradition of Disciplined Growth 2016 Oct ‘18 1917 2013 2015 2017 Jan ‘18 Mar ‘18 Apr ‘18 2004 Brockton Credit HarborOne Bank Minority Stock Offering Acquired Cumberland Mortgage HarborOne Mortgage Name Change Union HarborOne Credit Union Acquired Merrimack Mortgage Announced Share Repurchase Program Announced Closed Coastway Acquisition Coastway Acquisition We said it, We did it… • • • • • • Capital and strategy focused on transforming the organization to drive profitability Actively managed loan mix to higher yielding portfolio Built a robust commercial lending engine Built a regional mortgage lending business and fee generator Expanded deposit funding source with de novo branches and acquisitions Maintained strong asset quality 7
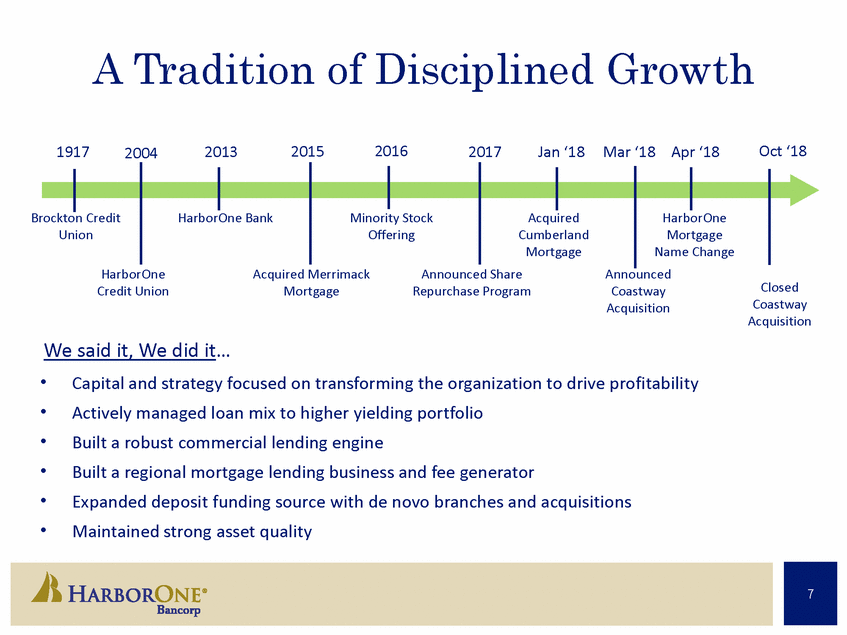
Key PerformanceMetrics $2,853 $2,685 $2,224 $1,666 $1,606 $1,955 2013 2014 2015 2016 2017 YTD Q3 2018 2013 2014 2015 2016 2017 YTD Q3 2018 3.12% 3.04% $74,348 2.85% $60,995 2.61% 2.39% 2.37% 2013 2014 2015 2016 2017 YTD Q3 2018 Dec-13 Dec-14 Dec-15 Dec-16 Dec-17 YTD Q3 2018 8 $62,100 $52,225 $43,600$45,201 Net Interest Income ($m) Net Interest Margin on FTE Basis (Q3) $2,195 $1,999 $1,743 $2,448 $2,164 $2,041 Total Loans ($mm) Total Assets ($mm)
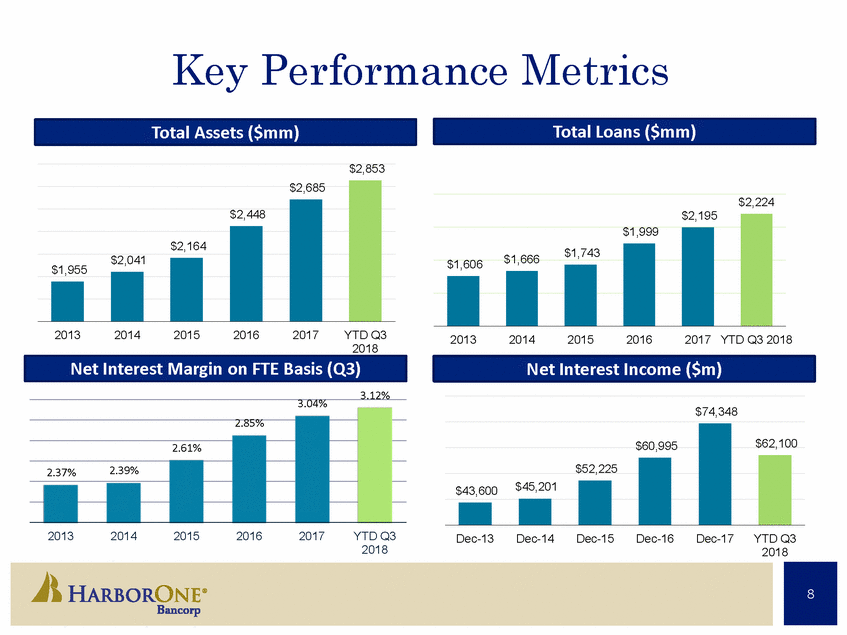
Loan Mix 23% 30% 36% Residential Commercial Consumer Residential Commercial 58% Consumer 47% Commercial Lending Keys Commercial Lending: Looking Ahead • • • • • • Highly experienced team, with CRE, C&I, and Construction expertise Disciplined Underwriting Evolving loan mix: $95 million outstanding 2013; $1.1 billion¹ Boston LPO Strong pipeline Rhode Island Expansion Small Business lending/SBA Cash Management • • (1) Includes Commercial construction, commercial real estate, commercial loans as of 9/30/18 9 Total Loans September 2018 Total Loans December 2013
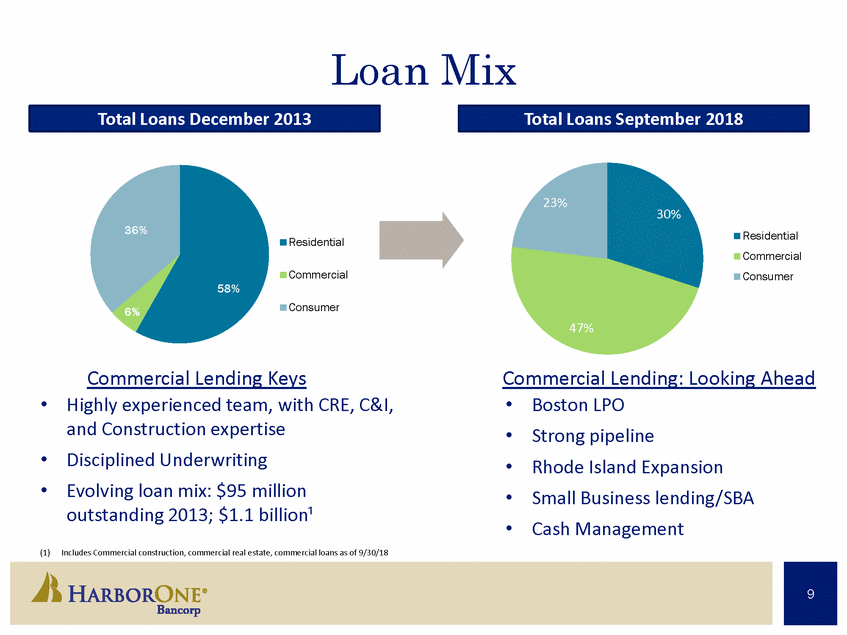
Diversification CRE CONSTRUCTION C & I Other 15% Apartment Building 12% Other 23% Construction 13% Retail 16% Commercial 11% Ut ies 1 % Manufacturing 18% Apartment Building 44% Other 16% Land development 14% Hot 15 Health Care 13% Wholesale trade 1% Office 13% Industrial 17% RE Re tal Health 13% Industrial 3% Retail Trade 4% Hotel 3% 10
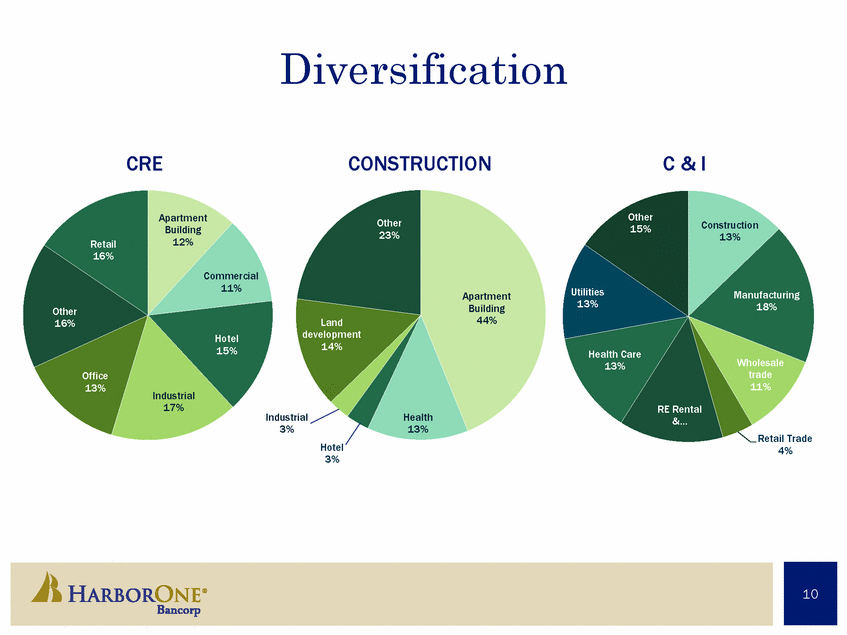
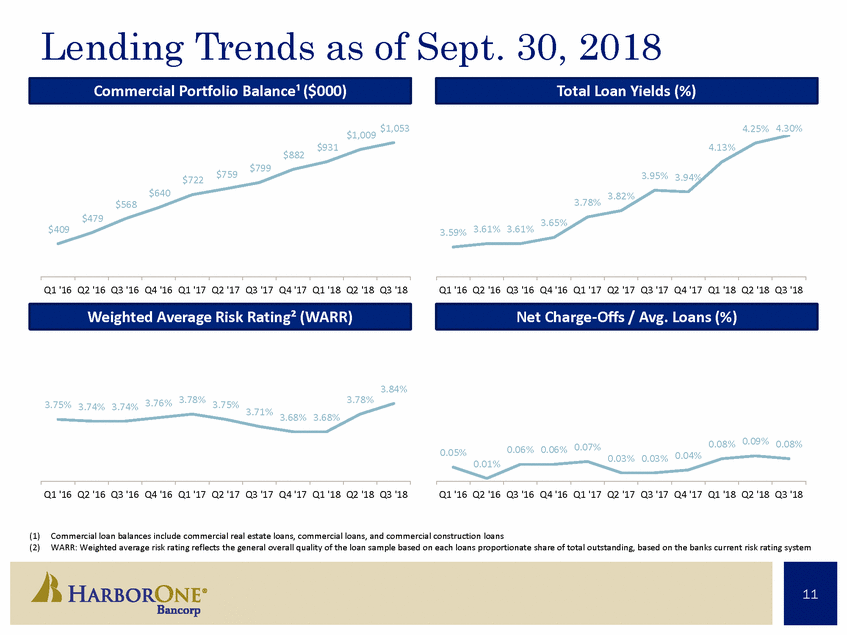
Lending Trends as of Sept. 30, 2018 $1,009 $1,053 4.25% 4.30% $931 4.13% $882 $799 $759 3.95% 3.94% $722 $640 3.82% 3.78% $568 $479 3.65% $409 3.61% 3.61% 3.59% Q1 '16 Q2 '16 Q3 '16 Q4 '16 Q1 '17 Q2 '17 Q3 '17 Q4 '17 Q1 '18 Q2 '18 Q3 '18 Q1 '16 Q2 '16 Q3 '16 Q4 '16 Q1 '17 Q2 '17 Q3 '17 Q4 '17 Q1 '18 Q2 '18 Q3 '18 3.84% 3.78% 3.78% 3.76% 3.75% 3.75% 3.74% 3.74% 3.71% 3.68% 3.68% 0.09% 0.08% 0.08% 0.07% 0.06% 0.06% 0.05% 0.04% 0.03% 0.03% 0.01% Q1 '16 Q2 '16 Q3 '16 Q4 '16 Q1 '17 Q2 '17 Q3 '17 Q4 '17 Q1 '18 Q2 '18 Q3 '18 Q1 '16 Q2 '16 Q3 '16 Q4 '16 Q1 '17 Q2 '17 Q3 '17 Q4 '17 Q1 '18 Q2 '18 Q3 '18 (1) Commercial loan balances include commercial real estate loans, commercial loans, and commercial construction loans (2) WARR: Weighted average risk rating reflects the general overall quality of the loan sample based on each loans proportionate share of total outstanding, based on the banks current risk rating system 11 Net Charge-Offs / Avg. Loans (%) Weighted Average Risk Rating² (WARR) Total Loan Yields (%) Commercial Portfolio Balance¹ ($000)
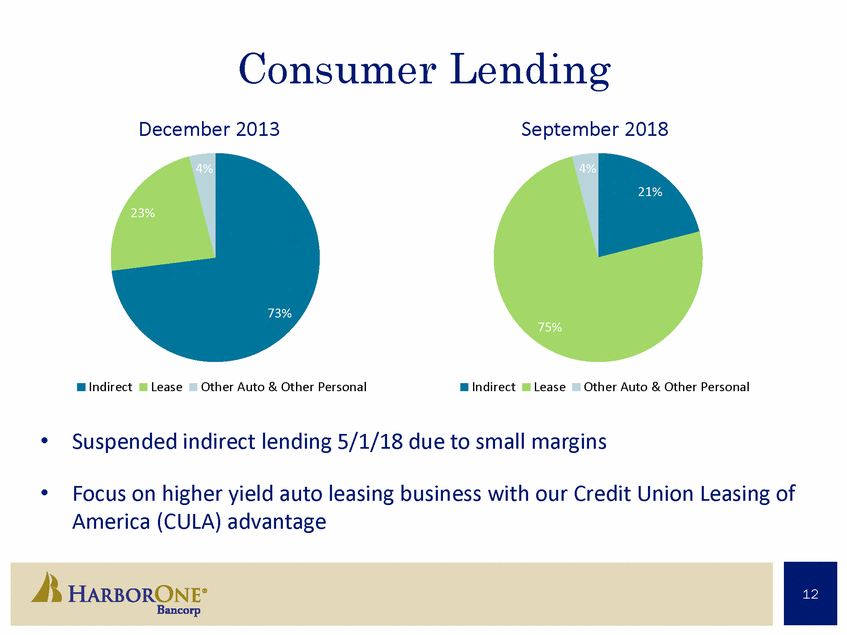
Consumer December 2013 4% Lending September 2018 4% 21% 23% 73% 75% Indirect Lease Other Auto & Other Personal Indirect Lease Other Auto & Other Personal • Suspended indirect lending 5/1/18 due to small margins • Focus on higher yield auto leasing business with our Credit Union Leasing of America (CULA) advantage 12
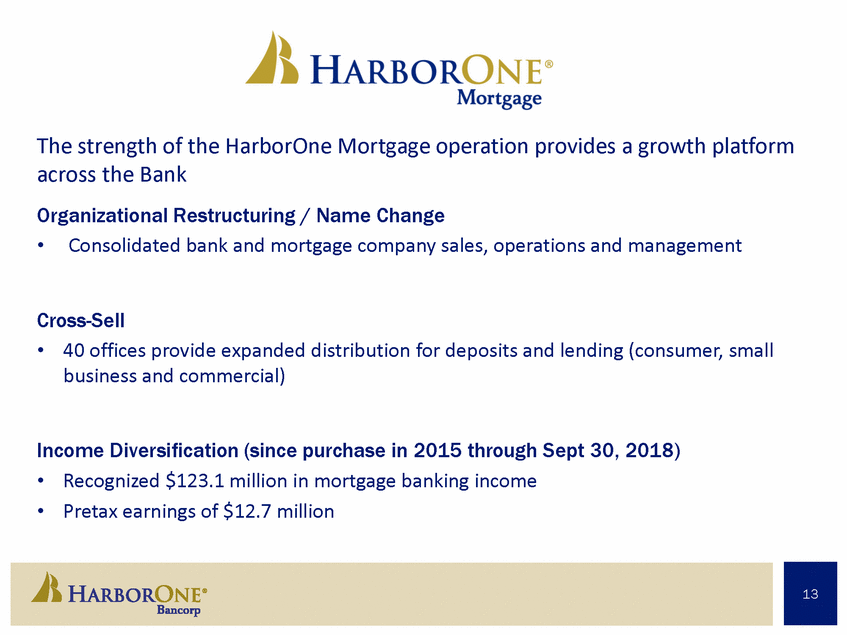
The strength of the HarborOne Mortgage operation provides a growth platform across the Bank Organizational Restructuring / Name Change • Consolidated bank and mortgage company sales, operations and management Cross-Sell • 40 offices provide expanded distribution for deposits and lending (consumer, small business and commercial) Income Diversification (since purchase in 2015 through Sept 30, 2018) • • Recognized $123.1 million in mortgage banking income Pretax earnings of $12.7 million 13
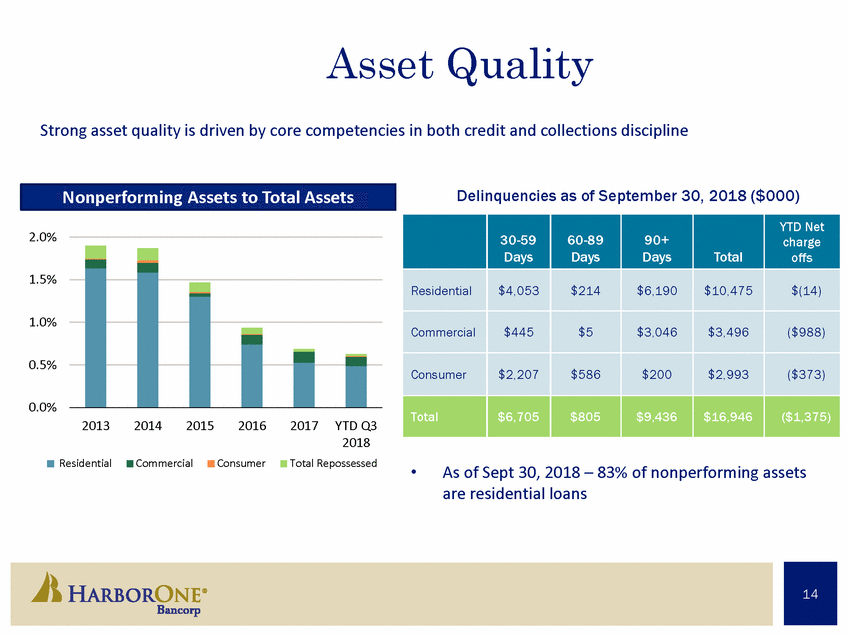
Asset Quality Strong asset quality is driven by core competencies in both credit and collections discipline Delinquencies as of September 30, 2018 ($000) 2.0% 1.5% 1.0% 0.5% 0.0% 2013 2014 2015 2016 2017 YTD Q3 2018 Residential Commercial Consumer Total Repossessed • As of Sept 30, 2018 – 83% of nonperforming assets are residential loans 14 14 YTD Net 30-5960-8990+charge DaysDaysDaysTotaloffs Residential$4,053$214$6,190$10,475$(14) Commercial $445 $5$3,046 $3,496($988) Consumer$2,207$586$200$2,993($373) Total$6,705$805$9,436$16,946($1,375) Nonperforming Assets to Total Assets
InvestmentPortfolio As of October 2018 we had $239.2 million of investments and $13.3 • 22% million of FHLB stock Investments 8.9% of total assets • 10% 40% • Co-managed with advisor EPG, Inc. 14% • Conservative portfolio: 5% • 3.99 year effective duration Treasury & Agency CMO Fixed MBS Municipal Floating MBS Other • 76% agency or government, 14% CMOs and 10% Muni 15
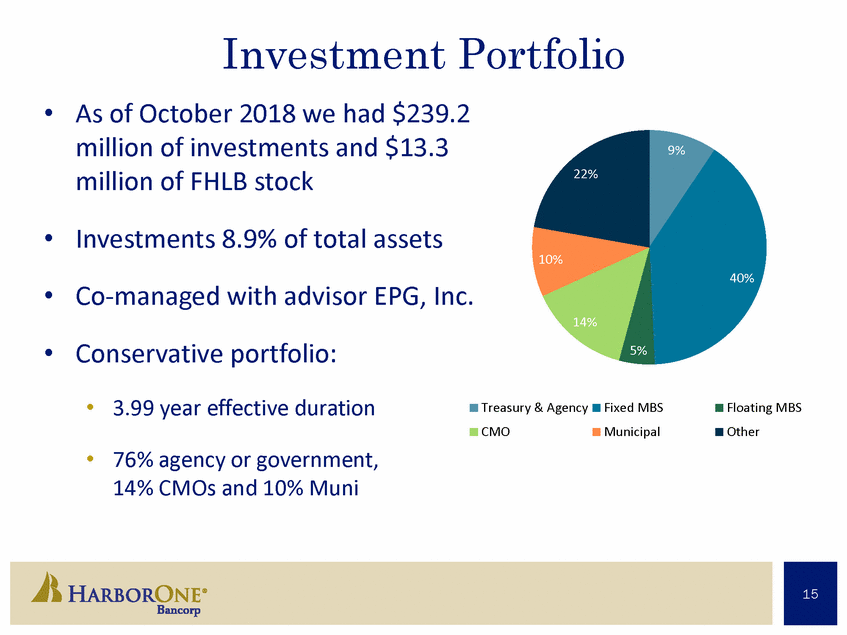
Core Deposits Robust analytics, product innovation, and marketing are the driving forces behind building the next generation core funding machine Government deposits have grown from $22 million at 12/31/13 to $229 million at 9/30/18 Dec-13 Dec-14 Dec-15 Dec-16 Dec-17 Mar-18 Jun-18 Sep-18 Checking Savings Money Market CD 16 16 $688 $751 $627 $541 $527 $463 $682 $701 $721 $518 $675 $561 $595 $612 $461 $404 $370 $379 $356 $327 $317 $296 $268 $259 $420 $429 $433 $395 $366 $321 $253 $224 Total Deposits ($mm)
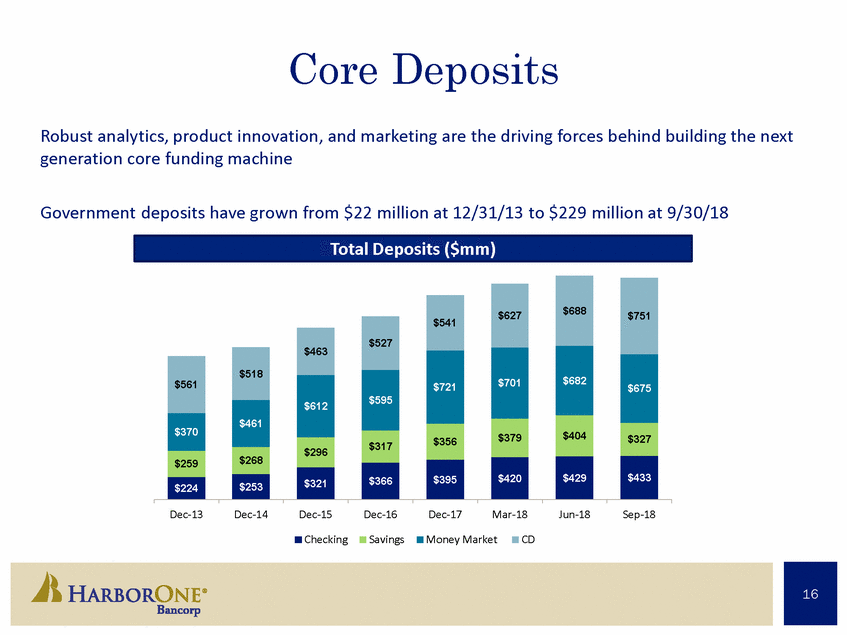
Financial Highlights Note: Financial data does not include the acquisition of Coastway Bancorp, Inc. Source: S&P Global Market Intelligence 17 (Dollars in thousands)For the Year Ended, December 31, 2016December 31, 2017 YTD Q3 September 30, 2018 Balance Sheet Highlights Total Assets $2,448,310 $2,684,920 $2,852,800 Net Loans (Incl. HFS) $2,068,190 $2,235,938 $2,359,650 Total Deposits $1,804,753 $2,013,738 $2,185,641 Total Equity $329,384 $343,484 $353,345 Income Statement Highlights Total Interest Income $74,756 $90,284 $78,785 Total Interest Expense $13,761 $15,936 $16,645 Total Non-Interest Income $67,103 $54,534 $37,546 Total Non-Interest Expense $114,698 $109,414 $83,500 Net Income $5,931 $10,379 $11,283
CoastwayBancorp Acquisition 18
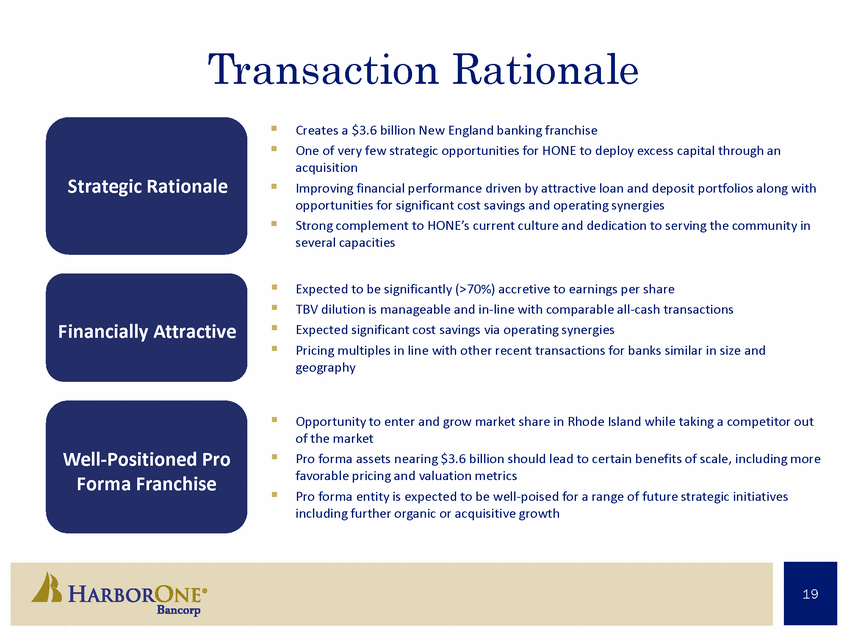
TransactionRationale Creates a $3.6 billion New England banking franchise One of very few strategic opportunities for HONE to deploy excess capital through an acquisition Improving financial performance driven by attractive loan and deposit portfolios along with opportunities for significant cost savings and operating synergies Strong complement to HONE’s current culture and dedication to serving the community in several capacities Expected to be significantly (>70%) accretive to earnings per share TBV dilution is manageable and in-line with comparable all-cash transactions Expected significant cost savings via operating synergies Pricing multiples in line with other recent transactions for banks similar in size and geography Opportunity to enter and grow market share in Rhode Island while taking a competitor out of the market Pro forma assets nearing $3.6 billion should lead to certain benefits of scale, including more favorable pricing and valuation metrics Pro forma entity is expected to be well-poised for a range of future strategic initiatives including further organic or acquisitive growth 19 Well-Positioned Pro Forma Franchise Financially Attractive Strategic Rationale
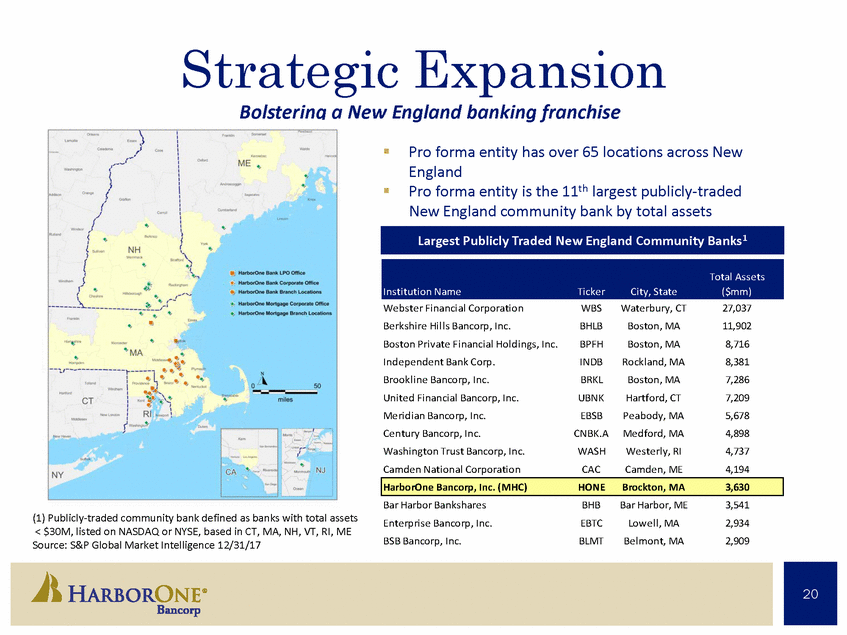
Strategic Expansion Bolstering a New England banking franchise Pro forma entity has over 65 locations across New England Pro forma entity is the 11th largest publicly-traded New England community bank by total assets Webster Financial Corporation Berkshire Hills Bancorp, Inc. Boston Private Financial Holdings, Inc. Independent Bank Corp. Brookline Bancorp, Inc. United Financial Bancorp, Inc. Meridian Bancorp, Inc. Century Bancorp, Inc. Washington Trust Bancorp, Inc. Camden National Corporation WBS BHLB BPFH INDB BRKL UBNK EBSB CNBK.A WASH CAC Waterbury, CT Boston, MA Boston, MA Rockland, MA Boston, MA Hartford, CT Peabody, MA Medford, MA Westerly, RI Camden, ME 27,037 11,902 8,716 8,381 7,286 7,209 5,678 4,898 4,737 4,194 Bar Harbor Bankshares Enterprise Bancorp, Inc. BSB Bancorp, Inc. BHB EBTC BLMT Bar Harbor, ME Lowell, MA Belmont, MA 3,541 2,934 2,909 (1) Publicly-traded community bank defined as banks with total assets < $30M, listed on NASDAQ or NYSE, based in CT, MA, NH, VT, RI, ME Source: S&P Global Market Intelligence 12/31/17 20 HarborOne Bancorp, Inc. (MHC)HONEBrockton, MA3,630 Total Assets Institution NameTickerCity, State($mm) Largest Publicly Traded New England Community Banks1
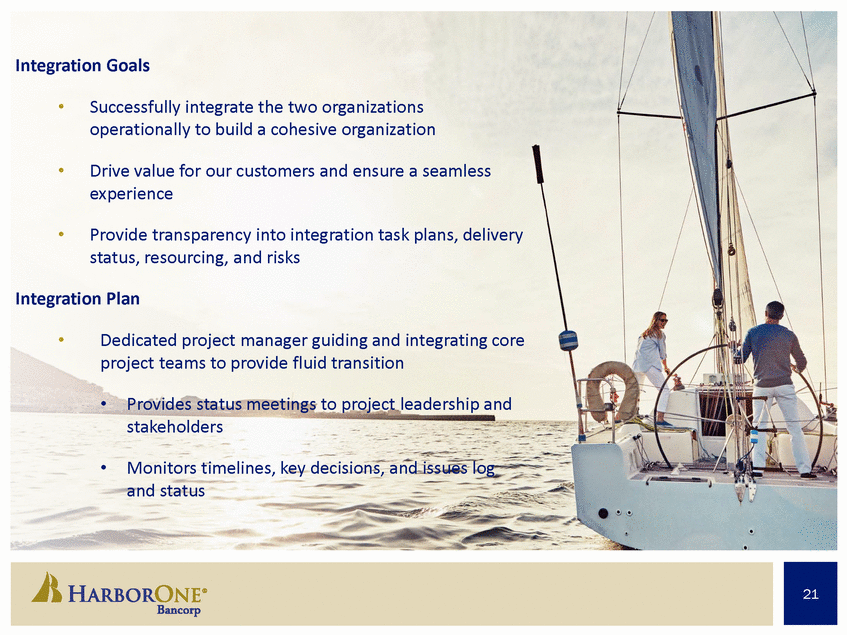
Integration Goals • Successfully integrate the two organizations operationally to build a cohesive organization • Drive value for our customers and ensure a seamless experience • Provide transparency into integration task plans, delivery status, resourcing, and risks Integration Plan • Dedicated project manager guiding and integrating core project teams to provide fluid transition • Provides status meetings to project leadership and stakeholders • Monitors timelines, key decisions, and issues log and status 21
Fueling Growth: Prioritizing Opportunities • New digital platforms for small business & home equity loans • New de novo branches / Stoughton & Boston, MA 2019 • Acquisition mindset • Residential lending organizational consolidation complete • A brand value proposition right for the times…“Find your Harbor” • Deeper customer relationships through disciplined analytics • Top talent development and retention through leadership programs 22 22
A Company Built On Service. Community. Integrity. “While we have adopted a new organizational structure, our commitment to our customers, community, employees and now our shareholders is as strong as it has ever been.” -James W. Blake 23
