Attached files
| file | filename |
|---|---|
| 8-K - 8-K - FVCBankcorp, Inc. | a18-39610_18k.htm |
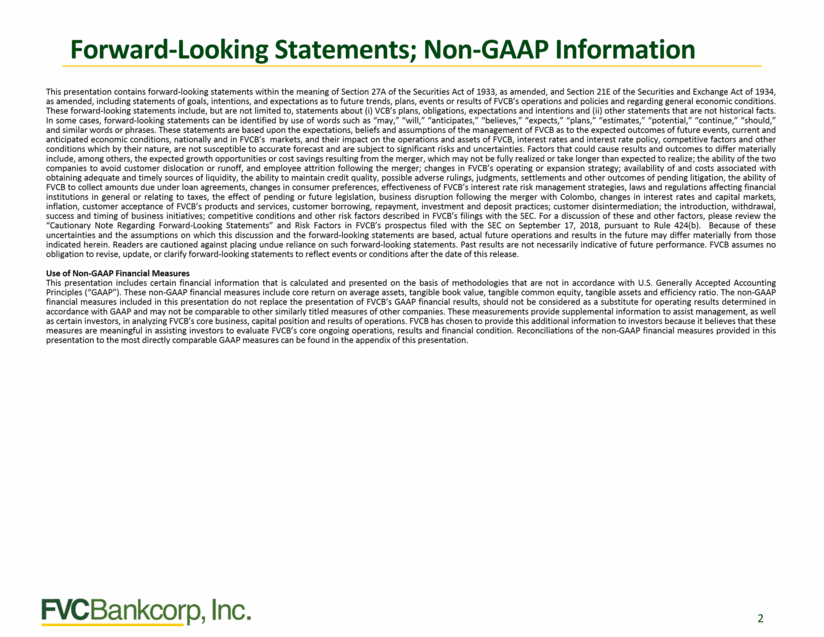
Forward-Looking Statements; Non-GAAP Information This presentation contains forward-looking statements within the meaning of Section 27A of the Securities Act of 1933, as amended, and Section 21E of the Securities and Exchange Act of 1934, as amended, including statements of goals, intentions, and expectations as to future trends, plans, events or results of FVCB’s operations and policies and regarding general economic conditions. These forward-looking statements include, but are not limited to, statements about (i) VCB’s plans, obligations, expectations and intentions and (ii) other statements that are not historical facts. In some cases, forward-looking statements can be identified by use of words such as “may,” “will,” “anticipates,” “believes,” “expects,” “plans,” “estimates,” “potential,” “continue,” “should,” and similar words or phrases. These statements are based upon the expectations, beliefs and assumptions of the management of FVCB as to the expected outcomes of future events, current and anticipated economic conditions, nationally and in FVCB’s markets, and their impact on the operations and assets of FVCB, interest rates and interest rate policy, competitive factors and other conditions which by their nature, are not susceptible to accurate forecast and are subject to significant risks and uncertainties. Factors that could cause results and outcomes to differ materially include, among others, the expected growth opportunities or cost savings resulting from the merger, which may not be fully realized or take longer than expected to realize; the ability of the two companies to avoid customer dislocation or runoff, and employee attrition following the merger; changes in FVCB’s operating or expansion strategy; availability of and costs associated with obtaining adequate and timely sources of liquidity, the ability to maintain credit quality, possible adverse rulings, judgments, settlements and other outcomes of pending litigation, the ability of FVCB to collect amounts due under loan agreements, changes in consumer preferences, effectiveness of FVCB’s interest rate risk management strategies, laws and regulations affecting financial institutions in general or relating to taxes, the effect of pending or future legislation, business disruption following the merger with Colombo, changes in interest rates and capital markets, inflation, customer acceptance of FVCB’s products and services, customer borrowing, repayment, investment and deposit practices; customer disintermediation; the introduction, withdrawal, success and timing of business initiatives; competitive conditions and other risk factors described in FVCB’s filings with the SEC. For a discussion of these and other factors, please review the “Cautionary Note Regarding Forward-Looking Statements” and Risk Factors in FVCB’s prospectus filed with the SEC on September 17, 2018, pursuant to Rule 424(b). Because of these uncertainties and the assumptions on which this discussion and the forward-looking statements are based, actual future operations and results in the future may differ materially from those indicated herein. Readers are cautioned against placing undue reliance on such forward-looking statements. Past results are not necessarily indicative of future performance. FVCB assumes no obligation to revise, update, or clarify forward-looking statements to reflect events or conditions after the date of this release. Use of Non-GAAP Financial Measures This presentation includes certain financial information that is calculated and presented on the basis of methodologies that are not in accordance with U.S. Generally Accepted Accounting Principles (“GAAP”). These non-GAAP financial measures include core return on average assets, tangible book value, tangible common equity, tangible assets and efficiency ratio. The non-GAAP financial measures included in this presentation do not replace the presentation of FVCB’s GAAP financial results, should not be considered as a substitute for operating results determined in accordance with GAAP and may not be comparable to other similarly titled measures of other companies. These measurements provide supplemental information to assist management, as well as certain investors, in analyzing FVCB’s core business, capital position and results of operations. FVCB has chosen to provide this additional information to investors because it believes that these measures are meaningful in assisting investors to evaluate FVCB’s core ongoing operations, results and financial condition. Reconciliations of the non-GAAP financial measures provided in this presentation to the most directly comparable GAAP measures can be found in the appendix of this presentation. 2
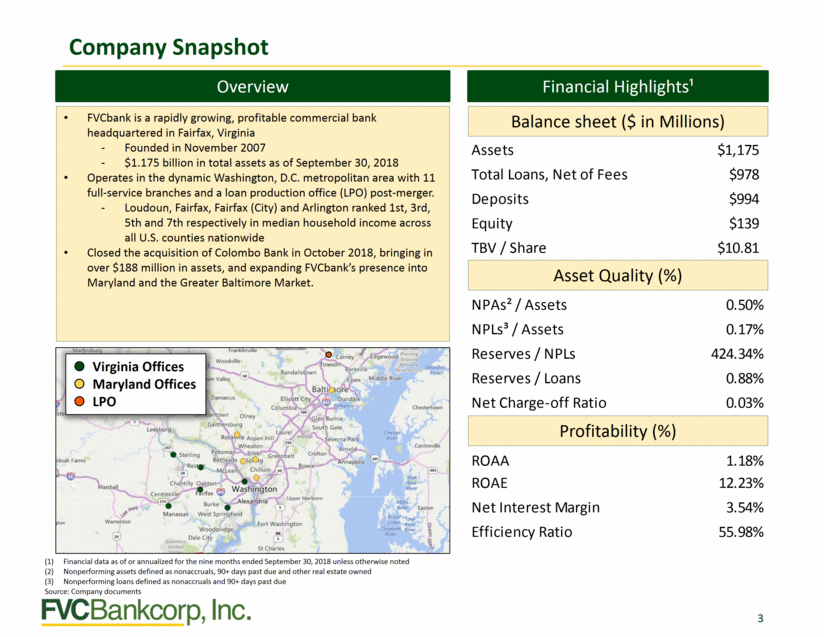
Company Snapshot headquartered in Fairfax, Virginia Assets Total Loans, Net of Fees Deposits Equity TBV / Share $1,175 $978 $994 $139 $10.81 NPAs² / Assets NPLs³ / Assets Reserves / NPLs Reserves / Loans Net Charge-off Ratio 0.50% 0.17% 424.34% 0.88% 0.03% ROAA ROAE Net Interest Margin Efficiency Ratio 1.18% 12.23% 3.54% 55.98% (1) (2) (3) Financial data as of or annualized for the nine months ended September 30, 2018 unless otherwise noted Nonperforming assets defined as nonaccruals, 90+ days past due and other real estate owned Nonperforming loans defined as nonaccruals and 90+ days past due Source: Company documents 3 Profitability (%) Virginia Offices Maryland Offices LPO Asset Quality (%) •FVCbank is a rapidly growing, profitable commercial bank -Founded in November 2007 -$1.175 billion in total assets as of September 30, 2018 •Operates in the dynamic Washington, D.C. metropolitan area with 11 full-service branches and a loan production office (LPO) post-merger. -Loudoun, Fairfax, Fairfax (City) and Arlington ranked 1st, 3rd, 5th and 7th respectively in median household income across all U.S. counties nationwide •Closed the acquisition of Colombo Bank in October 2018, bringing in over $188 million in assets, and expanding FVCbank’s presence into Maryland and the Greater Baltimore Market. Balance sheet ($ in Millions) Financial Highlights¹ Overview
Deep and Experienced Executive Management Team FVCB’s executive management team consists of eight officers with over 185 years of combined experience in the Washington, D.C. metropolitan area David Pijor was the founding Chairman of the Board of James Monroe Bancorp, which opened in June 1998 in Arlington, VA, and was instrumental in the growth and strategic direction of the bank until its sale to Mercantile Bankshares Corporation in 2006 for $143.8 million 4 Name Current Position Prior Community Bank Experience Years Experience Years at FVCB David W. Pijor Chairman & CEO, Company and Bank James Monroe Bancorp 19 11 Patricia A. Ferrick President, Company and Bank Southern Financial Bancorp, Potomac Bank of Virginia 31 11 B. Todd Dempsey EVP and Chief Operating Officer, Company and Bank United Bank 37 11 William G. Byers EVP and Chief Lending Officer, Company and Bank Middleburg Bank, Century National Bank 24 7 Michael G. Nassy EVP and Chief Credit Officer, Company and Bank City First Bank of DC, National Cooperative Bank 18 6 Jennifer L. Deacon EVP and Chief Financial Officer, Company and Bank Cardinal Financial Corp. 21 1 Sharon L. Jackson EVP and Chief Deposit Officer, Company and Bank MainStreet Bank 32 2 Gilbert F. Kennedy III EVP and Market President Colombo Bank, Essex Bank 38 <1 Source: Company documents
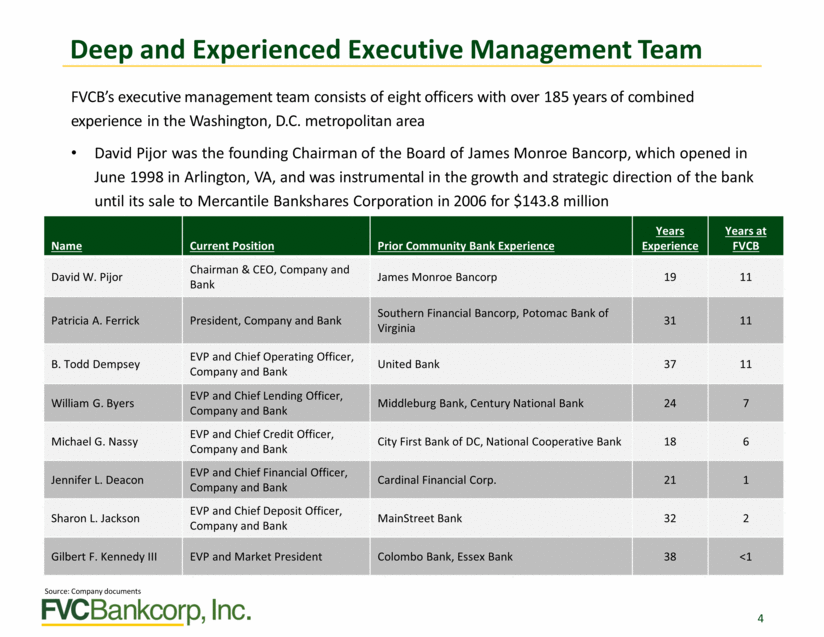
Historical Balance Sheet Growth $1,175 $978 2013 2014 2015 2016 2017 2018 Q3 2013 2014 2015 2016 2017 2018 Q3 $139 $994 $928 $73 2013 2014 2015 2016 2017 2018 Q3 2013 2014 2015 2016 2017 2018 Q3 Source: Company documents 5 $776 $627 $504 $430 $98 $80 $67 $61 Total Shareholders’ Equity ($M) Total Deposits ($M) $889 $768 $624 $510 $411 $1,053 $909 $737 $605 $507 Total Loans, Net of Fees ($M) Total Assets ($M)
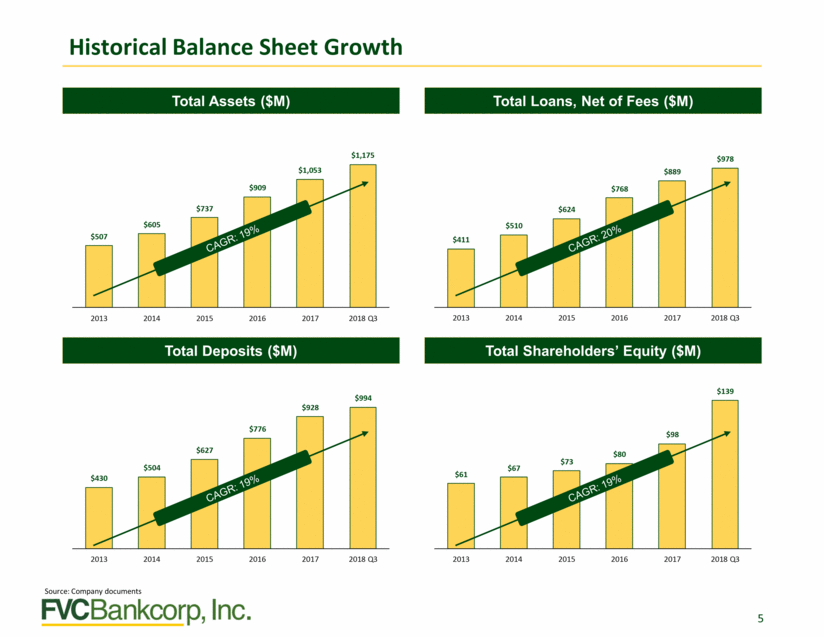
Historical Summary Income Statement $0.84¹ $0.82² $10.0 2013 2014 2015 2016 2017 2018 Q3 YTD 2013 2014 2015 2016 2017 2018 Q3 YTD $32.1 $17.0 2013 2014 2015 2016 2017 2018 Q3 YTD 2013 2014 2015 2016 2017 2018 Q3 YTD (1) Excludes one-time charges to reduce the carrying value of net deferred tax assets by $2.0 million (2) Excludes merger related costs YTD 2018 Source: S&P Global Market Intelligence; Company documents 6 $19.3 $16.4² $16.4 $14.7 $13.3 $12.2 $27.2 $28.0 $22.9 $19.2 $15.5 Noninterest Expense ($M) Net Interest Income ($M) $9.7¹ $9.5² $6.9 $7.7 $5.4 $4.1 $2.2 $0.63 $0.78 $0.67 $0.51 $0.41 $0.25 Net Income ($M) Earnings Per Share ($)
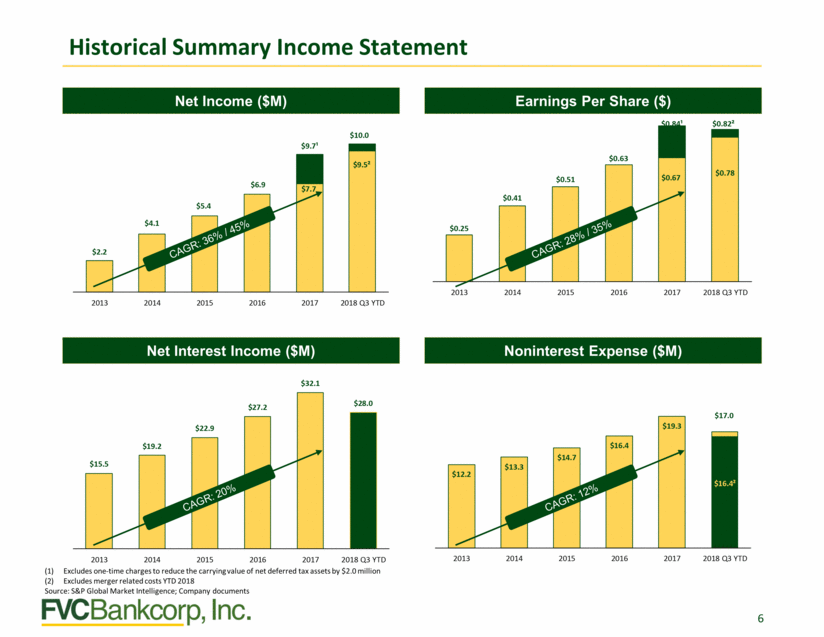
Historical Financial Performance 12.81%² 1.22%² 2013 2014 2015 2016 2017 2018 Q3 YTD 2013 2014 2015 2016 2017 2018 Q3 YTD 74.78% $10.81 61.29% 57.74% 58.02% 57.16% $6.58 ² $6.01 2013 2014 2015 2016 2017 2018 Q3 YTD 2013 2014 2015 2016 2017 2018 Q2 (1) Excludes one-time charges to reduce the carrying value of net deferred tax assets by $2.0 million (2) Excludes merger related costs YTD 2018 Source: Company documents 7 $9.03 $7.83 $7.16 65.21% 55.47% Tangible Book Value Per Share ($) Efficiency Ratio (%) 10.92%¹ 12.09% 8.91% 7.70% 8.63% 6.45% 4.21% 1.02%¹ 1.15% 0.85% 0.88% 0.76% 0.80% 0.50% ROAE (%) ROAA (%)
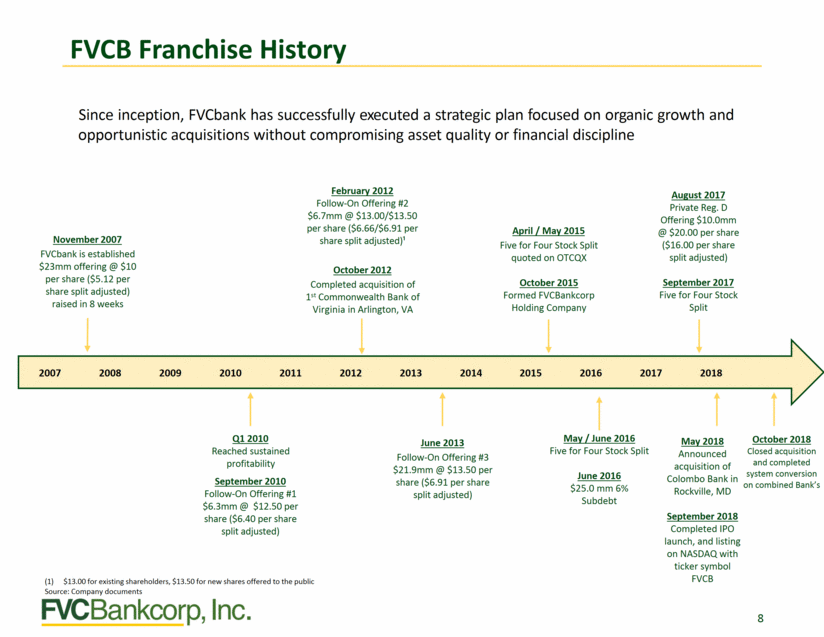
FVCB Franchise History Since inception, FVCbank has successfully executed a strategic plan focused on organic growth and opportunistic acquisitions without compromising asset quality or financial discipline 8 $13.00 for existing shareholders, $13.50 for new shares offered to the public Source: Company documents June 2013 Follow-On Offering #3 $21.9mm @ $13.50 per share ($6.91 per share split adjusted) Q1 2010 Reached sustained profitability September 2010 Follow- On Offering #1 $6.3mm @ $12.50 per share ($6.40 per share split adjusted) 2010 2011 2013 2014 2015 2016 2017 2012 2018 May / June 2016 Five for Four Stock Split June 2016 $25.0 mm 6% Subdebt February 2012 Follow-On Offering #2 $6.7mm @ $13.00/$13.50 per share ($6.66/$6.91 per share split adjusted)¹ October 2012 Completed acquisition of 1st Commonwealth Bank of Virginia in Arlington, VA April / May 2015 Five for Four Stock Split quoted on OTCQX October 2015 Formed FVCBankcorp Holding Company May 2018 Announced acquisition of Colombo Bank in Rockville, MD September 2018 Completed IPO launch, and listing on NASDAQ with ticker symbol FVCB 2009 2008 2007 November 2007 FVCbank is established $23mm offering @ $10 per share ($5.12 per share split adjusted) raised in 8 weeks August 2017 Private Reg. D Offering $10.0mm @ $20.00 per share ($16.00 per share split adjusted) September 2017 Five for Four Stock Split October 2018 Closed acquisition and completed system conversion on combined Bank’s
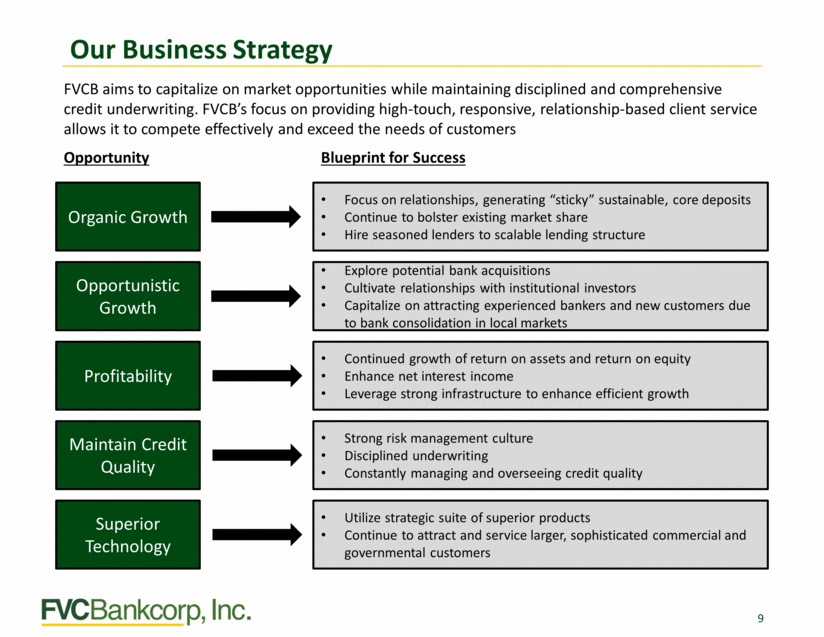
Our Business Strategy 9 FVCB aims to capitalize on market opportunities while maintaining disciplined and comprehensive credit underwriting. FVCB’s focus on providing high-touch, responsive, relationship-based client service allows it to compete effectively and exceed the needs of customers Opportunity Blueprint for Success Organic Growth Focus on relationships, generating “sticky” sustainable, core deposits Continue to bolster existing market share Hire seasoned lenders to scalable lending structure Opportunistic Growth Explore potential bank acquisitions Cultivate relationships with institutional investors Capitalize on attracting experienced bankers and new customers due to bank consolidation in local markets Maintain Credit Quality Strong risk management culture Disciplined underwriting Constantly managing and overseeing credit quality Superior Technology Utilize strategic suite of superior products Continue to attract and service larger, sophisticated commercial and governmental customers Profitability Continued growth of return on assets and return on equity Enhance net interest income Leverage strong infrastructure to enhance efficient growth
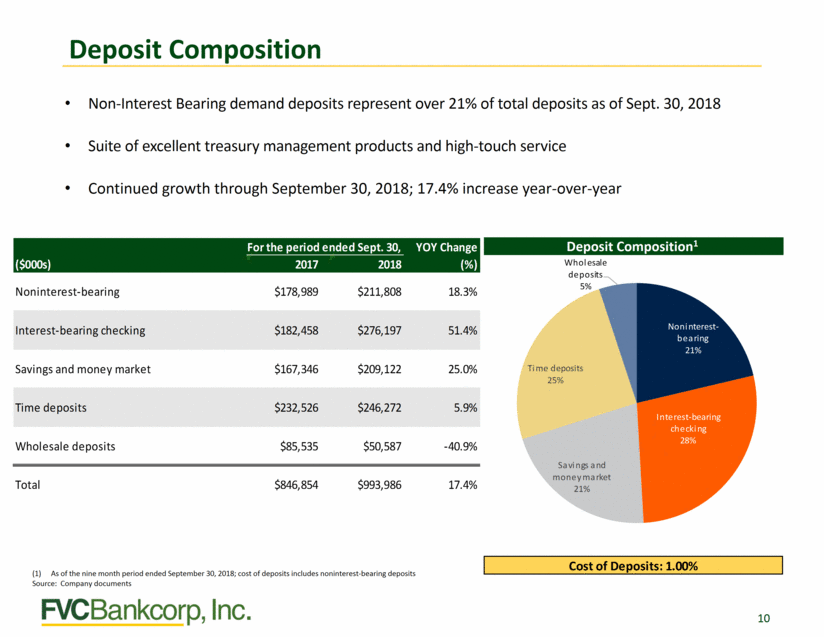
Deposit Composition • Non-Interest Bearing demand deposits represent over 21% of total deposits as of Sept. 30, 2018 • Suite of excellent treasury management products and high-touch service • Continued growth through September 30, 2018; 17.4% increase year-over-year Whol esale d e p osits 5% Noninterest-bearing $178,989 $211,808 18.3% Non i nterest-be a ring 21% Savings and money market $167,346 $209,122 25.0% Ti me deposits 25% I n te rest-bearing che cki ng 28% Wholesale deposits $85,535 $50,587 -40.9% Sa vi ngs a nd mon e y ma rket 21% Total $846,854 $993,986 17.4% (1) As of the nine month period ended September 30, 2018; cost of deposits includes noninterest-bearing deposits Source: Company documents 10 Cost of Deposits: 1.00% Time deposits$232,526$246,2725.9% Interest-bearing checking$182,458$276,19751.4% For the period ended Sept. 30, YOY Change ($000s)20172018(%) Deposit Composition1
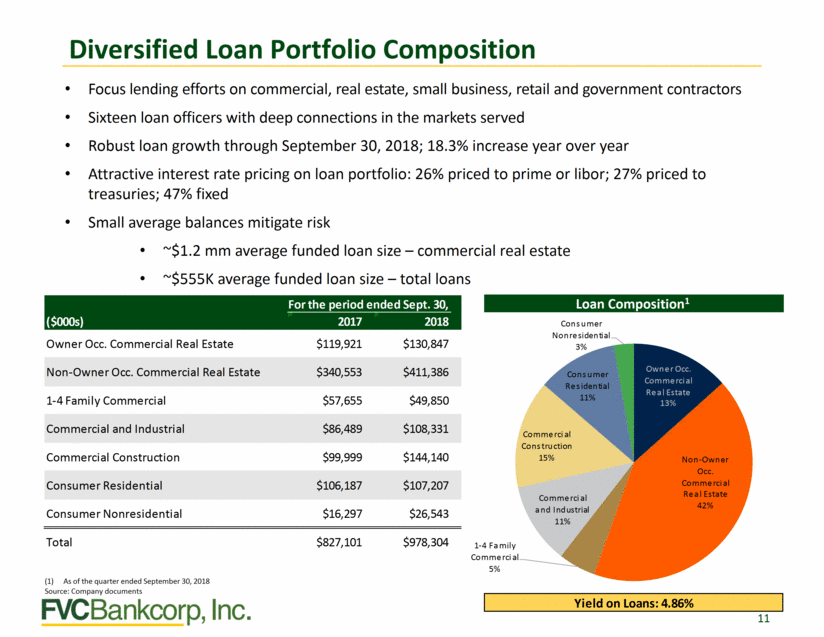
Diversified Loan Portfolio Composition • • • • Focus lending efforts on commercial, real estate, small business, retail and government contractors Sixteen loan officers with deep connections in the markets served Robust loan growth through September 30, 2018; 18.3% increase year over year Attractive interest rate pricing on loan portfolio: 26% priced to prime or libor; 27% priced to treasuries; 47% fixed Small average balances mitigate risk • • • ~$1.2 mm average funded loan size – commercial real estate ~$555K average funded loan size – total loans Cons umer Nonre siden tial 3% Owner Occ. Commercial Real Estate $119,921 $130,847 Own e r Occ. Comme rci al Re a l Estate 13% Con s u mer Re s iden tial 11% 1-4 Family Commercial $57,655 $49,850 Co mme rci al Cons truction 15% Commercial Construction $99,999 $144,140 Non -Owner Occ. Comme rci al Re a l Estate 42% Comme rci al a nd I ndustrial 11% Consumer Nonresidential $16,297 $26,543 Total $827,101 $978,304 1-4 Fa mily Comme rci al 5% (1) As of the quarter ended September 30, 2018 Source: Company documents 11 Yield on Loans: 4.86% Consumer Residential $106,187 $107,207 Commercial and Industrial $86,489 $108,331 Non-Owner Occ. Commercial Real Estate $340,553 $411,386 For the period ended Sept. 30, ($000s) 2017 2018 Loan Composition1
Asset Quality 1.17% 1.09% 0.59% 0.44% 0.03% 2013 2014 2015 2016 2017 2018 Q3 YTD 2013 2014 2015 2016 2017 2018 Q3 YTD 0.59% 0.19% (0.01%) (0.06%) 2013 2014 2015 2016 2017 2018 Q3 YTD (1) Nonperforming assets defined as nonaccruals, 90+ days past due and other real estate owned (2) Nonperforming loans defined as nonaccruals and 90+ days past due Source: Company documents 12 0.07% 0.03% 0.03% 2013 2014 2015 2016 2017 2018 Q3 YTD 0.35% 0.26% 0.17% 0.07% 0.03% Net Charge-off Ratio (%) NPLs² / Assets (%) 0.50% 0.35% 0.26% 1.00% 0.84% 0.87% 0.88% Reserves / Loans (%) NPAs¹ / Assets (%)
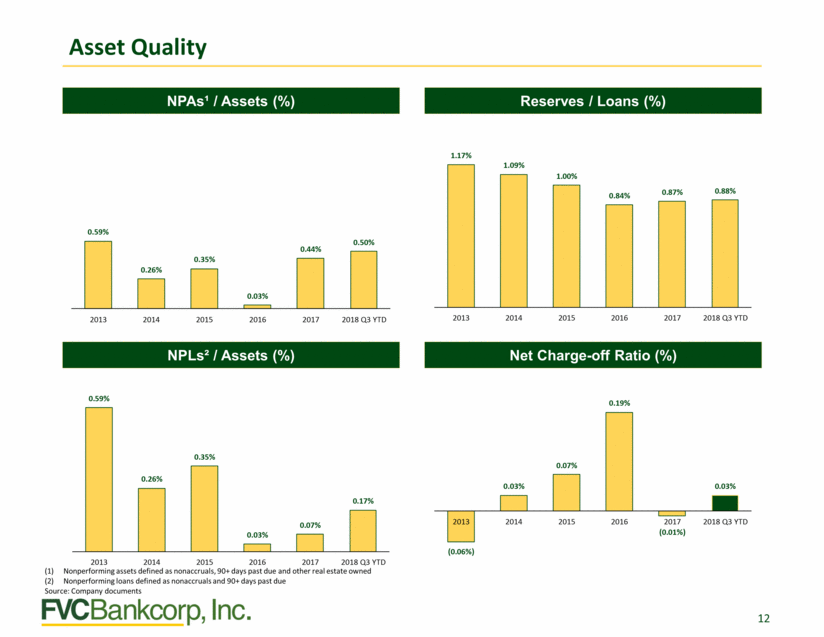
Colombo Acquisition 13 Key Points Pro Forma Loan and Deposit Composition¹ For the Nine months ended September 30, 2018 Based on 344,248,084 Colombo common shares outstanding Assumes September 30, 2018 financials Source: S&P Global Market Intelligence and company documents Further penetration of existing, and entrance into adjacent, high-growth markets, already disrupted by recent merger activity and new, out-of-state entrants Modest tangible book value dilution, earned back in three years Strong earnings accretion of 10+%, driven by substantial cost savings and continued growth Retention of key Colombo management, which will accelerate pro forma revenue and earnings and facilitate seamless integration Deal Summary Pro Forma Company at Closing³ Total assets (mm): $1,363 Gross Loans¹ (mm): $1,125 Total Deposits¹ (mm): $1,133 Total Common Equity (mm): $154 Tangible Common Equity (mm): $145 TCE / TA: 10.59% $33.3 million in deal value² Closed October 12, 2018 Cost savings estimated at 35% of Colombo’s non-interest expense Gross loan credit mark of $3.1 million (2.0% of gross loans) Total Loans¹: $1,125 mm Total Deposits¹: $1,133 mm Yield on Loans: 4.81% Cost of Deposits: 0.90%
Appendix
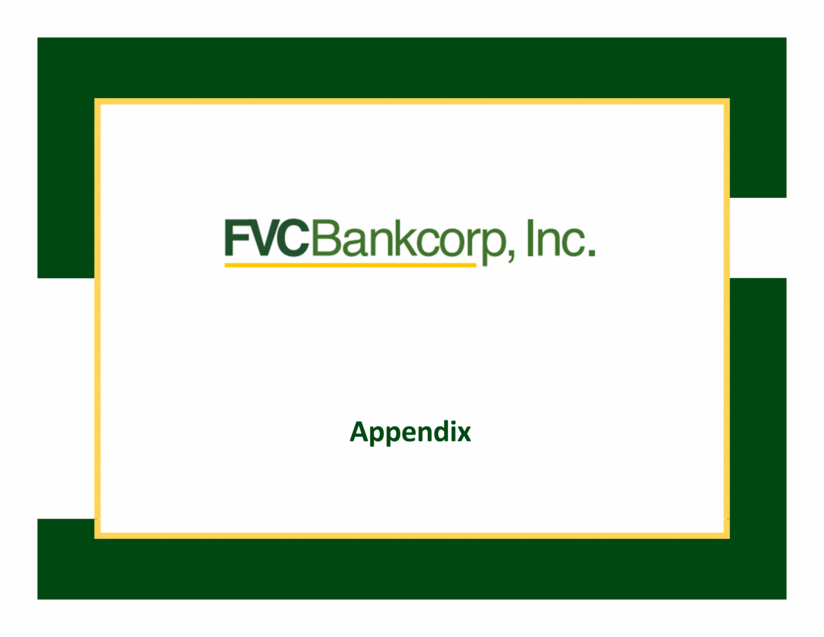
Attractive Net Interest Spread 4.51% 1.00% 4.21% 0.68% 0.65% 0.65% 2013 2014 2015 2016 2017 2018 Q3 YTD 2013 2014 2015 2016 2017 2018 Q3 YTD 3.61% 3.51% 3.47% 3.39% 3.36% 3.66% 3.63% 3.59% 3.43% 2013 2014 2015 2016 2017 2018 Q3 YTD 2013 2014 2015 2016 2017 2018 Q3 YTD Note: Cost of deposits includes noninterest-bearing deposits Source: Company documents 15 3.51% 3.48% 3.44% Net Interest Margin (%) Net Interest Spread (%) 0.74% 0.78% 4.27% 4.28% 4.26% 4.31% Cost of Total Deposits (%) Interest Earning Asset Yield (%)
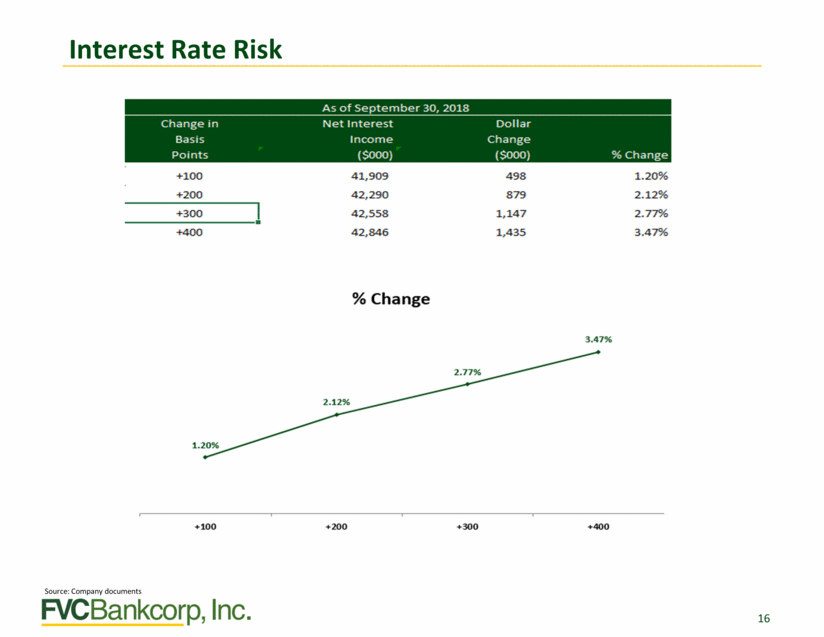
Interest Rate Risk 16 Source: Company documents
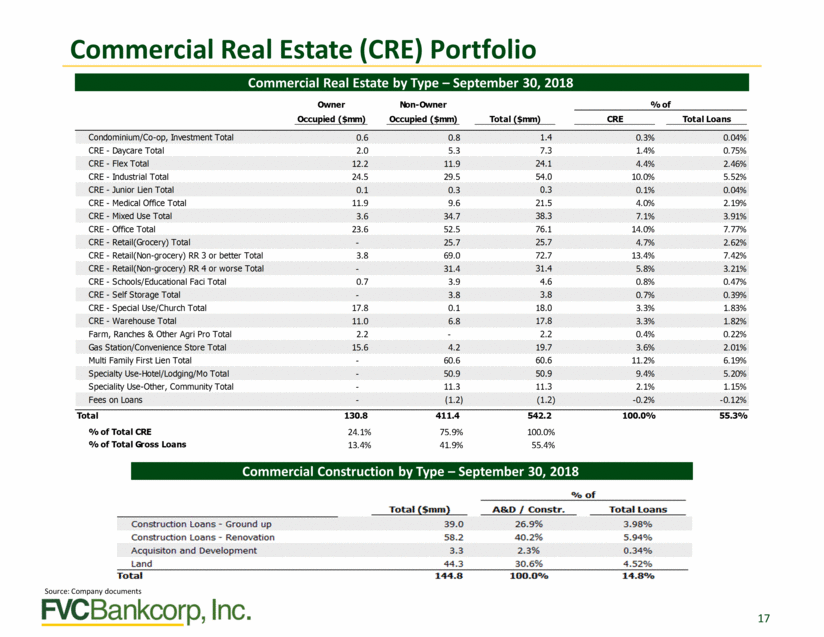
Commercial Real Estate (CRE) Portfolio Owner Occupied ($mm) Non-Owner Occupied ($mm) % of Total ($mm) CRE Total Loans 2.0 5.3 1.4% 0.75% CRE - Daycare Total 7.3 CRE - Industrial Total 24.5 29.5 54.0 10.0% 5.52% CRE - Medical Office Total 11.9 9.6 21.5 4.0% 2.19% CRE - Office Total 23.6 52.5 76.1 14.0% 7.77% 3.8 69.0 13.4% 7.42% CRE - Retail(Non-grocery) RR 3 or better Total 72.7 CRE - Schools/Educational Faci Total 0.7 3.9 4.6 0.8% 0.47% CRE - Special Use/Church Total 17.8 0.1 18.0 3.3% 1.83% Farm, Ranches & Other Agri Pro Total 2.2 - 2.2 0.4% 0.22% - 60.6 11.2% 6.19% Multi Family First Lien Total 60.6 Speciality Use-Other, Community Total - 11.3 11.3 2.1% 1.15% Total % of Total CRE % of Total Gross Loans 130.8 24.1% 13.4% 411.4 75.9% 41.9% 542.2 100.0% 55.4% 100.0% 55.3% Source: Company documents 17 Commercial Construction by Type – September 30, 2018 Fees on Loans -(1.2)(1.2) -0.2%-0.12% Specialty Use-Hotel/Lodging/Mo Total -50.950.9 9.4%5.20% Gas Station/Convenience Store Total 15.64.219.7 3.6%2.01% CRE - Warehouse Total 11.06.817.8 3.3%1.82% CRE - Self Storage Total -3.83.8 0.7%0.39% CRE - Retail(Non-grocery) RR 4 or worse Total -31.431.4 5.8%3.21% CRE - Retail(Grocery) Total -25.725.7 4.7%2.62% CRE - Mixed Use Total 3.634.738.3 7.1%3.91% CRE - Junior Lien Total 0.10.30.3 0.1%0.04% CRE - Flex Total 12.211.924.1 4.4%2.46% Condominium/Co-op, Investment Total 0.60.81.4 0.3%0.04% Commercial Real Estate by Type – September 30, 2018
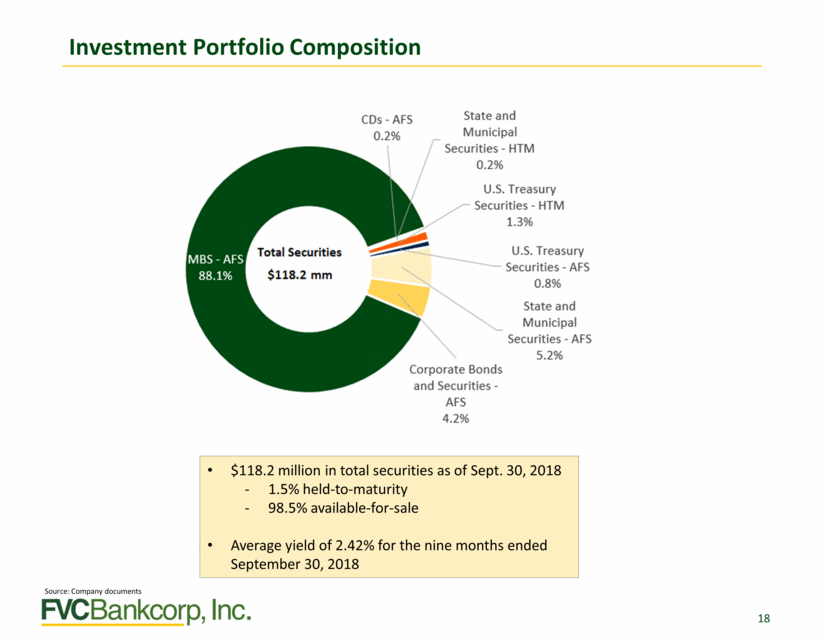
Investment Portfolio Composition 18 $118.2 million in total securities as of Sept. 30, 2018 1.5% held-to-maturity 98.5% available-for-sale Average yield of 2.42% for the nine months ended September 30, 2018 Source: Company documents
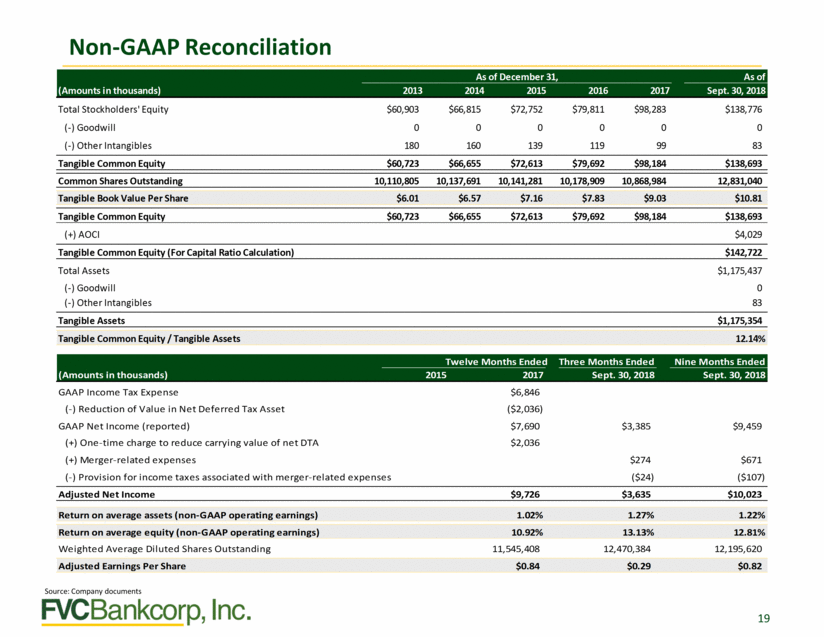
Non-GAAP Reconciliation Total Stockholders' Equity (-) Goodwill (-) Other Intangibles $60,903 0 180 $66,815 0 160 $72,752 0 139 $79,811 0 119 $98,283 0 99 $138,776 0 83 Tangible Common Equity $60,723 $66,655 $72,613 $79,692 $98,184 $138,693 Common Shares Outstanding 10,110,805 10,137,691 10,141,281 10,178,909 10,868,984 12,831,040 Tangible Common Equity $60,723 $66,655 $72,613 $79,692 $98,184 $138,693 (+) AOCI $4,029 Tangible Common Equity (For Capital Ratio Calculation) $142,722 Total Assets (-) Goodwill (-) Other Intangibles $1,175,437 0 83 Tangible Assets $1,175,354 GAAP Income Tax Expense (-) Reduction of Value in Net Deferred Tax Asset GAAP Net Income (reported) (+) One-time charge to reduce carrying value of net DTA (+) Merger-related expenses (-) Provision for income taxes associated with merger-related expenses $6,846 ($2,036) $7,690 $2,036 $3,385 $9,459 $274 ($24) $671 ($107) Adjusted Net Income $9,726 $3,635 $10,023 Weighted Average Diluted Shares Outstanding 11,545,408 12,470,384 12,195,620 Source: Company documents 19 Adjusted Earnings Per Share $0.84 $0.29 $0.82 Return on average assets (non-GAAP operating earnings) 1.02% 1.27% 1.22% Return on average equity (non-GAAP operating earnings) 10.92% 13.13% 12.81% Twelve Months EndedThree Months Ended (Amounts in thousands) 2015 2017 Sept. 30, 2018 Nine Months Ended Sept. 30, 2018 Tangible Common Equity / Tangible Assets12.14% Tangible Book Value Per Share$6.01$6.57$7.16$7.83$9.03$10.81 As of December 31, (Amounts in thousands)20132014201520162017 As of Sept. 30, 2018
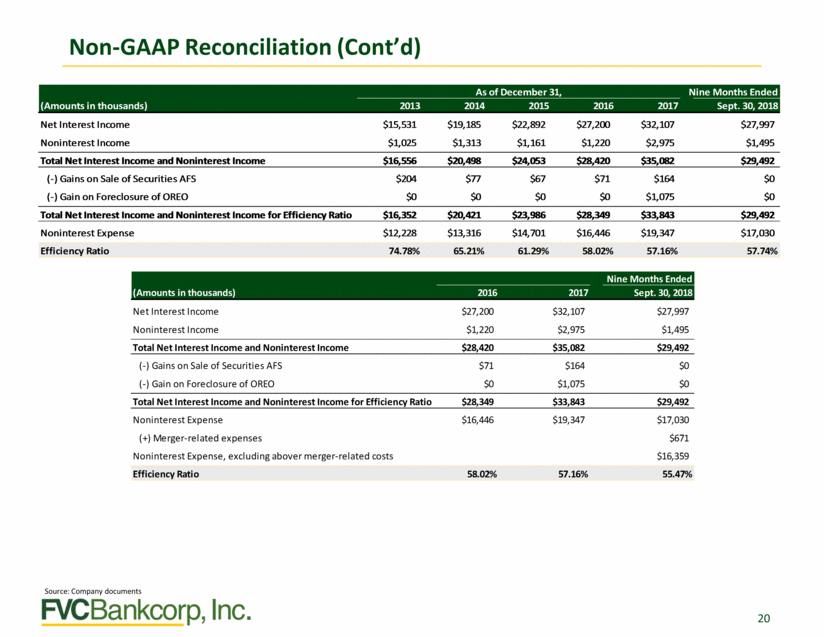
Non-GAAP Reconciliation (Cont’d) Nine Months Ended Net Interest Income Noninterest Income $15,531 $1,025 $19,185 $1,313 $22,892 $1,161 $27,200 $1,220 $32,107 $2,975 $27,997 $1,495 Total Net Interest Income and Noninterest Income $16,556 $20,498 $24,053 $28,420 $35,082 $29,492 (-) Gains on Sale of Securities AFS (-) Gain on Foreclosure of OREO $204 $0 $77 $0 $67 $0 $71 $0 $164 $1,075 $0 $0 Total Net Interest Income and Noninterest Income for Efficiency Ratio $16,352 $20,421 $23,986 $28,349 $33,843 $29,492 Noninterest Expense $12,228 $13,316 $14,701 $16,446 $19,347 $17,030 Net Interest Income Noninterest Income $27,200 $1,220 $32,107 $2,975 $27,997 $1,495 Total Net Interest Income and Noninterest Income $28,420 $35,082 $29,492 (-) Gains on Sale of Securities AFS (-) Gain on Foreclosure of OREO $71 $0 $164 $1,075 $0 $0 Total Net Interest Income and Noninterest Income for Efficiency Ratio $28,349 $33,843 $29,492 Noninterest Expense (+) Merger-related expenses Noninterest Expense, excluding abover merger-related costs $16,446 $19,347 $17,030 $671 $16,359 Source: Company documents 20 Efficiency Ratio58.02%57.16%55.47% (Amounts in thousands)20162017 Nine Months Ended Sept. 30, 2018 Efficiency Ratio 74.78% 65.21% 61.29% 58.02% 57.16% 57.74% As of December 31, (Amounts in thousands) 2013 2014 2015 2016 2017 Sept. 30, 2018
