Attached files
| file | filename |
|---|---|
| 8-K - 8-K - COLUMBIA PROPERTY TRUST, INC. | cxp8-k201811presentation.htm |

INVESTOR PRESENTATION 11. 2018 1

FORWARD-LOOKING STATEMENTS Certain statements contained in this presentation other than historical facts may be considered forward-looking statements. Such statements include, in particular, statements about our plans, strategies, and prospects, and are subject to certain risks and uncertainties, including known and unknown risks, which could cause actual results to differ materially from those projected or anticipated. Therefore, such statements are not intended to be a guarantee of our performance in future periods. Such forward-looking statements can generally be identified by our use of forward-looking terminology such as "may," "will," "expect," "intend," "anticipate," "estimate," "believe," "continue," or other similar words. These forward-looking statements include information about possible or assumed future results of the business and our financial condition, liquidity, results of operations, future plans and objectives. They also include, among other things, statement regarding subjects that are forward-looking by their nature, such as our business and financial strategy, our 2018 guidance (including projected net operating income, cash rents and contractual growth), projected yield and earnings growth compared to peers, our ability to obtain future financing, future acquisitions and dispositions of operating assets, future repurchases of common stock, and market and industry trends. Readers are cautioned not to place undue reliance on these forward-looking statements. We make no representations or warranties (express or implied) about the accuracy of any such forward-looking statements contained in this presentation, and we do not intend to publicly update or revise any forward-looking statements, whether as a result of new information, future events, or otherwise. Any such forward-looking statements are subject to risks, uncertainties, and other factors and are based on a number of assumptions involving judgments with respect to, among other things, future economic, competitive, and market conditions, all of which are difficult or impossible to predict accurately. To the extent that our assumptions differ from actual conditions, our ability to accurately anticipate results expressed in such forward- looking statements, including our ability to generate positive cash flow from operations, make distributions to stockholders, and maintain the value of our real estate properties, may be significantly hindered. See Item 1A in the Company's most recently filed Annual Report on Form 10-K for the year ended December 31, 2017, for a discussion of some of the risks and uncertainties that could cause actual results to differ materially from those presented in our forward-looking statements. The risk factors described in our Annual Report are not the only ones we face but do represent those risks and uncertainties that we believe are material to us. Additional risks and uncertainties not currently known to us or that we currently deem immaterial may also harm our business. For additional information, please reference the supplemental report furnished by the Company as Exhibit 99.1 to the Company’s Form 8-K furnished to the Securities and Exchange Commission on October 25, 2018. The names, logos and related product and service names, design marks, and slogans are the trademarks or service marks of their respective companies. When evaluating the Company’s performance and capital resources, management considers the financial impact of investments held directly and through unconsolidated joint ventures. This presentation includes financial and operational information for our wholly-owned investments and our proportional interest in unconsolidated investments. Unless otherwise noted, all data herein is as of September 30, 2018. 2

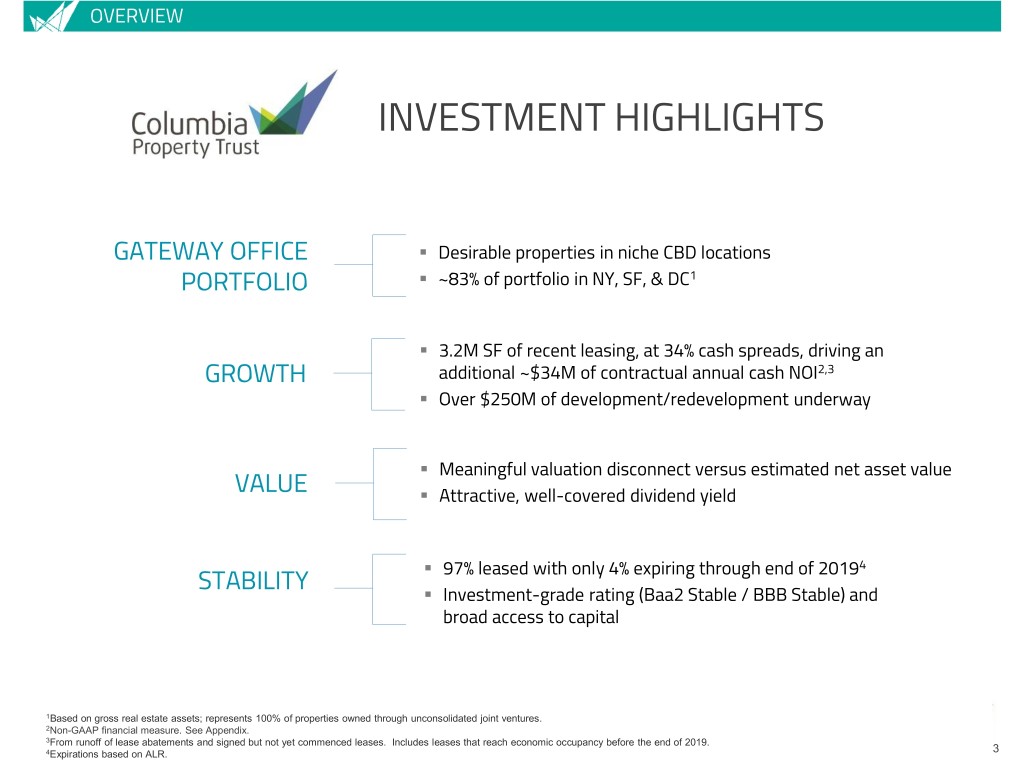
OVERVIEW INVESTMENT HIGHLIGHTS GATEWAY OFFICE . Desirable properties in niche CBD locations PORTFOLIO . ~83% of portfolio in NY, SF, & DC1 . 3.2M SF of recent leasing, at 34% cash spreads, driving an GROWTH additional ~$34M of contractual annual cash NOI2,3 . Over $250M of development/redevelopment underway . Meaningful valuation disconnect versus estimated net asset value VALUE . Attractive, well-covered dividend yield . 97% leased with only 4% expiring through end of 20194 STABILITY . Investment-grade rating (Baa2 Stable / BBB Stable) and broad access to capital 1Based on gross real estate assets; represents 100% of properties owned through unconsolidated joint ventures. 2Non-GAAP financial measure. See Appendix. 3From runoff of lease abatements and signed but not yet commenced leases. Includes leases that reach economic occupancy before the end of 2019. 4Expirations based on ALR. 3

PORTFOLIO DESIRABLE BUILDINGS IN PRIME LOCATIONS 333 Market St. 315 Park Ave. S. 229 W. 43rd St. 114 Fifth Ave. 249 W. 17th 116 Huntington Ave. San Francisco New York New York New York New York Boston 650 California St. San Francisco 218 W. 18th 95 Columbus 149 Madison 799 Broadway New York Jersey City, NJ New York New York (under redevelopment) (under development) 1800 M Street Washington, D.C. 221 Main St. San Francisco 97% LEASED Market Square Washington, D.C. University Circle Palo Alto, CA 80 M Street Washington, D.C. Pasadena Corporate One & Three Glenlake Lindbergh Center Cranberry Woods Park, Los Angeles Atlanta Atlanta Pittsburgh, PA 4

PORTFOLIO KEY MARKETS OVERVIEW NEW YORK SAN FRANCISCO WASHINGTON, D.C. 2.4M total SF 2.0M total SF 1.5M total SF 98% leased 98% leased 91% leased Data for properties owned in unconsolidated joint ventures presented at 100%. New York metrics exclude 799 Broadway. 5

PORTFOLIO A DIFFERENTIATED APPROACH • Modernized buildings with architectural distinction • Strategic locations • Efficient floorplates • Attractive amenities • High quality service to tenants • Targeted capital investments 6

GROWTH LEASING DRIVING GROWTH SF of leases signed avg. cash leasing spreads 2018 same-store 2016-2018 during that period on NOI guidance 3.2M 34% current portfolio 12-13% 650 California 97% leased after 205,000 SF of leases (62% of Expanded and extended 303,000 SF (65% of building) of building) signed at 315 Park Ave. Snapchat for 121,000 SF leases signed since 2016 South since 2016, with top floors at at 229 W. 43rd record rents for Park Ave. S. 80 M Street now 95% leased One Glenlake 100% leased after Brought University Circle to 100% (from 66%) after 194,000 SF total 156,000 SF of leases (44% of leased with expansion of Amazon leasing building) since 2016 Web Services; eliminated only substantial near-term roll with 119,000 SF renewal of DLA Piper Total leasing statistics exclude Westinghouse extension at Cranberry Woods. 7

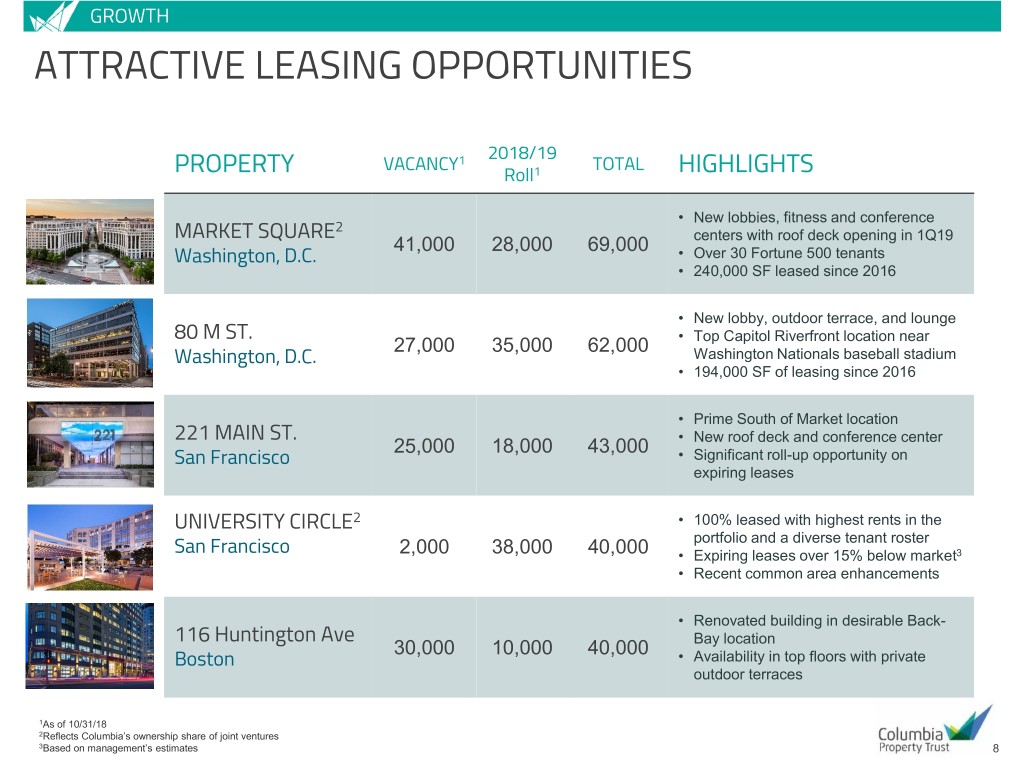
GROWTH ATTRACTIVE LEASING OPPORTUNITIES 2018/19 VACANCY1 TOTAL PROPERTY Roll1 HIGHLIGHTS • New lobbies, fitness and conference MARKET SQUARE2 41,000 28,000 69,000 centers with roof deck opening in 1Q19 Washington, D.C. • Over 30 Fortune 500 tenants • 240,000 SF leased since 2016 • New lobby, outdoor terrace, and lounge 80 M ST. 27,000 35,000 62,000 • Top Capitol Riverfront location near Washington, D.C. Washington Nationals baseball stadium • 194,000 SF of leasing since 2016 • Prime South of Market location 221 MAIN ST. 25,000 18,000 43,000 • New roof deck and conference center San Francisco • Significant roll-up opportunity on expiring leases UNIVERSITY CIRCLE2 • 100% leased with highest rents in the portfolio and a diverse tenant roster San Francisco 2,000 38,000 40,000 • Expiring leases over 15% below market3 • Recent common area enhancements • Renovated building in desirable Back- 116 Huntington Ave 30,000 10,000 40,000 Bay location Boston • Availability in top floors with private outdoor terraces 1As of 10/31/18 2Reflects Columbia’s ownership share of joint ventures 3Based on management’s estimates 8

VALUE ILLUSTRATIVE NET ASSET VALUE ANALYSIS Net Operating Cap Rate Cap Rate (in thousands, except for per-share data) Income (Cash) 5.00% 4.75% Q3 2018 Annualized – excludes Atlanta & Pittsburgh1 $182,000 $3,640,000 $3,832,000 Estimated Disposition Value - Atlanta & Pittsburgh 550,000 600,000 Construction in Progress – 149 Madison (cost basis) 94,000 94,000 Debt @ 9.30.18 (1,425,000) (1,425,000) Working Capital (Net) @ 9.30.18 15,000 15,000 Planned Capital Expenditures2 (30,000) (30,000) Implied Net Asset Value – “Q3 Cash Paying” $2,844,000 $3,086,000 Implied Net Asset Value – “Q3 Cash Paying” / Share $24.10 $26.16 A Contractual – not yet Cash Paying but beginning by 20193 $24,000 $480,000 $505,000 Planned Capital Expenditures4 (41,000) (41,000) Implied Incremental Value from Contractual Leases $439,000 $464,000 A+B=C Implied Incremental Value from Contractual Leases / Share $3.72 $3.93 B Implied Value – “Q3” + “Contractual” / Share $27.82 $30.09 C Additional $7-$9 million of NOI from 2020 Overall portfolio contractual leases and anticipated near-term leasing5 10% below market7 Note: Table includes non-GAAP financial measures. See Appendix. 1Excludes non-recurring revenues and expenses. 2Committed capital for building projects and leasing costs for leases that are currently “cash paying”. 3Includes leases that have not yet commenced or are in abatement as of 9/30/18 and begin paying cash by 12/31/19. 4Leasing costs for leases that are not yet “cash paying”. 5Based on management’s estimates. 9

VALUE EMBEDDED GROWTH FROM SIGNED LEASES1 SF CURRENTLY IN NOT YET TENANT PROPERTY MARKET (000s) ABATEMENT COMMENCED Affirm 650 California SF 89 ✔ ✔ Gemini Trust Company 315 Park Avenue South NY 51 ✔ PitchBook Data 315 Park Avenue South NY 34 ✔ ✔ Brattle Group 1800 M Street DC 21 ✔ Fullscreen 315 Park Avenue South NY 17 ✔ Bustle 315 Park Avenue South NY 17 ✔ Analysis Group 650 California SF 16 ✔ American Fuel 1800 M Street DC 13 ✔ Other abated leases 64 ✔ Other leases not yet commenced 29 ✔ Total Embedded NOI: Cash Rents beginning by 20192 $18M $6M Plus additional $10 million from leases with cash commencing in 2020 = $34M total 1SF and NOI for joint ventures are reflected at CXP’s ownership interest. Includes leases that become “cash paying” by the end of 2019. 2 Non-GAAP financial measure. See Appendix. 10

VALUE ATTRACTIVE YIELD DIVIDEND YIELD vs. GATEWAY OFFICE PEERS 4.0% 3.5% 3.0% 2.5% 2.0% 1.5% 1.0% ESRT KRC PGRE DEI BXP HPP SLG CXP VNO As of 11.2.2018 11

STABILITY LIMITED NEAR-TERM ROLLOVER LEASE EXPIRATIONS BY YEAR (% OF ALR) 6.6 years 35% average remaining lease term 30% 27% 25% 20% 17% 16% 15% 10% 9% 8% 6% 7% 6% 5% 3% 1% 0% 2018 2019 2020 2021 2022 2023 2024 2025 2026 2027+ 12

STABILITY REDEVELOPED PORTFOLIO Modest capital needs moving forward 13

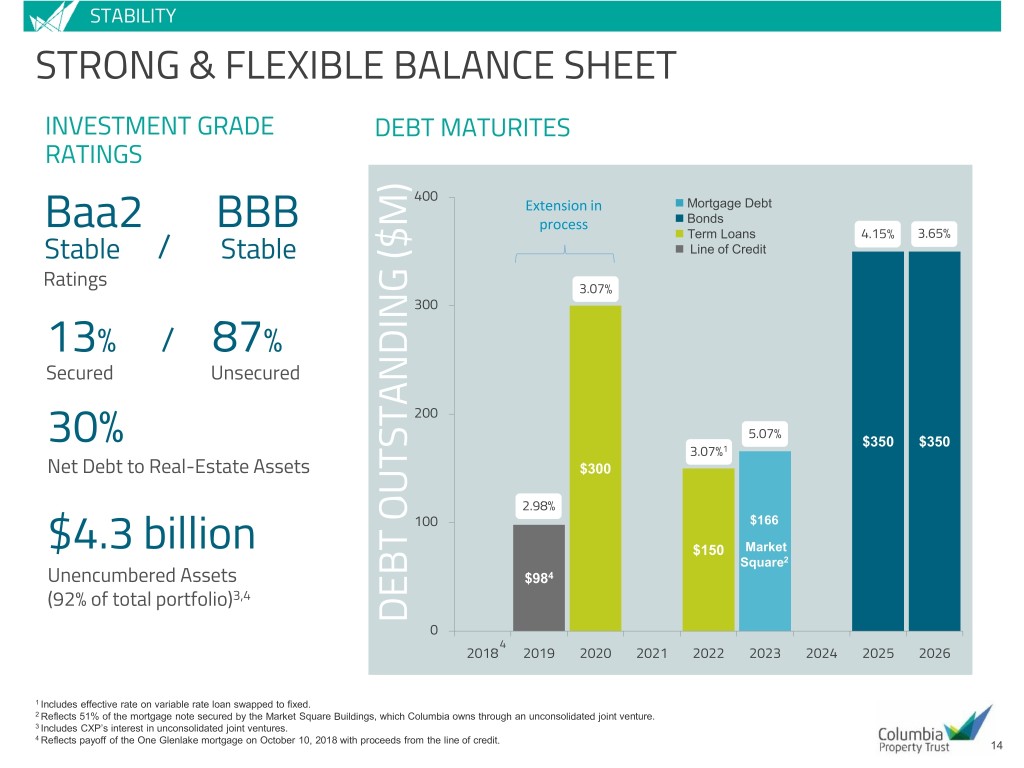
STABILITY STRONG & FLEXIBLE BALANCE SHEET INVESTMENT GRADE DEBT MATURITES RATINGS 400 Extension in Mortgage Debt process Bonds Baa2 BBB Term Loans 4.15% 3.65% Stable / Stable Line of Credit Ratings 3.07% 300 13% / 87% Secured Unsecured 200 5.07% 30% 1 $350 $350 3.07% Net Debt to Real-Estate Assets $300 2.98% 100 $166 $4.3 billion $150 Market Square2 Unencumbered Assets $984 (92% of total portfolio)3,4 DEBT OUTSTANDING ($M) OUTSTANDING DEBT 0 4 2018 2019 2020 2021 2022 2023 2024 2025 2026 1 Includes effective rate on variable rate loan swapped to fixed. 2 Reflects 51% of the mortgage note secured by the Market Square Buildings, which Columbia owns through an unconsolidated joint venture. 3 Includes CXP’s interest in unconsolidated joint ventures. 4 Reflects payoff of the One Glenlake mortgage on October 10, 2018 with proceeds from the line of credit. 14

APPENDIX FOR MORE INFORMATION Columbia Property Trust INVESTOR RELATIONS 404.465.2227 ir@columbia.reit www.columbia.reit 063-CORPPRES1808 15

APPENDIX DRAMATIC CASH LEASING SPREADS1 LEASE ROLLOVER TO ACHIEVE HIGHER RENTS 50% 45% 45% 40% 35% 32% 30% 25% 20% 19% 16% 15% 10% 5% 0% 2015 2016 2017 YTD 9/30 1Cash leasing spreads on same-store properties excluding Westinghouse extension at Cranberry Woods. 16

APPENDIX: Development Projects 799 BROADWAY Union Square and Greenwich Village NEW YORK Ground-up development of a 12-story office building • New building will contain 182,000 SF of boutique office space • Floor plates from 3,600 to 22,000 SF • 15’ ceilings, with floor-to-ceiling glass • Multiple private terraces and high-end amenities • Partnering with Normandy Real Estate; expected delivery in 2020 17

APPENDIX: Development Projects 149 MADISON Midtown South / NoMad NEW YORK Full-scale redevelopment project underway with entire office space leased to WeWork; expected occupancy in late 2019 • 122,000 RSF of modernized office and retail space • Updating/upgrading infrastructure, interior and exterior finishes, and common areas • Renovation will capitalize on 14’+ slab-to-slab ceiling heights, oversized windows, and boutique-sized floorplates • Strong interest in remaining 6,600 SF of prime corner retail space on ground floor Expected yield on cost of ~6% will generate ~$10-25M of value creation at a 5.0-5.5% cap rate range 18

APPENDIX JOINT VENTURE with Allianz Real Estate HIGHLIGHTS . Ability to increase scale in top markets on a leverage- neutral basis . Attractive cost of capital . Current gross asset value of $1.7B . Potential to acquire additional assets in select gateway markets . Allianz increased to 45% interest in University Circle and 333 Market Street in February 2018 Joint Venture Ownership Interest Property CXP Allianz 49.5%* 49.5%* 114 Fifth Avenue, New York 55% 45% University Circle, San Francisco 55% 45% 333 Market Street, San Francisco 55% 45% 1800 M Street, Washington, D.C. *L&L Holding Co. LLC holds a 1% ownership interest in 114 Fifth Avenue. 19

APPENDIX NEW SAN WASHINGTON, EXECUTIVE AND CORPORATE OPERATIONS YORK FRANCISCO D.C. NELSON MILLS JIM FLEMING WENDY GILL DOUG MCDONALD KELLY LIM MICHAEL SCHMIDT MARK WITSCHORIK President and CEO Executive VP and CFO SVP, Corporate VP, Finance VP, Asset Management VP, Asset Management VP, Asset Management Operations and Chief Accounting Officer NATIONAL REAL ESTATE MANAGEMENT KEVIN HOOVER AMY TABB LINDA BOLAN DAVID DOWDNEY DAVID CHEIKIN SVP, Portfolio SVP, Business SVP, Property SVP, Head of Leasing SVP, Strategic Real Estate Management and Development Management and Initiatives Transactions Sustainability 20

APPENDIX: Case Studies 650 CALIFORNIA STREET SAN FRANCISCO 469,000 sf By capitalizing on a central location and unique attributes, we achieved 97% leased, with 331,000 sf of leases signed at triple-digit rent roll-ups overall. • Acquired in 2014 at 88% leased, with over one-third of leases expiring within two years • Upgraded the lobby and amenities and embarked on selective spec suite program • Curated high-quality, small to midsized tenants signed at significantly higher market rates • Two-thirds of building leased or renewed, resulting in 97% leased, with average remaining lease term of 6.2 years 21

APPENDIX: Case Studies 315 PARK AVENUE SOUTH NEW YORK 331,000 sf By creating a premier Midtown South office destination through a strategic renovation plan, we achieved significantly higher rents on over 85% of the building. • Acquired in 2015 with 17 of 20 floors vacant or rolling within two years, at below market rents • Initiated a program of renovations and amenities to reposition property as “best on Park Avenue South” • Achieved 284,000 SF of leasing to date, with 16 full floors now leased and prospects for the remaining floor • Leased the premium top floors at record rents for Park Ave. S. corridor 22

APPENDIX: Case Studies 221 MAIN STREET SAN FRANCISCO 384,000 sf Through targeted improvements and creative rent roll management, we achieved 90%+ leased in one year, raising average rents PSF by more than 65%. • Acquired in 2014 at 83% leased, with rents well below market and over 30% roll within 36 months • Invested $2M+ in strategic capital improvements aimed to appeal to fin tech tenants • Created a contiguous “vertical campus” through creative relocation and selective renewals • Currently 94% leased, at rents PSF among the best in the market 23

APPENDIX: Case Studies UNIVERSITY CIRCLE PALO ALTO | SAN FRANCISCO 451,000 sf Through strategic tenant selection and improvements, we’ve maintained full occupancy, with rates among the highest in our portfolio. • Rebranded formerly law-firm-centric property to attract more diverse tenant base and expanded amenities • Added and expanded Amazon Web Services and other tech tenants • Reached 100% occupancy while raising in-place gross rates over 40% • Eliminated only substantial near-term roll with 119k SF renewal of DLA Piper at over 60% cash spread 24

APPENDIX: Case Studies ONE & THREE GLENLAKE 80 M STREET ATLANTA WASHINGTON, D.C. 707,000 sf 286,000 sf Through successful repositioning, We’ve made selective, high-impact we’ve achieved 370,000+ SF of renovations to achieve 94% leased leasing and a fully leased campus. after signing 192,000 SF. • 108,000 SF Oracle downsize created 36% • Rebranded property to attract more vacancy at One; Newell Brands leaving creative tenant base and compete with Three at expiration in March 2020 new construction in submarket • Upgraded common areas and amenities to best-in-submarket • Leased One to 100% and completely backfilled Three in advance of Newell roll. 25

APPENDIX: Case Studies 222 EAST 41ST STREET NEW YORK 390,000 sf By pursuing a long-term, full building lease with a high credit tenant, we created significant value. • In 2015, launched a multi-pronged marketing effort to replace departing primary tenant Jones Day (353,000 SF), exploring both multi-tenant and single tenant options, • In April 2016, secured a market-leading 30-year, 390,000 SF lease with NYU Langone Medical Center, with almost no downtime between leases • In May 2018, sold to Commerz Real for a gross sales price of $332.5 million, a 4.1% cap rate. 26

APPENDIX RECONCILIATIONS: NON-GAAP TO COMPARABLE GAAP MEASURES Three Months (in thousands) Ended 9/30/18 Annualized Net Cash Provided by Operating Activities $ 41,854 $ 167,416 Straight line rental income 5,055 20,220 Depreciation of real estate assets (19,878) (79,512) Amortization of lease-related costs (6,900) (27,600) Gain from unconsolidated joint venture 2,393 9,572 Income distributed from JV (6,449) (25,796) Other non-cash expenses (2,349) (9,396) Net changes in operating assets & liabilities (7,297) (29,188) Net Income (loss) $ 6,429 $ 25,716 Interest expense (net) 13,049 52,196 Interest income from development authority bonds (1,800) (7,200) Income tax benefit 3 12 Depreciation of real estate assets 19,878 79,512 Amortization of lease-related costs 7,920 31,680 Adjustments from unconsolidated joint venture 14,189 56,756 EBITDA $ 59,668 $ 238,672 EBITDAre $ 59,668 $ 238,672 Asset & property management fee income (1,825) (7,300) General and administrative – corporate 8,303 33,212 General and administrative – unconsolidated joint ventures 746 2,984 Straight line rental income (net) (5,056) (20,224) Above/below lease market amortization (net) (1,020) (4,080) Adjustments from unconsolidated joint venture (1,828) (7,312) Net Operating Income (based on cash rents) $ 58,988 $ 235,952 27

APPENDIX RECONCILIATIONS: NON-GAAP TO COMPARABLE GAAP MEASURES (continued from prior page) (in thousands) Three Months Ended 9/30/18 Annualized Net Operating Income (based on cash rents) $ 58,988 $ 235,952 NOI from Atlanta & Pittsburgh (12,490) (49,960) Adjustment for Non-Recurring Revenues / Expenses (998) (3,992) Net Operating Income (based on cash rents) – Adjusted $ 45,500 $ 182,000 28
