Attached files
| file | filename |
|---|---|
| EX-99.1 - EXHIBIT 99.1 - WESTLAKE CHEMICAL CORP | ex991_180930earningsrelease.htm |
| 8-K - 8-K - WESTLAKE CHEMICAL CORP | a180930earningsrelease8k.htm |

EXHIBIT 99.2 Westlake Chemical Corporation Third Quarter 2018 Earnings Presentation

EXHIBIT 99.2 Westlake Chemical Corporation Third Quarter 2018 Financial Highlights 3Q18 vs. 3Q18 vs. YTD18 vs. ($ in millions) 3Q18 3Q17 3Q17 2Q18 2Q18 YTD 18 YTD 17 YTD17 Sales $2,255 $2,109 7% $2,235 1% $6,640 $6,031 10% Operating Income $396 $364 9% $404 (2%) $1,201 $862 39% Vinyls EBITDA $391 $333 17% $395 (1%) $1,182 $764 55% Olefins EBITDA $198 $201 (1%) $192 3% $589 $602 (2%) Corporate EBITDA ($9) ($12) 25% ($19) 53% ($44) ($42) (5%) EBITDA¹ $580 $522 11% $568 2% $1,727 $1,324 30% Third Quarter 2018 vs. Third Quarter 2017 Year to Date 2018 vs. Year to Date 2017 . Net income of $308 million, or $2.35 per diluted share . 74% increase to Net income of $873 million + Higher sales volumes for caustic soda, polyethylene and PVC + Higher sales volumes for our major products resin + Higher sales volumes for caustic soda and PVC resin + Higher sales prices for caustic soda + Lower purchased ethylene costs + Lower purchased ethylene costs + Lower effective tax rate resulting from tax reform + Lower effective tax rate resulting from tax reform + Lower interest expense due to the repayment of debt + Lower interest expense due to the repayment of debt + One-time $14 million, $0.08 per diluted share, gain associated + One-time $14 million, $0.08 per diluted share, gain associated with the annuitizing of pension liabilities with the annuitizing of pension liabilities . 30% increase to EBITDA of $1.7 billion . Quarterly record for net sales, cash flow from operations and EBITDA (1) Reconciliations of EBITDA, Vinyls EBITDA, Olefins EBITDA and Corporate EBITDA to the applicable GAAP measures can be found on pages 8 and 9 2

EXHIBIT 99.2 Westlake Chemical Corporation Third Quarter 2018 Business Highlights . Quarterly net income of $308 million, or $2.35 per diluted share . Record quarterly sales of $2.3 billion; record quarterly cash flows from operations of $606 million; and record quarterly EBITDA of $580 million . Announced exclusive, binding offer to acquire NAKAN, a global PVC compounding business, for $265 million in cash; expected to close in the first quarter of 2019 . Westlake expanded stock repurchase program . Extended $1 billion revolving credit agreement; ratings agencies reaffirmed solid investment grade rating . Westlake Chemical Partners LP (the “Partnership”) announced the commencement of an At-The-Market program representing the ability to sell limited partner interests in the Partnership with an aggregate offering amount of up to $50 million 3

EXHIBIT 99.2 Vinyls Segment Performance 3Q18 vs. 3Q18 vs. YTD18 vs. ($ in millions) 3Q18 3Q17 3Q17 2Q18 2Q18 YTD 18 YTD 17 YTD17 Sales $1,714 $1,607 7% $1,753 (2%) $5,114 $4,497 14% Operating Income $251 $214 17% $271 (7%) $788 $425 85% EBITDA $391 $333 17% $395 (1%) $1,182 $764 55% Third Quarter 2018 vs. Third Quarter 2017 Q3 2018 vs. + Higher sales prices and volumes for caustic soda Q3 2017 Average Sales Price Volume + Higher sales volumes for PVC resin +5.9% +0.7% + Lower ethylene costs Third Quarter 2018 vs. Second Quarter 2018 Q3 2018 vs. + Higher caustic soda sales volumes Q2 2018 − Higher purchased ethylene costs Average Sales Price Volume -1.6% -0.7% 4

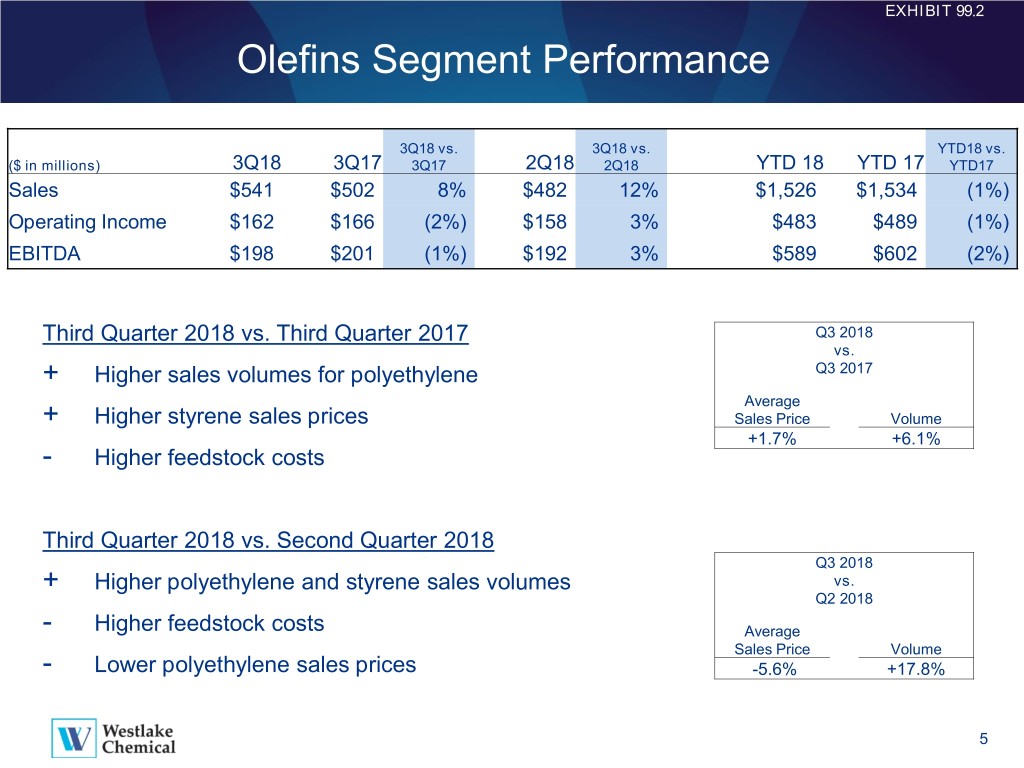
EXHIBIT 99.2 Olefins Segment Performance 3Q18 vs. 3Q18 vs. YTD18 vs. ($ in millions) 3Q18 3Q17 3Q17 2Q18 2Q18 YTD 18 YTD 17 YTD17 Sales $541 $502 8% $482 12% $1,526 $1,534 (1%) Operating Income $162 $166 (2%) $158 3% $483 $489 (1%) EBITDA $198 $201 (1%) $192 3% $589 $602 (2%) Third Quarter 2018 vs. Third Quarter 2017 Q3 2018 vs. + Higher sales volumes for polyethylene Q3 2017 Average + Higher styrene sales prices Sales Price Volume +1.7% +6.1% - Higher feedstock costs Third Quarter 2018 vs. Second Quarter 2018 Q3 2018 + Higher polyethylene and styrene sales volumes vs. Q2 2018 - Higher feedstock costs Average Sales Price Volume - Lower polyethylene sales prices -5.6% +17.8% 5

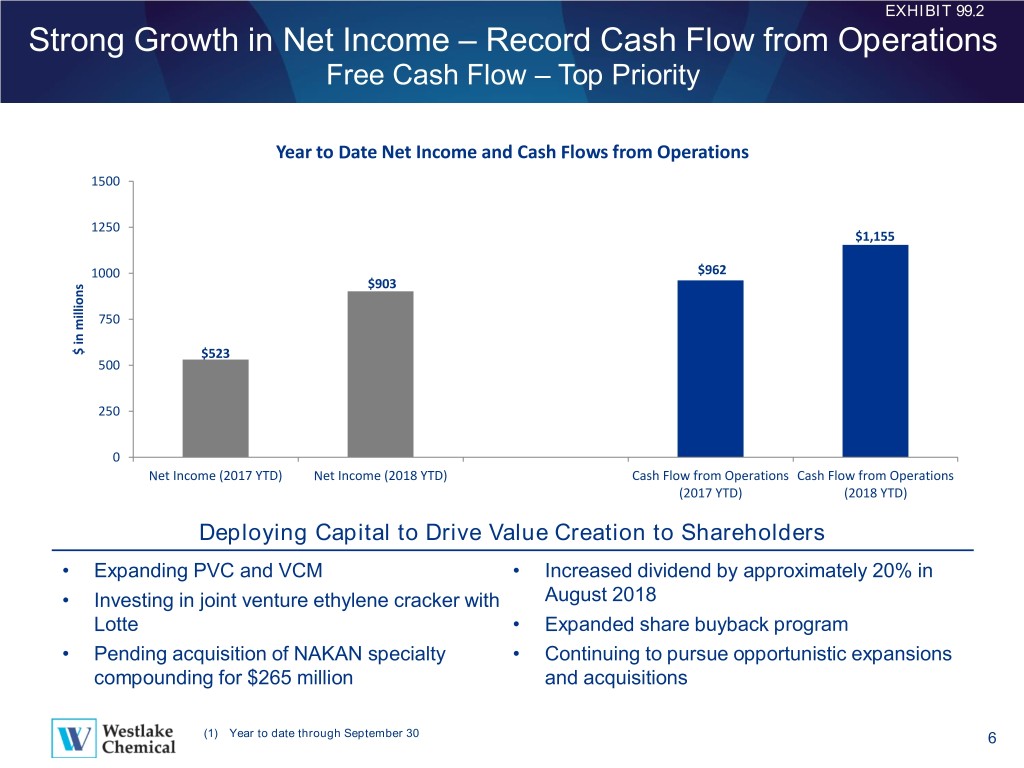
EXHIBIT 99.2 Strong Growth in Net Income – Record Cash Flow from Operations Free Cash Flow – Top Priority Year to Date Net Income and Cash Flows from Operations 1500 1250 $1,155 1000 $962 $903 750 $ in $ millions $523 500 250 0 Net Income (2017 YTD) Net Income (2018 YTD) Cash Flow from Operations Cash Flow from Operations (2017 YTD) (2018 YTD) Deploying Capital to Drive Value Creation to Shareholders • Expanding PVC and VCM • Increased dividend by approximately 20% in • Investing in joint venture ethylene cracker with August 2018 Lotte • Expanded share buyback program • Pending acquisition of NAKAN specialty • Continuing to pursue opportunistic expansions compounding for $265 million and acquisitions (1) Year to date through September 30 6

EXHIBIT 99.2 7

EXHIBIT 99.2 Reconciliation of Westlake EBITDA to Net Income and to Cash Flow from Operating Activities (in $ millions) 3Q 2018 2Q 2018 3Q 2017 YTD 3Q 2018 YTD 3Q 2017 EBITDA 580 568 522 1,727 1,324 Less: Depreciation and Amortization (161) (156) (154) (473) (449) Other Income (23) (8) (4) (53) (13) Operating Income (Loss) 396 404 364 1,201 862 Less: Income Tax (Provision) Benefit (73) (93) (109) (255) (233) Interest Expense (28) (31) (40) (96) (119) Other Income 23 8 4 53 13 Non Controlling Interest (10) (10) (8) (30) (21) Net Income (Loss) 308 278 211 873 502 Non Controlling Interest 10 10 8 30 21 Changes in operating assets & liabilities 259 7 255 178 416 Deferred income taxes 29 29 8 74 23 Cash flow from operating activities 606 324 482 1,155 962 Note 1 from page 2: Non-GAAP Financial Measures This presentation includes the non-GAAP measure EBITDA. A reconciliation to net income and to cash flow from operating activities is included above. 8

EXHIBIT 99.2 Reconciliation of Vinyls, Olefins and Corporate EBITDA to Applicable Operating Income (Loss) (in $ millions) 3Q 2018 2Q 2018 3Q 2017 YTD 3Q 2018 YTD 3Q 2017 Vinyls EBITDA 391 395 333 1,182 764 Less: Depreciation and Amortization (124) (120) (118) (362) (332) Other Income (16) (4) (1) (32) (7) Vinyls Operating Income (Loss) 251 271 214 788 425 Olefins EBITDA 198 192 201 589 602 Less: Depreciation and Amortization (35) (33) (35) (102) (111) Other Income (1) (1) - (4) (2) Olefins Operating Income (Loss) 162 158 166 483 489 Corporate EBITDA (9) (19) (12) (44) (42) Less: Depreciation and Amortization (2) (3) (1) (9) (6) Other Income (6) (3) (3) (17) (4) Corporate Operating Income (Loss) (17) (25) (16) (70) (52) Vinyls Operating Income (Loss) 251 271 214 788 425 Olefins Operating Income (Loss) 162 158 166 483 489 Corporate Operating Income (Loss) (17) (25) (16) (70) (52) Total Operating Income (Loss) 396 404 364 1,201 862 Note 1 from page 2: Non-GAAP Financial Measures This presentation includes the non-GAAP measure Vinyls EBITDA, Olefins EBITDA and Corporate EBITDA. A reconciliation to 9 applicable operating income (loss) is included above.

EXHIBIT 99.2 Safe Harbor Language This presentation contains certain forward-looking statements, including statements with respect to the timing of the expected closing of the pending acquisition of NAKAN. Actual results may differ materially depending on factors such as general economic and business conditions; the cyclical nature of the chemical industry; the availability, cost and volatility of raw materials and energy; uncertainties associated with the United States, Europe and worldwide economies, including those due to political tensions in the Middle East, Ukraine and elsewhere; current and potential governmental regulatory actions in the United States and Europe and regulatory actions and political unrest in other countries; industry production capacity and operating rates; the supply/ demand balance for our products; competitive products and pricing pressures; instability in the credit and financial markets; access to capital markets; terrorist acts; operating interruptions (including leaks, explosions, fires, weather-related incidents, mechanical failure, unscheduled downtime, labor difficulties, transportation interruptions, spills and releases and other environmental risks); changes in laws or regulations; technological developments; our ability to implement our business strategies; creditworthiness of our customers; the results of potential negotiations between Westlake Chemical Corporation and Westlake Chemical Partners; the satisfaction of closing conditions and other factors described in our reports filed with the Securities and Exchange Commission. Many of these factors are beyond our ability to control or predict. Any of these factors, or a combination of these factors, could materially affect our future results of operations and the ultimate accuracy of the forward-looking statements. These forward-looking statements are not guarantees of our future performance, and our actual results and future developments may differ materially from those projected in the forward-looking statements. Management cautions against putting undue reliance on forward-looking statements. Every forward-looking statement speaks only as of the date of the particular statement, and we undertake no obligation to publicly update or revise any forward-looking statements. Investor Relations Contacts Steve Bender Jeff Holy Executive Vice President & Vice President & Chief Financial Officer Treasurer Westlake Chemical 2801 Post Oak Boulevard, Suite 600 Houston, Texas 77056 713-960-9111 10
