Attached files
| file | filename |
|---|---|
| 8-K - 8-K - Univar Solutions Inc. | form8-kearningsreleaseq320.htm |
| EX-99.1 - EXHIBIT 99.1 - Univar Solutions Inc. | ex991-enr_q32018.htm |

Third Quarter 2018 Earnings Call November 6, 2018

Forward-Looking Statements This presentation includes certain statements relating to future events and our intentions, beliefs, expectations, and predictions for the future which are “forward-looking statements” within the meaning of the Private Securities Litigation Reform Act of 1995. Forward-looking statements are subject to known and unknown risks and uncertainties, many of which may be beyond our control. We caution you that the forward-looking information presented in this presentation is not a guarantee of future events or results, and that actual events or results may differ materially from those made in or suggested by the forward-looking information contained in this presentation. In addition, forward-looking statements generally can be identified by the use of forward-looking terminology such as "outlook," "guidance," “may,” “plan,” “seek,” “comfortable with,” “will,” “expect,” “intend,” “estimate,” “anticipate,” “believe” or “continue” or the negatives or variations of these terms. Forward-looking information contained in this presentation is made only as of the date of this presentation, and we do not undertake any obligation to update or revise any forward-looking information to reflect changes in assumptions, the occurrence of unanticipated events, or otherwise. Regulation G: Non-GAAP Measures The information presented herein regarding certain unaudited non-GAAP measures does not conform to generally accepted accounting principles in the United States (U.S. GAAP) and should not be construed as an alternative to the reported results determined in accordance with U.S. GAAP. Univar has included this non- GAAP information to assist in understanding the operating performance of the company and its operating segments. These non-GAAP financial measures include gross profit (exclusive of depreciation), gross margin (exclusive of depreciation), delivered gross profit (exclusive of depreciation), Adjusted EBITDA, Adjusted EBITDA margin, Adjusted net income and Adjusted earnings per share ("Adjusted EPS"). The non-GAAP information provided may not be consistent with the methodologies used by other companies. All non-GAAP information related to previous Univar filings with the SEC has been reconciled with reported U.S. GAAP results. 2

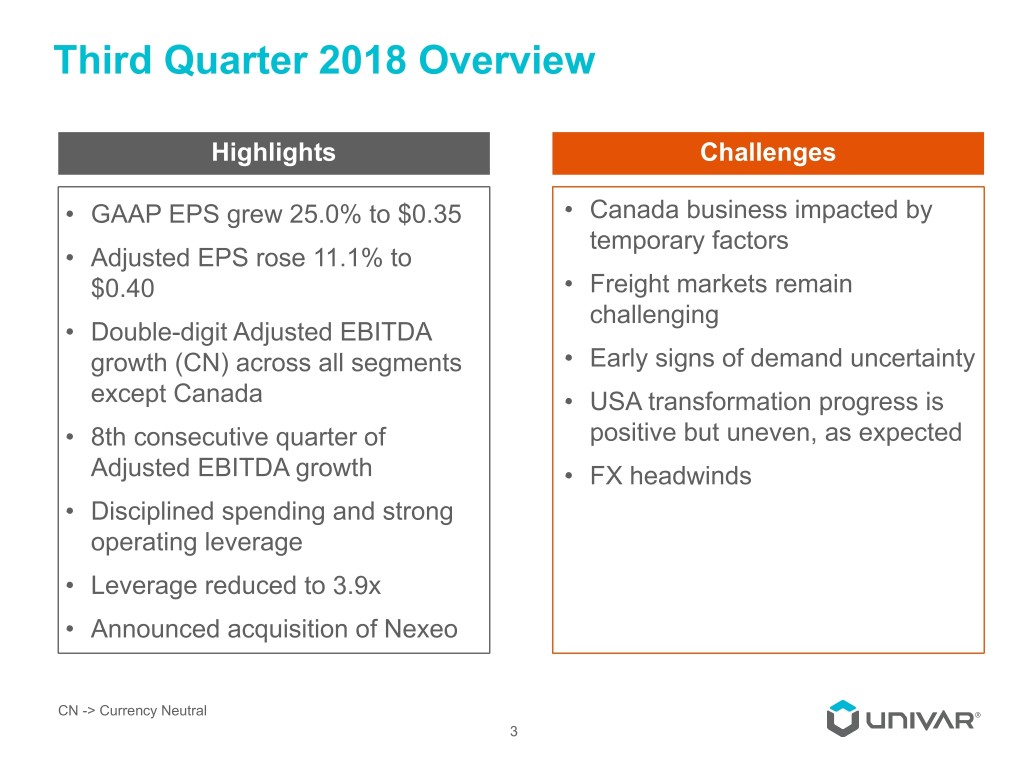
Third Quarter 2018 Overview Highlights Challenges • GAAP EPS grew 25.0% to $0.35 • Canada business impacted by temporary factors • Adjusted EPS rose 11.1% to $0.40 • Freight markets remain challenging • Double-digit Adjusted EBITDA growth (CN) across all segments • Early signs of demand uncertainty except Canada • USA transformation progress is • 8th consecutive quarter of positive but uneven, as expected Adjusted EBITDA growth • FX headwinds • Disciplined spending and strong operating leverage • Leverage reduced to 3.9x • Announced acquisition of Nexeo CN -> Currency Neutral 3

Third Quarter 2018 Financial Summary Global double digit growth outside of Canada Q3 GAAP EPS (1) $0.35 vs. $0.28 prior year Ÿ Reported net income rose 27.5% to $49.6 million vs. $38.9 million in the prior year Ÿ GAAP EPS increased 25.0% to $0.35 Q3 Adjusted EPS (1)(2) $0.40 vs. $0.36 prior year Ÿ Higher tax rate was a $0.08 per share headwind Ÿ Additional pressure from FX translation rates Q3 Adjusted EBITDA (1) $157.0 million vs. $149.3 million in 2017 Ÿ Mix improvement led to ninth consecutive quarter of higher profitability per pound Ÿ Solid operating leverage resulted in a conversion ratio increase of 70 basis points Ÿ Adjusted EBITDA margin improved for the ninth quarter in a row, increasing 10 basis points to 7.4% Ÿ Strong free cash flow supported continued deleveraging (1) Variances to Q3 2017. (2) Adjusted Net Income / Diluted Weighted Average Shares Outstanding. Adjusted net income excludes the same items that are excluded from Adjusted EBITDA, except for stock-based compensation expense and non-operating retirement benefits. 4

Balance Sheet Highlights Deleveraging on-track LTM ended September 30, ($ in millions) 2018 2017 Y/Y Net Debt (1) $2,523.8 $2,676.9 ($153.1) Leverage (2) 3.9x 4.6x (0.7x) Interest Coverage (3) 5.1x 4.2x 0.9x Return on Assets Deployed (4) 24.6% 21.9% 270 bps (1) Net Debt defined as Total Debt (Long term debt, inclusive of debt discount and unamortized debt issuance costs, plus short term financing) less cash and cash equivalents. (2) Net Debt divided by last 12 months (LTM) of Adjusted EBITDA. (3) Interest coverage defined as LTM Adjusted EBITDA / LTM Cash Interest (net of interest income). (4) LTM Earnings before Interest, Taxes and Amortization (EBITA) divided by trailing 13 month average of net PP&E plus net working capital (accounts receivable plus inventory less accounts payable). 5

Univar – Consolidated Highlights ($ in millions) KEY METRICS Improving execution Three months ended 2018 2017 Y/Y drives profitable gains September 30, • Sales force becoming more External Net Sales $2,130.7 $2,048.7 4.0% effective Currency Neutral -- -- 6.2% • Institutionalizing commercial (1) disciplines to support sustainable Gross Profit $468.7 $454.8 3.1% growth Gross Margin (2) 22.0% 22.2% -20 bps • Operational productivity tracking Outbound freight $82.7 $74.8 10.6% well to targets and handling • Expanded conversion ratio by 70 (3) basis points Del. Gross Profit $386.0 $380.0 1.6% Adjusted EBITDA $157.0 $149.3 5.2% Currency Neutral -- -- 8.2% Adjusted EBITDA Margin 7.4% 7.3% +10 bps Conversion Ratio (4) 33.5% 32.8% +70 bps (1) Gross profit defined as net sales less cost of goods sold (exclusive of depreciation). (2) Gross margin is calculated by dividing gross profit by external net sales. (3) Delivered gross profit is calculated by subtracting outbound freight and handling costs from gross profit. (4) Conversion Ratio defined as Adjusted EBITDA / Gross Profit. 6

USA – Highlights ($ in millions) KEY METRICS Transformation Three months ended 2018 2017 Y/Y advances September 30, • Double-digit Adjusted External Net Sales $1,285.3 $1,185.0 8.5% EBITDA growth from solid top line growth and strong Gross Profit (1) $290.4 $273.4 6.2% operating leverage • Margins impacted by Gross Margin (2) 22.6% 23.1% -50 bps seasonal product mix and Outbound freight inflation in chemical prices $56.1 $50.3 11.5% and handling Del. Gross Profit (3) $234.3 $223.1 5.0% Adjusted EBITDA $99.4 $90.4 10.0% Adjusted EBITDA Margin 7.7% 7.6% +10 bps (1) Gross profit defined as net sales less cost of goods sold (exclusive of depreciation). (2) Gross margin is calculated by dividing gross profit by external net sales. (3) Delivered gross profit is calculated by subtracting outbound freight and handling costs from gross profit. 7

CANADA – Highlights ($ in millions) KEY METRICS Strength in industrial Three months ended 2018 2017 Y/Y chemicals offset by September 30, temporary impacts External Net Sales $273.5 $299.9 (8.8)% • Double-digit Adjusted EBITDA Currency Neutral -- -- (3.3)% growth in Eastern Canada industrial markets Gross Profit (1) $48.7 $56.2 (13.3)% • Growth more than offset by Currency Neutral -- -- (8.4)% weather-disrupted agriculture market and large customer Gross Margin (2) 17.8% 18.7% -90 bps partial plant shutdown Outbound freight $10.1 $9.1 11.0% • FX headwinds and handling Del. Gross Profit (3) $38.6 $47.1 (18.0)% Adjusted EBITDA $19.2 $25.2 (23.8)% Currency Neutral -- -- (17.9)% Adjusted EBITDA Margin 7.0% 8.4% -140 bps (1) Gross profit defined as net sales less cost of goods sold (exclusive of depreciation). (2) Gross margin is calculated by dividing gross profit by external net sales. (3) Delivered gross profit is calculated by subtracting outbound freight and handling costs from gross profit. 8

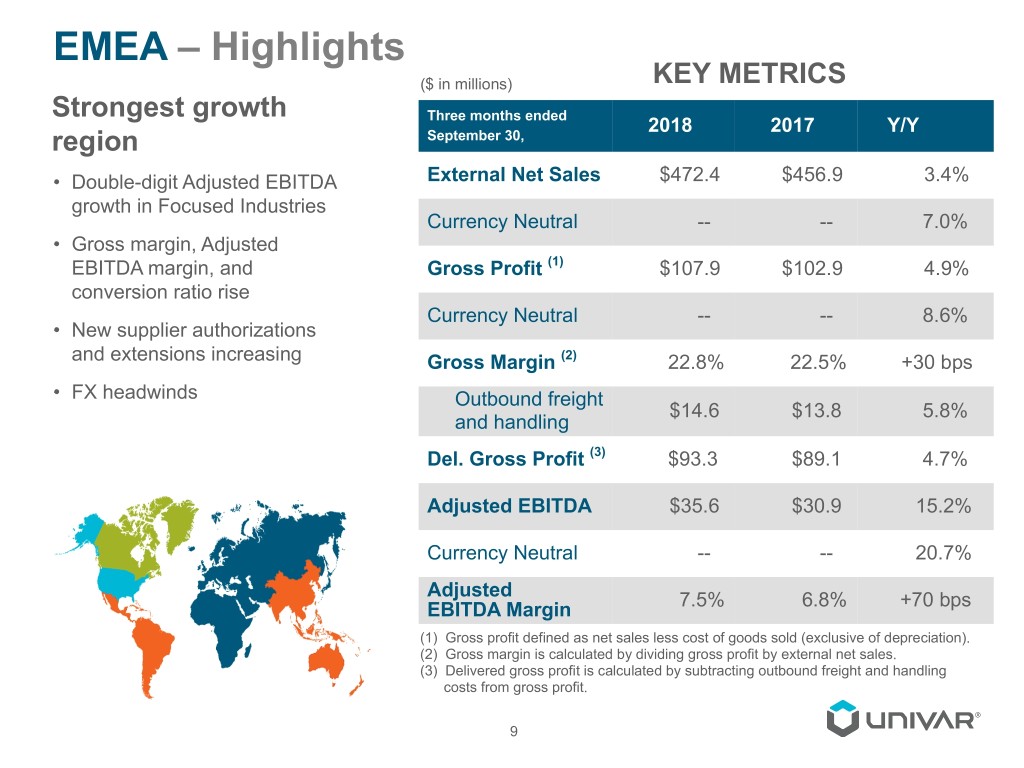
EMEA – Highlights ($ in millions) KEY METRICS Strongest growth Three months ended 2018 2017 Y/Y region September 30, • Double-digit Adjusted EBITDA External Net Sales $472.4 $456.9 3.4% growth in Focused Industries Currency Neutral -- -- 7.0% • Gross margin, Adjusted EBITDA margin, and Gross Profit (1) $107.9 $102.9 4.9% conversion ratio rise Currency Neutral -- -- 8.6% • New supplier authorizations and extensions increasing Gross Margin (2) 22.8% 22.5% +30 bps • FX headwinds Outbound freight $14.6 $13.8 5.8% and handling Del. Gross Profit (3) $93.3 $89.1 4.7% Adjusted EBITDA $35.6 $30.9 15.2% Currency Neutral -- -- 20.7% Adjusted EBITDA Margin 7.5% 6.8% +70 bps (1) Gross profit defined as net sales less cost of goods sold (exclusive of depreciation). (2) Gross margin is calculated by dividing gross profit by external net sales. (3) Delivered gross profit is calculated by subtracting outbound freight and handling costs from gross profit. 9

REST OF WORLD – Highlights ($ in millions) KEY METRICS Double-digit growth Three months ended 2018 2017 Y/Y offset by FX headwinds September 30, • Growth in Brazil and increasing External Net Sales $99.5 $106.9 (6.9)% profitability in Asia Pacific Currency Neutral -- -- 4.2% • Gross margin improved due to favorable mix Gross Profit (1) $21.7 $22.3 (2.7)% • Strong operating leverage Currency Neutral -- -- 11.7% Gross Margin (2) 21.8% 20.9% +90 bps Outbound freight $1.9 $1.6 18.8% and handling Del. Gross Profit (3) $19.8 $20.7 (4.3)% Adjusted EBITDA $9.1 $9.3 (2.2)% Currency Neutral -- -- 12.9% Adjusted EBITDA Margin 9.1% 8.7% +40 bps (1) Gross profit defined as net sales less cost of goods sold (exclusive of depreciation). (2) Gross margin is calculated by dividing gross profit by external net sales. (3) Delivered gross profit is calculated by subtracting outbound freight and handling costs from gross profit. 10

Cash Flow Highlights Three months ended September 30, ($ in millions) 2018 2017 Y/Y Net cash provided by operating $46.4 $48.3 (3.9)% activities Cash Interest (net) ($37.5) ($41.4) (9.4)% Cash Taxes ($11.0) ($3.4) 223.5 % Pension Contribution ($6.6) ($13.6) (51.5)% Net Working Capital ($60.2) ($31.6) 90.5 % Capital Expenditures (1) ($14.8) ($19.4) (23.7)% Acquisitions $0.4 ($23.9) NM (1) Excludes additions from capital leases. 11

OUTLOOK EXPECTATIONS Q4 2018 & Full Year 2018 2018 Full Year 2018 Advance Commercial Greatness, Adjusted EBITDA Operational Excellence and One Univar high single digit % growth initiatives versus 2017 (1) Selective commercial and technology investments Q4 2018 Strategic, selective and disciplined Adjusted EBITDA acquisition approach essentially flat to Q4 2017 (2) result Continue to de-leverage the balance sheet Transformation into a growth company (1) Assumes growth of 2017 Adjusted EBITDA of $603.7 million, restated for the adoption of the FASB retirement benefits pronouncement or $593.8 million. (2) Q4 17 Adjusted EBITDA of $148.5 million, restated for the adoption of the FASB retirement benefits pronouncement or $146.1 million. 12

Nexeo Acquisition Overview Transaction Details Strategic Rationale (3) Financial Benefits (3) • Univar to acquire 100% • Combined Company will • $100 million of operating of the outstanding shares drive growth and synergies expected of Nexeo (NASDAQ: shareholder value annually from combining NXEO) • North America's largest chemicals and • Transaction is inclusive of chemicals and ingredients businesses Nexeo net debt and other ingredients sales force • $15 million in annual run obligations • Broadest product offering rate capex savings • Per share consideration: • Most efficient supply • Accretive to earnings and each Nexeo share chain network in the cash flow beginning in receives 0.305 shares of industry the first full year post Univar common stock closing (1) • Accelerates digital plus $3.29 in cash transformation • $375 million+ annual free • Expected 1H19 close (2) cash flow (4) in first full year post closing Accelerating Univar's Transformation and Growth (1) Cash consideration of $3.29 per share is subject to reduction by up to $0.41 per share based on the closing price of Univar common stock on the day prior to the consummation of the acquisition. The cash consideration will be reduced on a linear basis from $3.29 to $2.88 per share of Nexeo common stock to the extent that the closing price of Univar common stock is between $25.34 and $22.18. If the closing price of Univar common stock is $22.18 per share or lower, the cash consideration will be $2.88 per share of Nexeo common stock. If the closing price of Univar common stock is $25.34 per share or higher, the cash consideration will be $3.29 per share of Nexeo common stock. Following the closing, existing Nexeo equity warrants will be exercisable for the merger consideration on a cashless basis in accordance with the terms of the warrant agreement, which can be found in Nexeo’s SEC filings. (2) The transaction is expected to close during the first half of 2019, subject to the approval of both Univar and Nexeo shareholders, as well as receipt of regulatory approvals and satisfaction of other customary conditions. (3) Anticipated assuming transaction close. (4) Including net one-time integration costs. 13

Full-Year 2018 Guidance Year ended December 31, ($ in millions, except per share data) 2018 2017 Adjusted EPS ~$1.60 $1.39 high single digit Adjusted EBITDA $593.8 (1) % growth Cash Interest (net) ~($125) ($136.3) Tax Rate on Adjusted EPS ~28% 16.3% Pension Contribution ~($42) ($38.2) Change in Net Working Capital ~($50 - 100) ($52.6) Capital Expenditures ~($90) ($82.7) Debt Amortization ~($17) ($89.2) (1) Restated to reflect the adoption of the FASB retirement benefits pronouncement. Note: Cash inflow +/ Cash outflow - 14

Appendix - Q3 2018 Adjusted Net Income and Adjusted EBITDA Reconciliation Three months ended September 30, 2018 2017 ($ in millions, except per share data) Amount per share (1) Amount per share (1) Net income $49.6 $0.35 $38.9 $0.28 Other operating expenses, net (excluding $8.4 $0.06 $7.3 $0.05 stock-based compensation) Other expense, net (excluding non- $0.8 $0.01 $7.1 $0.05 operating retirement benefits) Benefit from income taxes related to ($2.6 ) ($0.02 ) ($2.2 ) ($0.02 ) reconciling items Other non-recurring tax items $0.6 $— $— $— Adjusted net income $56.8 $0.40 $51.1 $0.36 Stock-based compensation expense $4.0 $4.5 Non-operating retirement benefits ($3.3 ) ($2.7 ) Interest expense, net $32.2 $38.4 Depreciation and amortization $45.0 $49.3 All remaining provision for income taxes $22.3 $8.7 Adjusted EBITDA $157.0 $149.3 (1) Immaterial differences may exist in summation of per share amounts due to rounding. 15

