Attached files
| file | filename |
|---|---|
| 8-K - FORM 8-K - TEAM INC | a8-kinvestorpresentationno.htm |
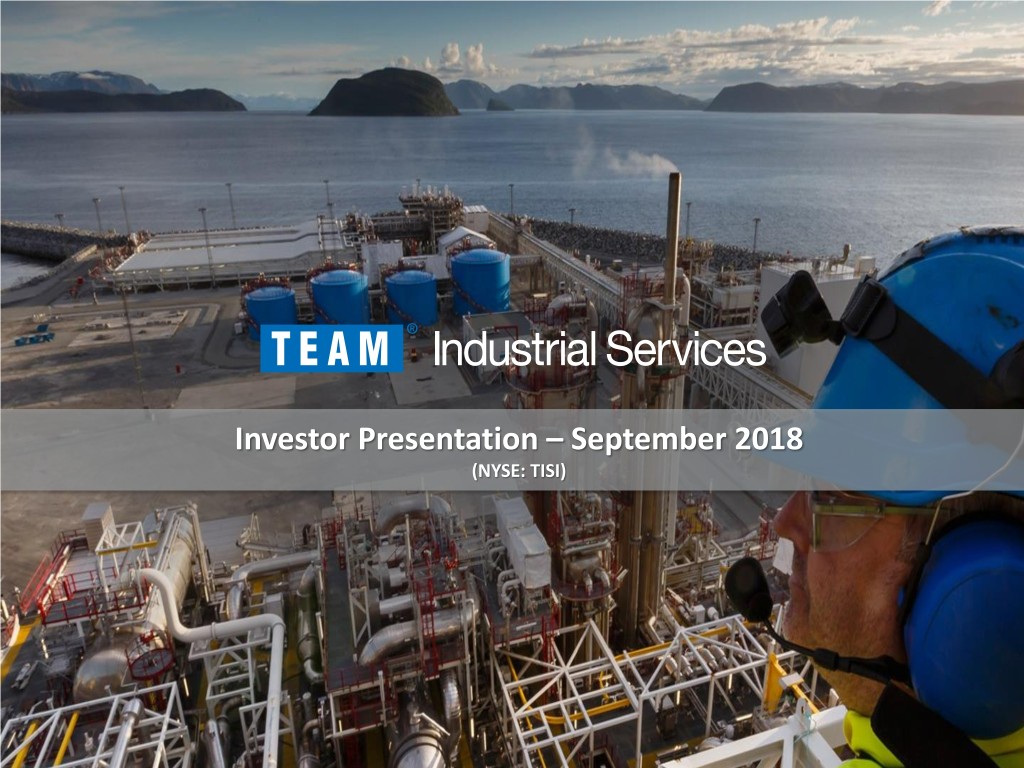
Investor Presentation – September 2018 (NYSE: TISI) ©Copyright 2018. TEAM, Inc. All Rights Reserved.

Safe Harbor Statement + Certain forward-looking information contained herein is being provided in accordance with the provisions of the Private Securities Litigation Reform Act of 1995. We have made reasonable efforts to ensure that the information, assumptions and beliefs upon which this forward-looking information is based are current, reasonable and complete. Such forward- looking statements involve estimates, assumptions, judgments and uncertainties. There are known and unknown factors that could cause actual results or outcomes to differ materially from those addressed in the forward-looking information. Such known factors are detailed in the Company's Annual Report on Form 10-K and in the Company's Quarterly Reports on Form 10-Q as filed with the Securities and Exchange Commission, and in other reports filed by the Company with the Securities and Exchange Commission from time to time. Accordingly, there can be no assurance that the forward-looking information contained herein, including projected cost savings, will occur or that objectives will be achieved. We assume no obligation to publicly update or revise any forward-looking statements made today or any other forward-looking statements made by the Company, whether as a result of new information, future events or otherwise, except as may be required by law. Driving Execution Excellence 2 ©Copyright 2018. TEAM, Inc. All Rights Reserved. ©Copyright 2018. TEAM, Inc. All Rights Reserved.

TEAM at a Glance + Premier provider of specialized industrial services to a broad range of energy and industrial end markets + Our customers view our services as required for uptime and safe operations and not discretionary – vital to their ongoing operations + Broad and differentiated set of technology for inspection and mechanical services focused on the integrity of our customers’ assets + Longstanding relationships with our customers – spanning over 20 years + Global footprint of over 200 locations in 20 countries – we are where our customers need us + Safety culture – TRIR of 0.39 in 2017 + Significant financial and operating scale – over $1.2 billion of annual revenue and more than 7,300 employees Driving Execution Excellence 3 ©Copyright 2018. TEAM, Inc. All Rights Reserved. ©Copyright 2018. TEAM, Inc. All Rights Reserved.

Core Values SAFETY FIRST / SERVICE PRIDE AND QUALITY ALWAYS INTEGRITY LEADERSHIP INNOVATION RESPECT TEAMWORK In everything we do Uncompromising Leading service Supports For our customers, Global teamwork standards of integrity quality, continuous growth for each other and and and ethical conduct professionalism and improvement for all our collaboration and responsiveness stakeholders Driving Execution Excellence 4 ©Copyright 2018. TEAM, Inc. All Rights Reserved. ©Copyright 2018. TEAM, Inc. All Rights Reserved.
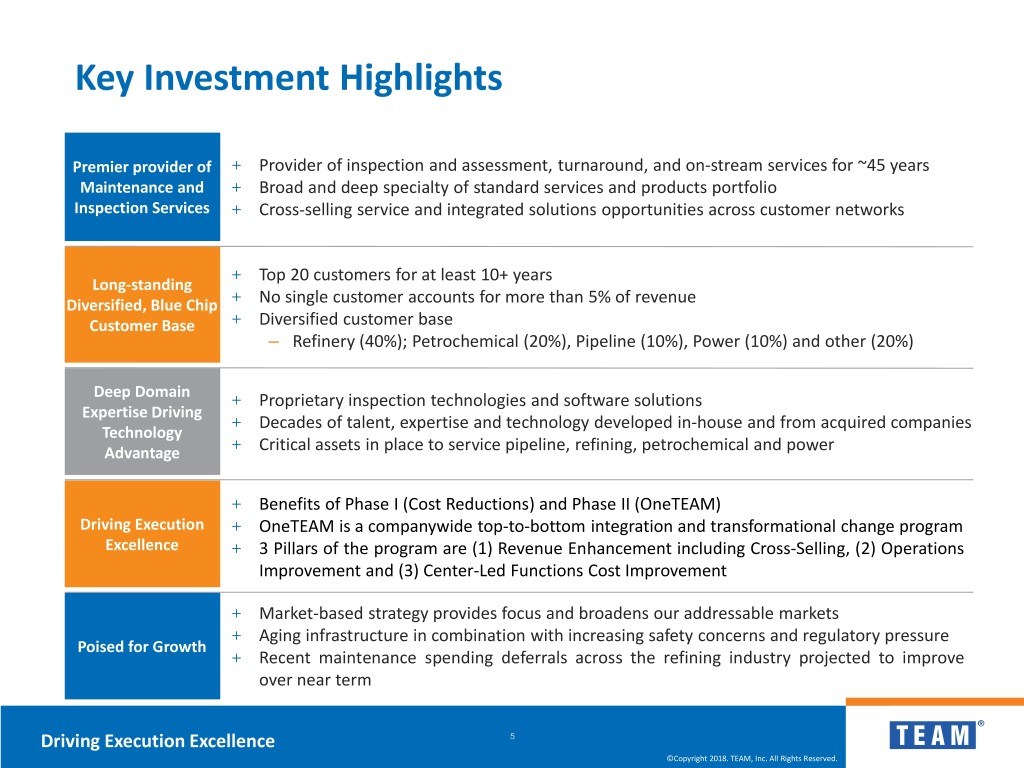
Key Investment Highlights Premier provider of + Provider of inspection and assessment, turnaround, and on-stream services for ~45 years Maintenance and + Broad and deep specialty of standard services and products portfolio Inspection Services + Cross-selling service and integrated solutions opportunities across customer networks + Top 20 customers for at least 10+ years Long-standing + Diversified, Blue Chip No single customer accounts for more than 5% of revenue Customer Base + Diversified customer base – Refinery (40%); Petrochemical (20%), Pipeline (10%), Power (10%) and other (20%) Deep Domain + Proprietary inspection technologies and software solutions Expertise Driving + Decades of talent, expertise and technology developed in-house and from acquired companies Technology + Advantage Critical assets in place to service pipeline, refining, petrochemical and power + Benefits of Phase I (Cost Reductions) and Phase II (OneTEAM) Driving Execution + OneTEAM is a companywide top-to-bottom integration and transformational change program Excellence + 3 Pillars of the program are (1) Revenue Enhancement including Cross-Selling, (2) Operations Improvement and (3) Center-Led Functions Cost Improvement + Market-based strategy provides focus and broadens our addressable markets + Aging infrastructure in combination with increasing safety concerns and regulatory pressure Poised for Growth + Recent maintenance spending deferrals across the refining industry projected to improve over near term Driving Execution Excellence 5 ©Copyright 2018. TEAM, Inc. All Rights Reserved. ©Copyright 2018. TEAM, Inc. All Rights Reserved.

Agenda + 7,300+ highly trained and experienced specialty Who We Are technicians delivering services locally through 200+ locations What We Do Market Dynamics OneTEAM Financial Highlights Driving Execution Excellence 6 ©Copyright 2018. TEAM, Inc. All Rights Reserved. ©Copyright 2018. TEAM, Inc. All Rights Reserved.

Enterprise Legacy of Growth 1960 METALOCK LTD ACQUIRED 2007 MECHANICAL 2004 AITEC 2010 SERVICES ADDED 1980 COOPERHEAT- INSPECTION QUEST INTEGRITY TO COMPANY INITAIL PUBLIC MQS SERVICES GROUP, LLC OFFERINGS OFFERING ACQUIRED ACQUIRED ACQUIRED 1929 1973 1999 2006 2008 FURMANITE TEAM X RAY INSPECTION, GENERAL SERVICES LEAK REPAIRS BECOMES FULL INDUSTRIAL INC. ACQUIRED GROUP (GSG) SPECAM LEAK SEALING SERVICES INC. IS OF FLOWSERVE ACQUIRED COMPANY FOUNDED CORPORATION ACQUIRED 2016 FURMANITE CORPORATION ACQUIRED 2011 ACQUISITION OF SELF LEVELING 2013 QUALITY INSPECTION MACHINES, INC. GLOBAL ASCENT, INC. SERVICES AND TIAT ACQUIRED ACQUIRED INSPECTION IN EUROPE 2012 2015 QUALSPEC DK AMANS VALVE GROUP FORMED ACQUIRED TCI SERVICES INC. QUALSPEC ACQUIRED GROUP ACQUIRED Driving Execution Excellence 7 ©Copyright 2018. TEAM, Inc. All Rights Reserved. ©Copyright 2018. TEAM, Inc. All Rights Reserved.

Leading Technological Advancements 2008 2005 QUEST INTEGRITY 2013 1924 1929 TEAM INTRODUCES LAUNCHES SUITE OF TEAM INTRODUCES METHOD 21 REPORTER UT ILI TOOLS L-CATT, LDAR EUGENE CLAY FURMANITE SOFTWARE FOR QUALITY COMPLIANCE FURMAN DEVELOPS BECOMES FULL TEAM INTRODUCES AND COMPLIANCE ASSURANCE TICKET FIRST DIY LEAK LEAK SEALING SPECIALTY FIELD VERIFICATION OF FIELD TRACKER SEALING KITS COMPANY DATA MACHINING SERVICES 1920 1927 1980 2007 2011 EUGENE CLAY EUGENE CLAY FURMAN TEAM BECOMES TEAM EUROPE TEAM INTRODUCES FURMAN FILES 1ST LEAK SEALING 1ST COMPANY TO INTRODUCES CNC SMARTHEAT-WIRELESS DEVELOPS LEAK PROCESS PATENT PROVIDE LDAR MANUFACTURING OF HEAT TREATMENT SEALING PROCESS SERVICES TO THE LEAK REPAIR TECHNOLOGY EUGENE CLAY FURMAN INDUSTRY ENCLOSURES MARKETS LEAK SEALING KITS 2016 2018 QUEST INTEGRITY TEAM ADDS INTRODUCES GROUND ON-STREAM BREAKING, HIGH INSPECTION RESOLUTION 2” PROGRAMS TO UT ILI TOOLS DIGITAL PLATFORM 2015 2017 TEAM LAUNCHES TEAM SUCCESSFULLY HIGH ENERGY PIPING DIGITIZES MULTI-UNIT (HEP) PHASED ARRAY TURNAROUND INSPECTION INSPECTION PROCEDURES AND QUEST INTEGRITY WORKFLOW LAUNCHES SUBSEA AND HIGH RESOLUTION UT ILI TOOLS TEAM MODERNIZES MANUFACTURING WITH AUTOMATION AND 5- AXIS CNC CAPABILITIES Driving Execution Excellence 8 ©Copyright 2018. TEAM, Inc. All Rights Reserved. ©Copyright 2018. TEAM, Inc. All Rights Reserved.
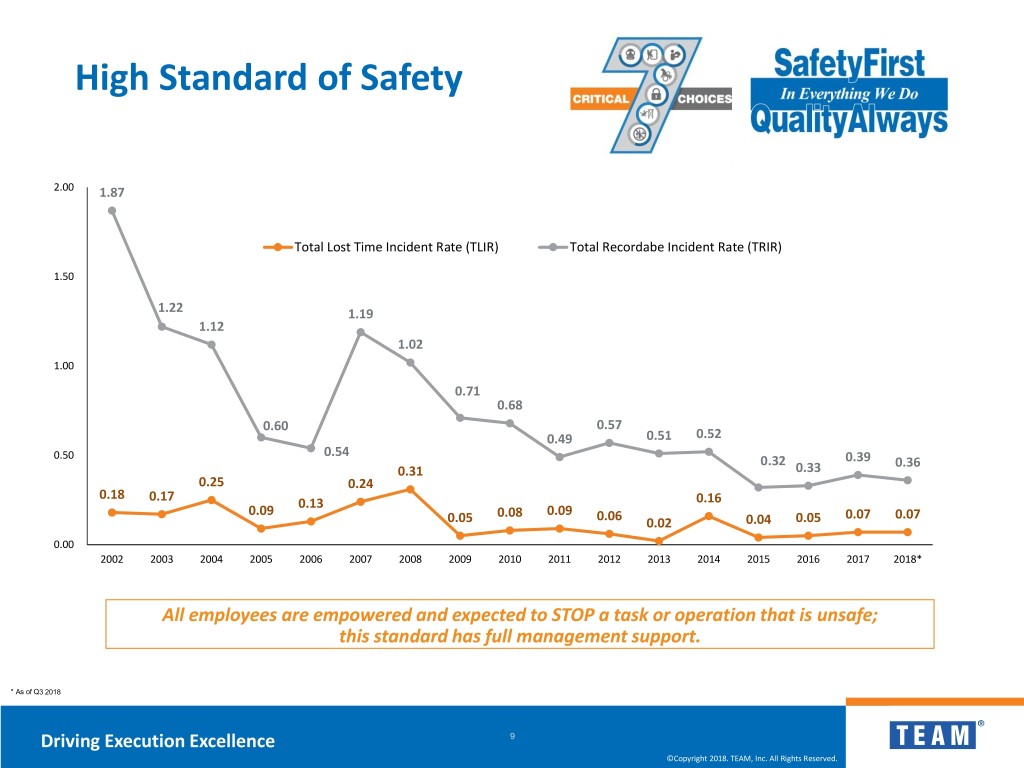
High Standard of Safety 2.00 1.87 Total Lost Time Incident Rate (TLIR) Total Recordabe Incident Rate (TRIR) 1.50 1.22 1.19 1.12 1.02 1.00 0.71 0.68 0.60 0.57 0.49 0.51 0.52 0.50 0.54 0.32 0.39 0.36 0.31 0.33 0.25 0.24 0.18 0.17 0.13 0.16 0.09 0.08 0.09 0.06 0.07 0.07 0.05 0.02 0.04 0.05 0.00 2002 2003 2004 2005 2006 2007 2008 2009 2010 2011 2012 2013 2014 2015 2016 2017 2018* All employees are empowered and expected to STOP a task or operation that is unsafe; this standard has full management support. * As of Q3 2018 Driving Execution Excellence 9 ©Copyright 2018. TEAM, Inc. All Rights Reserved. ©Copyright 2018. TEAM, Inc. All Rights Reserved.

Worldwide Footprint. Local Responsiveness. Employees 7,300+ Operational Countries 20 Total Locations 200 Global Support Centers 34 Corporate Headquarters Sugar Land, Texas Driving Execution Excellence 10 ©Copyright 2018. TEAM, Inc. All Rights Reserved. ©Copyright 2018. TEAM, Inc. All Rights Reserved.

Geographic and Service Diversification Strength Revenue by Segment Revenue by Geography Quest Integrity Inspection & RoW ($82 M) Europe 6% 7% Heat Treating 10% ($588 M) Canada United 49% 11% States 44% 73% Mechanical Services ($530 M) Global Footprint Key Benefits of Scale + Attract, develop and retain skilled employees Employees 7,300+ + Integrated service capability driving customer value Locations 200+ + Enhanced opportunity with larger, more complex projects + Better access to serve new customers Countries 20 + Enhanced purchasing power with supplier base RoW (Rest of World): Latin America and Asia + Strong safety and quality culture Based on 2017 Financials Driving Execution Excellence 11 ©Copyright 2018. TEAM, Inc. All Rights Reserved. ©Copyright 2018. TEAM, Inc. All Rights Reserved.

Agenda + 7,300+ highly trained and experienced specialty technicians Who We Are delivering services locally through 200+ locations + Provider of inspection and assessment, What We Do turnaround, and on-stream services for ~45 years Market Dynamics OneTEAM Financial Highlights Driving Execution Excellence 12 ©Copyright 2018. TEAM, Inc. All Rights Reserved. ©Copyright 2018. TEAM, Inc. All Rights Reserved.

Unparalleled Breadth and Depth of Solutions INSPECTION MAINTENANCE HEAT TREATING ASSET INTEGRITY SOLUTIONS & REPAIR SOLUTIONS MANAGEMENT SOLUTIONS SOLUTIONS Validate the integrity Eliminate the need for Ensure pinpoint Improve operational of materials, parts costly shutdowns with precision and thermal planning with and components with specialized on line and processes accuracy technology-enabled, advanced testing on-site maintenance with our heat transfer advanced inspection methods and repair services. analysis and heat- and engineering and techniques. treating products assessment services and services. and products. Driving Execution Excellence 13 ©Copyright 2018. TEAM, Inc. All Rights Reserved. ©Copyright 2018. TEAM, Inc. All Rights Reserved.

Enabling Digital Data-Driven Integration Integrated Workflow - Collect, Assess and Repair (CAR) Repair or Asset Tagging High Quality Data Collect Data Replace Line Tracing Cross-Customer Inspection & Spatially Referenced Benchmarking Heat Treating Mechanical Recommend Maintenance Data Consistency Visualization Establishing Asset and Quest Services Digital Twins Registry Integrity Advanced Engineering Predictive Analytics Asset Optimization Machine Learning Statistical Analysis Assess Condition Quest Integrity, Inspection & Heat Treating and Mechanical Services Workflow cycle re-occurs on predictive, time or reactive basis depending upon operator progressiveness and plant or asset age and operating condition severity. Driving Execution Excellence 14 ©Copyright 2018. TEAM, Inc. All Rights Reserved. ©Copyright 2018. TEAM, Inc. All Rights Reserved.

Multi-Level Customer Relationship Nested/Resident Project/Turnaround Emergency/Call-out + On-site, full time personnel + Highly planned SOW’s + Personnel dispatched as + Field overhead billable + Location proximity highly needed + Performance based valuable + Expertise and proximity dependent + Regular/planned + Highly seasonal; Peak cycles maintenance in spring/fall + Emergency/unplanned services + Daily/weekly maintenance + New construction in the operations form of upgrades and + Medium and large scale expansions maintenance operations + Insight into future work + Maintenance on a reactive, time and predictive basis Driving Execution Excellence 15 ©Copyright 2018. TEAM, Inc. All Rights Reserved. ©Copyright 2018. TEAM, Inc. All Rights Reserved.
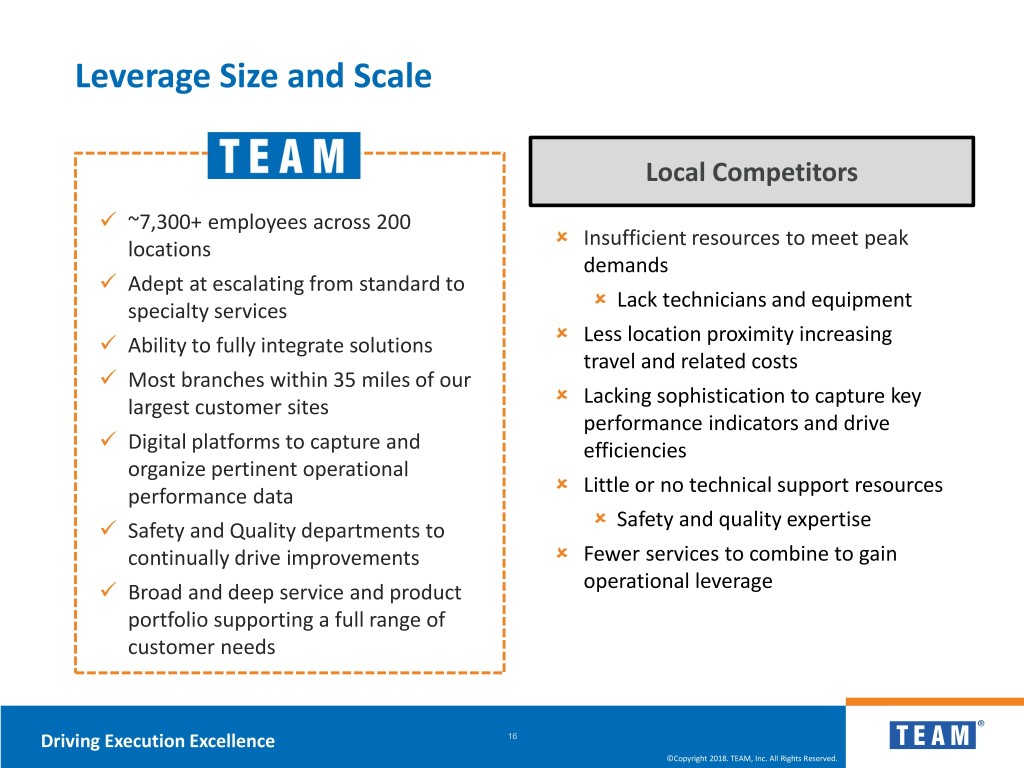
Leverage Size and Scale Local Competitors ~7,300+ employees across 200 Insufficient resources to meet peak locations demands Adept at escalating from standard to Lack technicians and equipment specialty services Less location proximity increasing Ability to fully integrate solutions travel and related costs Most branches within 35 miles of our Lacking sophistication to capture key largest customer sites performance indicators and drive Digital platforms to capture and efficiencies organize pertinent operational Little or no technical support resources performance data Safety and quality expertise Safety and Quality departments to continually drive improvements Fewer services to combine to gain operational leverage Broad and deep service and product portfolio supporting a full range of customer needs Driving Execution Excellence 16 ©Copyright 2018. TEAM, Inc. All Rights Reserved. ©Copyright 2018. TEAM, Inc. All Rights Reserved.

Differentiating Engineered Technologies Proprietary Inspection Technologies and Software Solutions + Advanced Inspection – globally standardized inspection solutions + InVista – In-line Inspection (ILI) system for un-piggable pipelines and buried or inaccessible process piping MANTISTM external crawler + FTIS - Furnace Tube Inspection System for fired heater serpentine coils FTIS™ Ultrasonic Intelligent Pig + LOTIS - Laser Optic Tube Inspection System for steam reformer tubes + MANTIS - External tube crawler for steam reformer tubes Corrosion illustrated in patented 2D and 3D graphics Custom Flow Loop and Test Facility Solutions for Target Markets + Pipeline Integrity Management – Midstream, Subsea + Fired Heater Integrity Management – Refining, Petrochemical, Chemical + Plant & Facility Piping Integrity Management - Refining, Petrochemical, Chemical + Steam Reformer Integrity Management – Syngas, Refining + Power Asset Integrity Management – Thermal, Geothermal, Hydro, Nuclear Driving Execution Excellence 17 ©Copyright 2018. TEAM, Inc. All Rights Reserved. ©Copyright 2018. TEAM, Inc. All Rights Reserved.

Team Digital Team Digital is our proprietary platform that maximizes quality and efficiency through digitally enabled workflows Planning, Remote Dispatch, Management, QA/QC Driving Execution Excellence 18 ©Copyright 2018. TEAM, Inc. All Rights Reserved. ©Copyright 2018. TEAM, Inc. All Rights Reserved.

Agenda + 7,300+ highly trained and experienced specialty Who We Are technicians delivering services locally through 200+ locations + Provider of inspection and assessment, What We Do turnaround, and on-stream services for ~45 years + Diverse customer base across several large Market Dynamics industrial markets OneTEAM Financial Highlights Driving Execution Excellence 19 ©Copyright 2018. TEAM, Inc. All Rights Reserved. ©Copyright 2018. TEAM, Inc. All Rights Reserved.

Industrial Services to Support Any Industry REFINING PETROCHEMICAL PIPELINE OFFSHORE POWER CHEMICAL NUCLEAR MANUFACTURING AEROSPACE MINING PULP PAPER GOVERNMENT AUTOMOTIVE Driving Execution Excellence 20 ©Copyright 2018. TEAM, Inc. All Rights Reserved. ©Copyright 2018. TEAM, Inc. All Rights Reserved.

Industrial Services Spend by Industry Petroleum Refining and Chemical Processing industries are projected to increase from 2017 to 2018 $10.2B $9.9B $9.2B $8.6B Power is a potential area for greater market penetration by Team Notes: IIR data filtered to Mechanical Completion, Maintenance Programs, Long-Term Maintenance, and Scheduled Maintenance Dollars in Billions Source: Market data from 2015-2019 IIR Data, A&M Analysis Driving Execution Excellence 21 ©Copyright 2018. TEAM, Inc. All Rights Reserved. ©Copyright 2018. TEAM, Inc. All Rights Reserved.
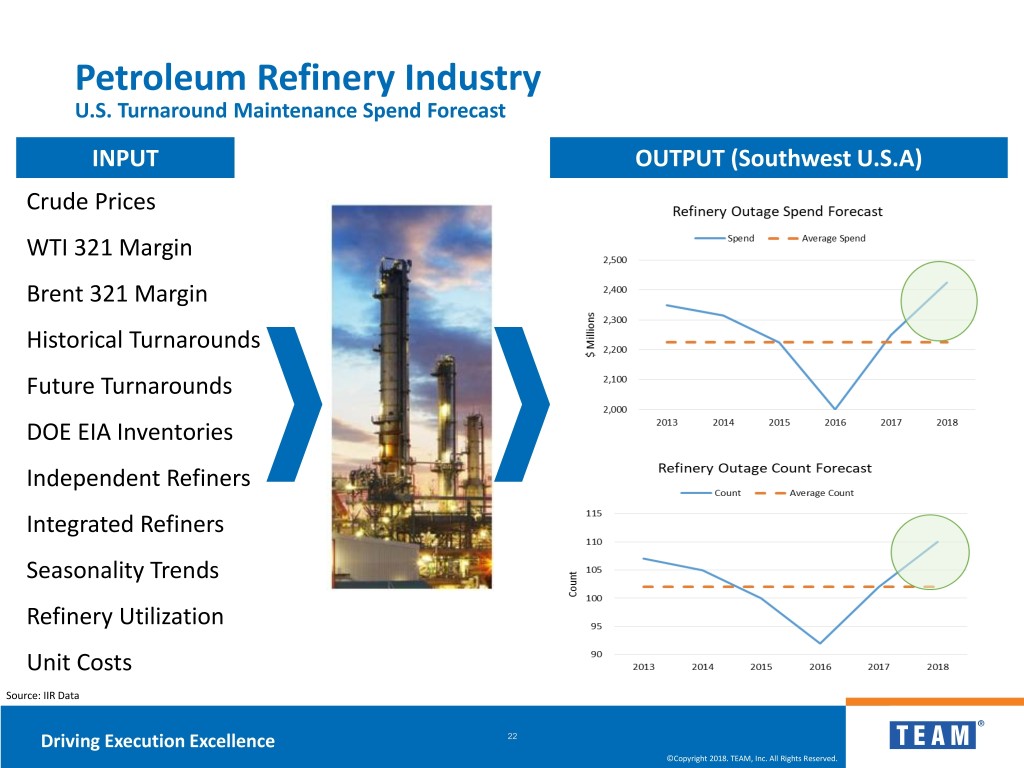
Petroleum Refinery Industry U.S. Turnaround Maintenance Spend Forecast INPUT OUTPUT (Southwest U.S.A) Crude Prices WTI 321 Margin Brent 321 Margin Historical Turnarounds Future Turnarounds DOE EIA Inventories Independent Refiners Integrated Refiners Seasonality Trends Refinery Utilization Unit Costs Source: IIR Data Driving Execution Excellence 22 ©Copyright 2018. TEAM, Inc. All Rights Reserved. ©Copyright 2018. TEAM, Inc. All Rights Reserved.

Long Standing Blue Chip Customers 2017 Revenue 10% $1.2 Billion 20% Driving Execution Excellence 23 ©Copyright 2018. TEAM, Inc. All Rights Reserved. ©Copyright 2018. TEAM, Inc. All Rights Reserved.

Agenda + 7,300+ highly trained and experienced specialty Who We Are technicians delivering services locally through 200+ locations + Provider of inspection and assessment, What We Do turnaround, and on-stream services for ~45 years + Diverse customer base across several large Market Dynamics industrial markets + Companywide top-to-bottom integration and OneTEAM transformational change initiative platform Financial Highlights Driving Execution Excellence 24 ©Copyright 2018. TEAM, Inc. All Rights Reserved. ©Copyright 2018. TEAM, Inc. All Rights Reserved.

OneTEAM Introduction + What is OneTEAM? – A transformational change effort identified by TEAM leadership focused on: + Revenue Enhancement + Operations Improvement + Center-Led Functions Cost Improvement – Development and implementation of processes, standards, and training – Enables greater coordination, cost-optimization, collaboration, and communication within and across segments – Ongoing program that began in Q1 2018 and is planned through first half of 2019 +2018 will be focused on repositioning the company for accelerated, profitable growth – Continues to build our premier position and reputation for safety, quality and shareholder returns Driving Execution Excellence 25 ©Copyright 2018. TEAM, Inc. All Rights Reserved. ©Copyright 2018. TEAM, Inc. All Rights Reserved.
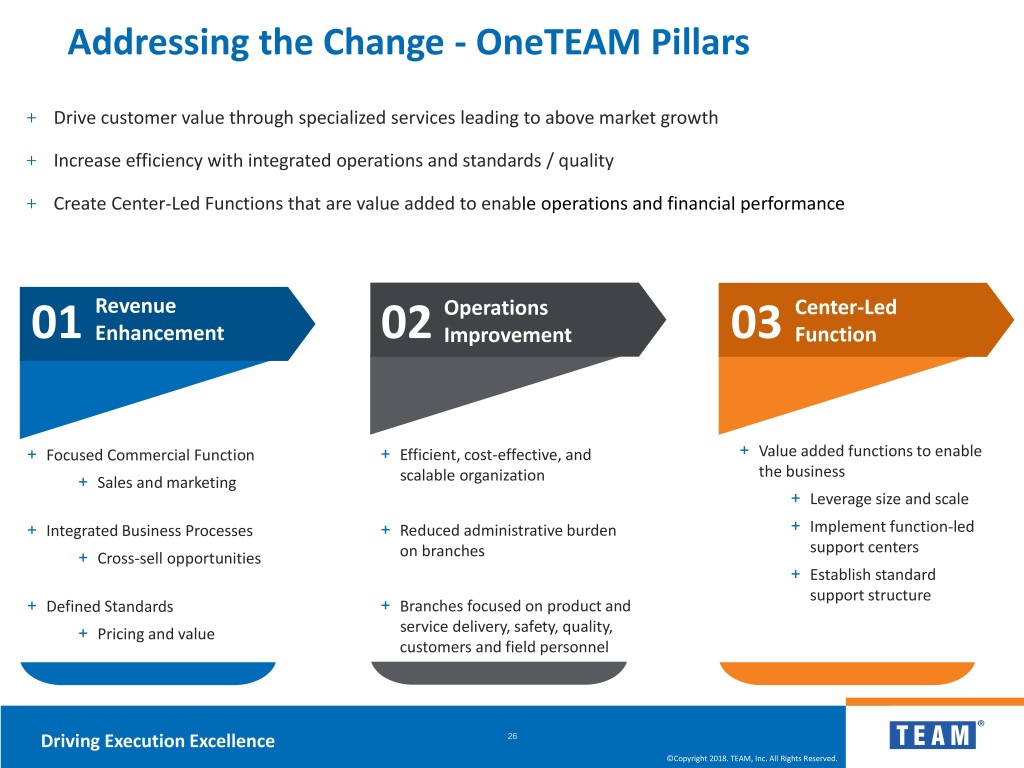
Addressing the Change - OneTEAM Pillars + Drive customer value through specialized services leading to above market growth + Increase efficiency with integrated operations and standards / quality + Create Center-Led Functions that are value added to enable operations and financial performance Revenue Operations Center-Led 01 Enhancement 02 Improvement 03 Function + Focused Commercial Function + Efficient, cost-effective, and + Value added functions to enable the business + Sales and marketing scalable organization + Leverage size and scale + Integrated Business Processes + Reduced administrative burden + Implement function-led support centers + Cross-sell opportunities on branches + Establish standard support structure + Defined Standards + Branches focused on product and + Pricing and value service delivery, safety, quality, customers and field personnel Driving Execution Excellence 26 ©Copyright 2018. TEAM, Inc. All Rights Reserved. ©Copyright 2018. TEAM, Inc. All Rights Reserved.

Agenda + 7,300+ highly trained and experienced specialty Who We Are technicians delivering services locally through 200+ locations + Provider of inspection and assessment, What We Do turnaround, and on-stream services for ~45 years + Diverse customer base across several large Market Dynamics industrial markets + Companywide top-to-bottom integration and OneTEAM transformational change initiative platform + Highest Q3 revenues since Qualspec and Financial Highlights Furmanite acquisitions Driving Execution Excellence 27 ©Copyright 2018. TEAM, Inc. All Rights Reserved. ©Copyright 2018. TEAM, Inc. All Rights Reserved.

Financial Highlights + Q3 2018 – highest Quarter 3 Revenues since the Qualspec and Furmanite acquisitions – Inspection & Heat Treating + Consistently delivered 6% year over year Revenue growth over the last 3 quarters + Q3 2018 adjusted EBITDA margin increased to 9.5% compared to 7.7% in Q3 2017 Mechanical Services – Mechanical Services + Improved year to date in 2018 but experienced a decline in Q3 2018 on project deferrals and higher US refinery utilization rates – Quest Integrity + Q3 2018 revenues increased 53% over Q3 2017 + On pace for back to back years of record annual revenues NYSE: TISI Inspection & Heat Treating + OneTEAM program generated $5.4 million of savings in Q3 2018 and is on pace to deliver $8-$10 million in second half of 2018 + Cash Flow Asset Integrity – Q3 2018 operating cash flow of $23 million represents the highest quarterly operating & Reliability cash flow generated since 2015 – Generated $16 million of free cash flow to close out Q3 2018 – Repaid $15 million of outstanding debt in Q3 2018 Adjusted EBITDA and Free Cash Flow reconciliation provided in Appendix Driving Execution Excellence 28 ©Copyright 2018. TEAM, Inc. All Rights Reserved. ©Copyright 2018. TEAM, Inc. All Rights Reserved.

Long History of Organic Growth and Strategic Acquisitions ($ in millions) Acquired Furmanite $1,600 ~15% CAGR for (February 2016) 2006 - 2017 $1,400 Acquired Qualspec (July 2015) $1,197 $1,200 $1,200 Acquired Quest Integrity (Nov 2010) $1,000 $926 $813 $800 $714 $624 $600 $545 $479 $498 $508 $400 $318 $260 $200 $0 2006 2007 2008 2009 2010 2011 2012 2013 2014 2015 2016 2017 Driving Execution Excellence 29 ©Copyright 2018. TEAM, Inc. All Rights Reserved. ©Copyright 2018. TEAM, Inc. All Rights Reserved.

Balance Sheet Data ($ in millions) Dec-16 Sep-17 Dec-17 Mar-18 Jun-18 Sep-18 Bank Credit Facility Debt $ 367 $ 163 $ 178 $ 176 $ 198 $ 183 Letter of Credit Outstanding $ 22 $ 23 $ 22 $ 23 $ 22 $ 23 Total Sr. Secured Debt $ 389 $ 186 $ 200 $ 199 $ 220 $ 206 Convertible Senior Notes Due 2023 1 $ - $ 230 $ 230 $ 230 $ 230 $ 230 Total Unsecured Debt $ - $ 230 $ 230 $ 230 $ 230 $ 230 Total Debt $ 389 $ 416 $ 430 $ 429 $ 450 $ 436 LTM Interest Total Cash Interest $ 12 $ 16 $ 19 $ 22 $ 23 $ 24 LTM Adj. EBITDA Adj. EBITDA (reported) $ 86 $ 50 $ 53 $ 56 $ 71 $ 71 Adj. EBITDA (covenant calculation) $ 93 $ 50 $ 57 $ 61 $ 75 $ 76 LTM Credit Statistics Senior Secured Debt / Adj. EBITDA 4.2x 3.7x 3.5x 3.3x 3.0x 2.7x Total Debt / Adj. EBITDA 4.2x 8.3x 7.6x 7.1x 6.0x 5.8x Available Borrowing Capacity Under Credit Facility $ 29 $ 51 $ 41 $ 60 $ 80 $ 58 Interest Coverage Ratio (Cash Basis) 7.6x 3.2x 3.0x 2.8x 3.2x 3.1x LTM = Last 12 Months (1) Does not reflect unamortized discount, issuance costs and embedded derivative Note: Non-GAAP items reconciliation provided in the Appendix section Driving Execution Excellence 30 ©Copyright 2018. TEAM, Inc. All Rights Reserved. ©Copyright 2018. TEAM, Inc. All Rights Reserved.

Revenues and Adjusted EBITDA (in thousands) Three Months Ended Nine Months Ended September 30, September 30, 2018 2017 2018 2017 Revenues IHT 147,529 138,383 467,621 439,751 MS 119,011 130,768 400,890 385,154 Quest Integrity 24,316 15,916 68,619 58,972 290,856 285,067 937,130 883,877 Operating Income (loss) ("EBIT") IHT 8,754 (17,515) 28,775 1,139 MS (9,086) (51,154) 4,014 (45,318) Quest Integrity 5,255 (828) 12,100 7,252 Corporate (24,617) (24,619) (76,909) (75,970) (19,694) (94,116) (32,020) (112,897) Adjusted EBIT IHT 9,400 5,792 30,437 23,272 MS (8,659) 5,021 5,279 9,807 Quest Integrity 5,262 (404) 12,140 7,676 Corporate (17,250) (17,543) (58,253) (56,115) (11,247) (7,134) (10,397) (15,360) Adjusted EBITDA IHT 14,049 10,598 44,616 37,794 MS 252 10,402 32,412 26,848 Quest Integrity 6,287 661 15,130 11,106 Corporate (13,395) (14,541) (44,675) (46,576) 7,193 7,120 47,483 29,172 Note: Non-GAAP items reconciliation provided in the Appendix section Driving Execution Excellence 31 ©Copyright 2018. TEAM, Inc. All Rights Reserved. ©Copyright 2018. TEAM, Inc. All Rights Reserved.

Key Performance Objectives for 2018 + TEAM is well positioned to benefit from overall market growth by leveraging our strengths: our people, technology, size & scale and our blue-chip client base + Strengthen our leadership position and reputation for safety, quality, and shareholder returns Safety Performance Revenue Growth Driving Execution Business Unit, Region & Branch Profitability Excellence Enterprise Profitability Cash Generation Driving Execution Excellence 32 ©Copyright 2018. TEAM, Inc. All Rights Reserved. ©Copyright 2018. TEAM, Inc. All Rights Reserved.

Investment Consideration 1 Premier provider of Maintenance and Inspection Services Long-standing 5 Poised for Diversified, 2 Growth Blue Chip Customer Base Deep Domain Driving Expertise 4 Execution Driving 3 Excellence Technology Advantage Driving Execution Excellence 33 ©Copyright 2018. TEAM, Inc. All Rights Reserved. ©Copyright 2018. TEAM, Inc. All Rights Reserved.
Investor Relations +1 281.388.5500 | IR@teaminc.com 13131 Dairy Ashford, Suite 600 | Sugar Land, Texas 77478 ©Copyright 2018. TEAM, Inc. All Rights Reserved.
Appendix Supplemental Financial Information

Non-GAAP Financial Measures (Unaudited) The Company uses supplemental non-GAAP financial measures which are derived from the consolidated financial information including adjusted net income (loss); adjusted net income (loss) per share, earnings before interest and taxes ("EBIT"); adjusted EBIT (defined below); adjusted earnings before interest, taxes, depreciation and amortization ("adjusted EBITDA") and free cash flow to supplement financial information presented on a GAAP basis. Adjusted net income (loss) and adjusted net income (loss) per diluted share, each as defined by the Company, exclude the following items from net income (loss): costs associated with our OneTEAM transformation program, acquisition costs associated with business combinations, legal costs associated with Quest Integrity patent defense litigation, professional fees for acquired business integration, gains (losses) on the revaluation of contingent consideration, restructuring and other related charges (credits), executive severance/transition costs, non- capitalized ERP implementation costs, gains (losses) on our convertible debt embedded derivative, and certain other items that management does not believe are indicative of core operating activities and the related income tax impacts. We also exclude the income tax impacts of certain special income tax items including certain changes to valuation allowances and the effects of certain tax legislation changes. The identification of these special tax items is judgmental in nature, and their calculation is based on various assumptions and estimates. EBIT, as defined by the Company, excludes income tax expense (benefit), interest charges and items of other (income) expense and therefore is equal to operating income (loss) reported in accordance with GAAP. Adjusted EBIT further excludes the following items: costs associated with our OneTEAM transformation program, acquisition costs associated with business combinations, legal costs associated with Quest Integrity patent defense litigation, professional fees for acquired business integration, gains (losses) on the revaluation of contingent consideration, restructuring and other related charges (credits), executive severance/transition costs, non-capitalized ERP implementation costs and certain other items that management does not believe are indicative of core operating activities. Adjusted EBITDA further excludes from adjusted EBIT depreciation, amortization and non-cash share based compensation costs. Free cash flow is defined as net cash provided by (used in) operating activities minus capital expenditures. Management believes that excluding certain items from GAAP results allows management to better understand the consolidated financial performance from period to period and to better identify operating trends that may not otherwise be apparent. Moreover, the Company believes these non-GAAP financial measures will provide its stakeholders with useful information to help them evaluate operating performance. However, there are limitations to the use of the non-GAAP financial measures presented in this report. The Company's non-GAAP financial measures may not be comparable to similarly titled measures of other companies who may calculate non-GAAP financial measures differently than Team does, limiting the usefulness of those measures for comparative purposes. The liquidity measure of free cash flow does not represent a precise calculation of residual cash flow available for discretionary expenditures. The non-GAAP financial measures are not meant to be considered as indicators of performance in isolation from or as a substitute for net income (loss) as a measure of operating performance or to cash flows from operating activities as a measure of liquidity, prepared in accordance with GAAP, and should be read only in conjunction with financial information presented on a GAAP basis. Reconciliations of each non-GAAP financial measure to its most directly comparable GAAP financial measure are presented below. You are encouraged to review the reconciliations in conjunction with the presentation of the non-GAAP financial measures for each of the periods presented. Segments names – Inspection & Heat Treating was previously referred to as TeamQualspec and Mechanical Services was previously referred to as TeamFurmanite Driving Execution Excellence 36 ©Copyright 2018. TEAM, Inc. All Rights Reserved. ©Copyright 2018. TEAM, Inc. All Rights Reserved.

Revenue Reconciliation $(000's) Reported FRM Total FY2016 Jan-Feb 2016 FY 2016 Inspection & Heat Treating 589 1 590 Mechanical Services 540 43 582 Quest Integrity 68 - 68 Total 1,197 44 1,240 Source: Company disclosures. Furmanite acquired in March 2016 hence prior 2 months shown to obtain a Reported + Acquired Revenue figure Driving Execution Excellence 37 ©Copyright 2018. TEAM, Inc. All Rights Reserved. ©Copyright 2018. TEAM, Inc. All Rights Reserved.

Adjusted EBITDA and Free Cash Flow Reconciliation (in thousands) Driving Execution Excellence 38 ©Copyright 2018. TEAM, Inc. All Rights Reserved. ©Copyright 2018. TEAM, Inc. All Rights Reserved.

Adjusted EBITDA Reconciliation by Segment (in thousands) Driving Execution Excellence 39 ©Copyright 2018. TEAM, Inc. All Rights Reserved. ©Copyright 2018. TEAM, Inc. All Rights Reserved.
