Attached files
| file | filename |
|---|---|
| 8-K - FORM 8-K - SB ONE BANCORP | tv506518_8k.htm |
Exhibit 99.1

Sandler O’Neill + Partners Investor Presentation November 7, 2018

2 Agenda • Financial Performance • Growth in Shareholder Value • Strategic Vision • Company and Market Overview

This presentation, and the oral presentation that supplements it, have been developed by SB One Bancorp (“SB One” or the “Com pan y”), and are not an offer or the solicitation of an offer to buy securities. Neither this presentation, nor the oral presentation that su pplements it, nor any of their contents, may be used, reproduced, disseminated, quoted or referred to for any other purpose, in whole or in par t, without the prior written consent of the Company. Some of the statements contained in this presentation are “forward - looking statements” within the meaning of Section 27A of the Securities Act of 1933, as amended, and Section 21E of the Securities Exchange Act of 1934, as amended. When used in this presentation, wor ds such as “may,” “plan,” “contemplate,” “anticipate,” “believe,” “intend,” “continue,” “expect,” “project,” “predict,” “estimate,” “ tar get,” “could,” “is likely,” “should,” “would,” “will,” or similar expressions are intended to identify “forward - looking statements” within the meaning of the Private Securities Litigation Reform Act of 1995. You are cautioned not to place undue reliance on any forward - looking statement s, which speak only as of the date made. These statements may relate to the Company’s future financial performance, strategic plans o r o bjectives, revenue, expense or earnings projections, or other financial items. By their nature, these statements are subject to numerou s u ncertainties that could cause actual results to differ materially from those anticipated in the statements. Factors that may cause actual results to differ materially from those contemplated by such forward - looking statements include, a mong others, changes to interest rates, the ability to control costs and expenses, general economic conditions, the success of the Co mpany’s efforts to diversify its revenue base by developing additional sources of non - interest income while continuing to manage its existing fe e - based business, risks associated with the quality of the Company’s assets and the ability of its borrowers to comply with repayment te rms, the inability to realize expected cost savings or to implement integration plans and other adverse consequences associated with t he acquisition of Community Bank of Bergen County, NJ (“Community Bank”), the inability to retain Community Bank’s customers, the risk that the businesses of Community Bank and the Bank may not be combined successfully or may take longer than expected, the diversion of management’s time on issues relating to integration of Community Bank, governmental approvals of the merger with Enterprise B ank N.J. (“Enterprise Bank”) may not be obtained, or adverse regulatory conditions may be imposed in connection with governmental appr ova ls of the merger, and the stockholders of Enterprise Bank may fail to approve the merger. Further information about these and other re levant risks and uncertainties may be found in the Company’s Annual Report on Form 10 - K for the fiscal year ended December 31, 2017 and in subsequent filings with the Securities and Exchange Commission. The Company undertakes no obligation to publicly release the res ults of any revisions to those forward looking statements that may be made to reflect events or circumstances after this date or to refle ct the occurrence of unanticipated events. 3 FORWARD - LOOKING STATEMENTS

Company and Market Overview

Coming Soon 2010 5 Our Evolution Acquired Tri - State Insurance Founded • Acquisition of Community Bank of Bergen County Opened Banking Center in Queens County, NY First M&A 1975 2001 New Executive Leadership Team 2013 • Rights Offering ($7MM) • Closed Warwick Banking Center 2015 2016 • Opened Banking Center in Bergen County, NJ • Closed Port Jervis Banking Center 2017 1Q 2018 Corporate Rebrand Capital Raise ($28MM) • Sussex Bank and Tri - State 2Q 2018 – 1Q 2019 • Acquisition of Enterprise Bank • Branch Opening in Weehawken, NJ (Hudson County)

□ Operating in one of the most desirable and competitive MSAs* (NY/NJ) in the US □ New York and New Jersey are some of the most densely populated and attractive markets in the US 6 * Source: SNL Company Overview □ $1.5 Billion in Total Assets □ $1.2 billion in net loans □ $1.1 billion in total deposits □ 14 Branch Locations □ Corporate offices in Rockaway and Rochelle Park □ Regional Lending Offices in Sussex, Bergen and Morris Counties, NJ & Queens, NYC Coming soon: Weehawken, NJ (Hudson County) □ NASDAQ: SBBX* □ 12/31/2009: $11MM □ 11/02/2018: $191MM As at 09 - 30 - 2018 Market Capitalization
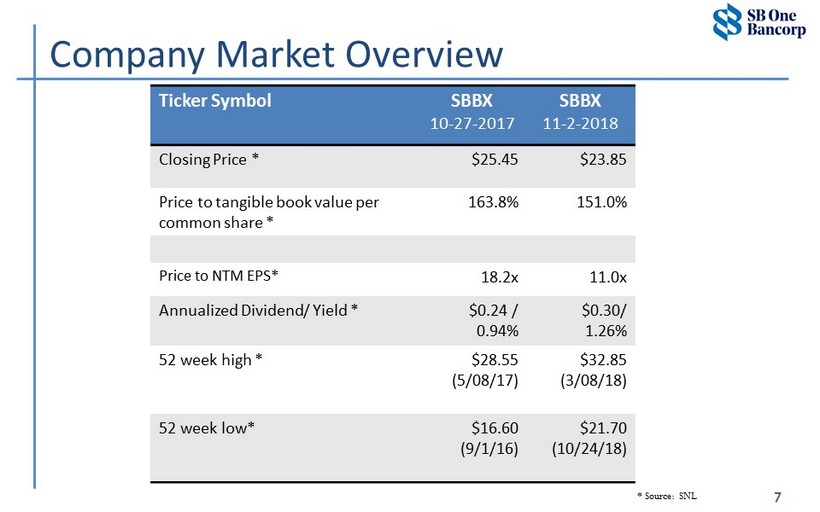
7 * Source: SNL Company Market Overview Ticker Symbol SBBX 10 - 27 - 2017 SBBX 11 - 2 - 2018 Closing Price * $25.45 $23.85 Price to tangible book value per common share * 163.8% 151.0% Price to NTM EPS* 18.2x 11.0x Annualized Dividend/ Yield * $0.24 / 0.94% $0.30/ 1.26% 52 week high * $28.55 (5/08/17) $32.85 (3/08/18) 52 week low* $16.60 (9/1/16) $21.70 (10/24/18)
Strategic Vision

Target High Performing Peer Median (a) Total Assets $3.0 - $5.0 billion in assets $2.3 billion (average) $1.8 billion (median) ROA 1.15% or better 1.26% ROE >13.5% 11.83% NPAs / Assets <1.00% 0.79% Annual EPS growth Double digit N/A We strive to be a high performing business bank that serves northern NJ and the NY Metro Region 9 (a) Source: SNL - High Performing Peers (Banks and Thrifts Assets between $1.0 bill to $5.5 bill and ROAA >0.75% at 6/30/18 Strategic Vision
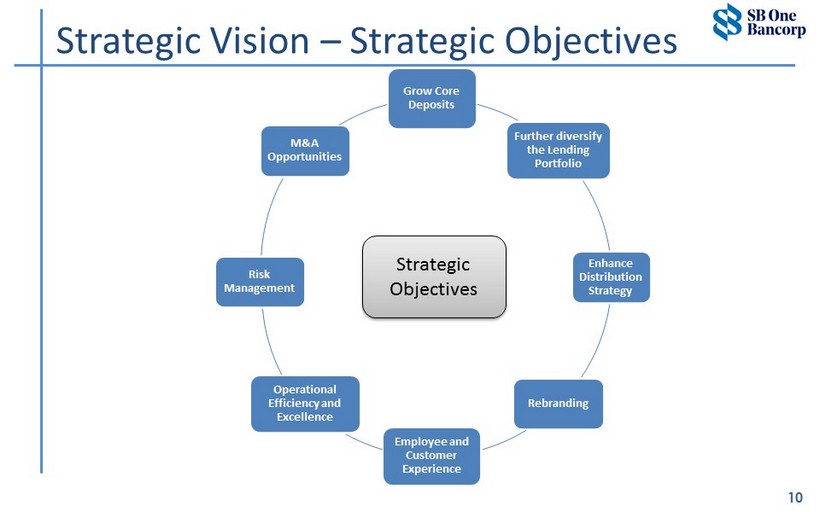
10 Strategic Vision – Strategic Objectives Grow Core Deposits Further diversify the Lending Portfolio Enhance Distribution Strategy Rebranding Employee and Customer Experience Operational Efficiency and Excellence Risk Management M&A Opportunities Strategic Objectives
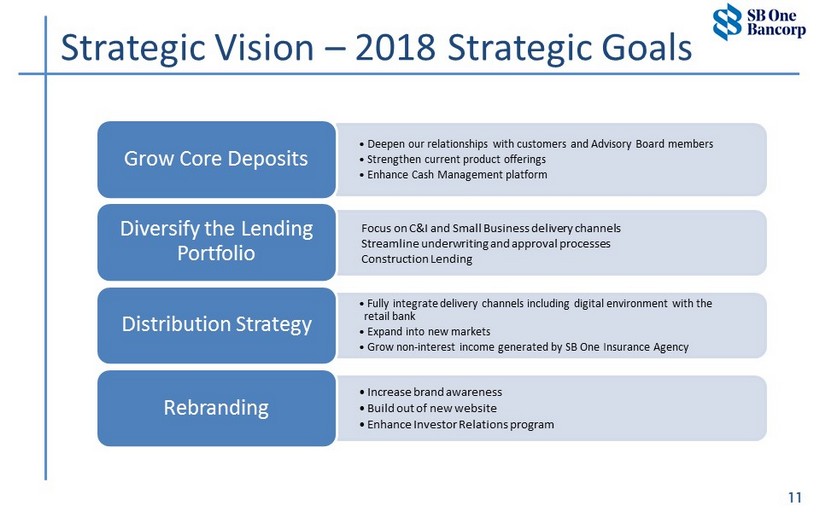
11 • Deepen our relationships with customers and Advisory Board members • Strengthen current product offerings • Enhance Cash Management platform Grow Core Deposits Focus on C&I and Small Business delivery channels Streamline underwriting and approval processes Construction Lending Diversify the Lending Portfolio • Fully integrate delivery channels including digital environment with the retail bank • Expand into new markets • Grow non - interest income generated by SB One Insurance Agency Distribution Strategy • Increase brand awareness • Build out of new website • Enhance Investor Relations program Rebranding Strategic Vision – 2018 Strategic Goals
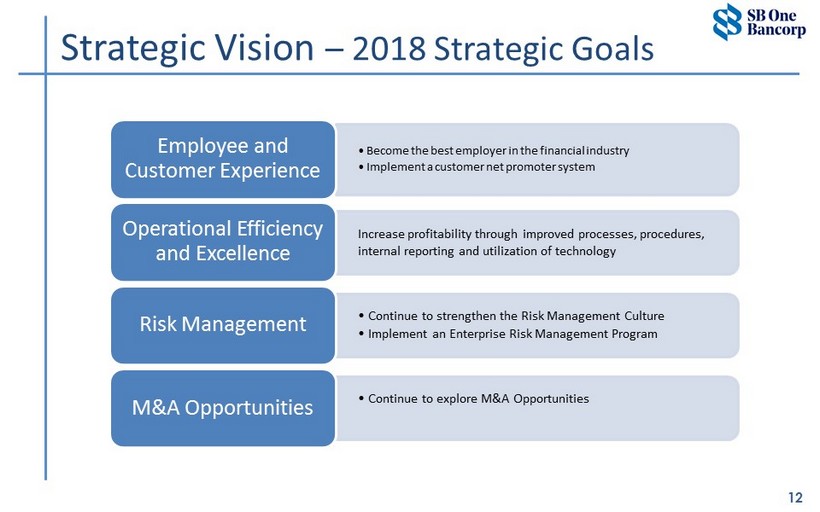
12 • Become the best employer in the financial industry • Implement a customer net promoter system Employee and Customer Experience Increase profitability through improved processes, procedures, internal reporting and utilization of technology Operational Efficiency and Excellence • Continue to strengthen the Risk Management Culture • Implement an Enterprise Risk Management Program Risk Management • Continue to explore M&A Opportunities M&A Opportunities Strategic Vision – 2018 Strategic Goals

13 Strategic Vision – Market Expansion SBBX Corporate / Regional Commercial Lending Office Potential banking center markets x Through expansion into desired markets and M&A activity we continue to grow core deposit relationships to fund assets and create franchise value. . . Weehawken, anticipated opening 1Q2019
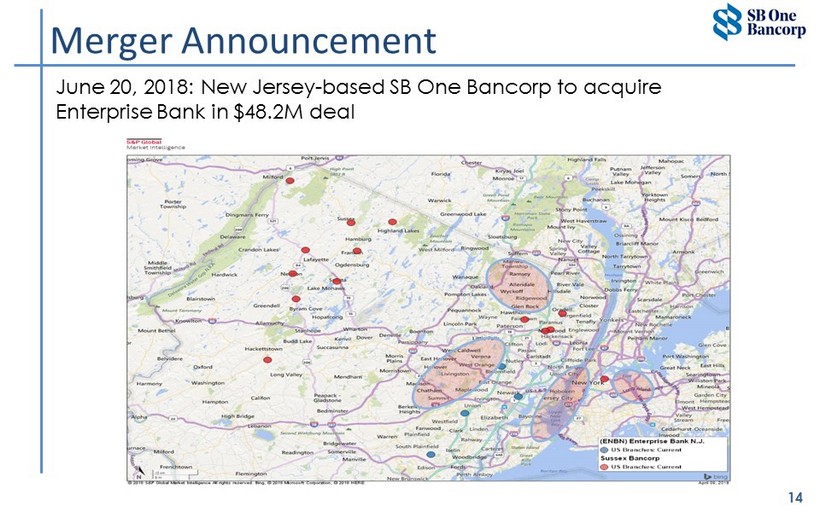
14 Merger Announcement June 20, 2018: New Jersey - based SB One Bancorp to acquire Enterprise Bank in $48.2M deal

15 ▪ Combined company will have approximately $1.7 billion in assets, $1.4 billion in gross loans, and $1.3 billion in deposits (as of September 30, 2018) o At September 30, 2018; Enterprise Bank $277 million of total assets, $265 million of loans and $192 million of deposits. ▪ Each share of ENBN common stock exchanged for 0.4538 shares of SBBX common stock. ▪ At announcement date (June 20, 2018), deal valued at $48.2 million, or approximately $13.69 per ENBN share. ▪ Accretive to 2019 earnings per share by approximately 8% and 1% dilutive to tangible book value per share. o Projected earn back of less than one year ▪ Expect 30% in annual cost savings ▪ Donald J. Haake - Senior Executive Vice President, Regional Banking of SB One Bank ▪ Two members of the Board of Directors of Enterprise Bank will join the Board of Directors of both SB One Bancorp and SB One Bank ▪ Expect closing in December of 2018 and systems integration in February 2019 Merger Announcement
Financial Performance

2017 and 3Q 2018 Highlights 17 □ Raised $28 million in common stock offering in June of 2017, issuing 1.25 million shares RECORD EARNINGS □ Issued $15 million in fixed - to - floating rate subordinated notes due 2026 in Dec ’16. FY ’17 included the full year absorption of $860,000 in interest expense CAPITAL □ Merger between SB One Bank and Community Bank completed January 4, 2018; □ Full systems and staff integration successfully completed March 26, 2018 □ Total Assets grew from $979 million (12/31/17) to approximately $1.45 billion (9/30/18) □ Merger between SB One Bank and Enterprise Bank anticipated Q4 2018 (expect full integration in Q1 2019) M&A ACTIVITY □ Record earnings for FY ’17 of $7.7 million, excluding M&A and Capital Raise costs □ FY ’17 vs. FY ’16 ▪ Net Loans: +18% ▪ Deposits : +15% ▪ Insurance: +18% □ Record earnings for the first 9 months of 2018 of $10.9 million, excluding merger related and rebranding costs □ 3Q 2018 vs. 1/4/2018 (Community Bank Merger) ▪ Net Loans: +14% ▪ Deposits : +6% ▪ Insurance: +29%

$430 $458 $518 $661 $762 $1,115 FY-13 FY-14 FY-15 FY-16 FY-17 Sep-18 18 Performance Trends - Deposits Deposits ($ in millions) » Deposit growth of $50.9MM, or 6% » Non - interest bearing demand growth of 16% 3Q 2018 vs. 1/4/2018* +15% * Community Bank Merger

21% 24% 10% 21% 25% Demand, non-interest bearing NOW Money market Savings Time 19 Performance Trends – Deposit Mix » Wholesale Deposits ▪ Money Market: $92.5MM at 2.32% ▪ CDs: $80.9MM at 2.11% ▪ Avg Term of 10.5 months remaining » Betas ▪ Retail Deposits ▪ Since 12/31/16: 19% (Fed Funds rate increases totaling 1.75%) ▪ Since 12/31/17: 33% (Fed Funds rate increases totaling 0.75%) ▪ Wholesale Funding ▪ Since 12/31/16: 50.5% ▪ Since 12/31/17: 104.7% ▪ During 2Q and 3Q 2018, executed $75MM of interest rate hedges (2.89% for 3.5 years) Deposit Mix, 12 - 31 - 2017 19% 25% 13% 19% 24% Demand, non-interest bearing NOW Money market Savings Time Deposit Mix, 9 - 30 - 2018 Overall cost of deposits 0.88%, Retail only 0.63% Overall cost of deposits 0.48%, Retail only 0.38%

20 Building of Franchise Value De novo Banking Centers – Weehawken NJ (Hudson County) [Opening 1Q19] • Deposit market of over $3 billion (average branch size >$75 million) within a 4 mile radius – Future locations in Morris County NJ and Long Island NY Existing Banking Centers (full service) – Sussex County (8 locations / $459.1 million in deposits) • Stable mature market with strong core funding costs – Bergen County (4 locations / $390.4 million in deposits) • Average banking center size of $100 million – Queens County (1 location / $68.9 million in deposits) • Strong core deposits • Non - interest bearing demand represents 57% of total deposits – Enterprise Bank (4 locations / $192 million in deposits) • Over $16 billion in deposit market within 2 miles of each of their branch locations Future Growth of Deposits

21 Building of Franchise Value x New leadership x Provide superior customer experience “digitally” through personal interactions x Omni - channel delivery model ▪ Supporting mobile and on - line banking x Investing and enhancing the current overall technology structure and platform x Scalable and efficient x Customer and revenue focused Digital Banking & Technology Platform
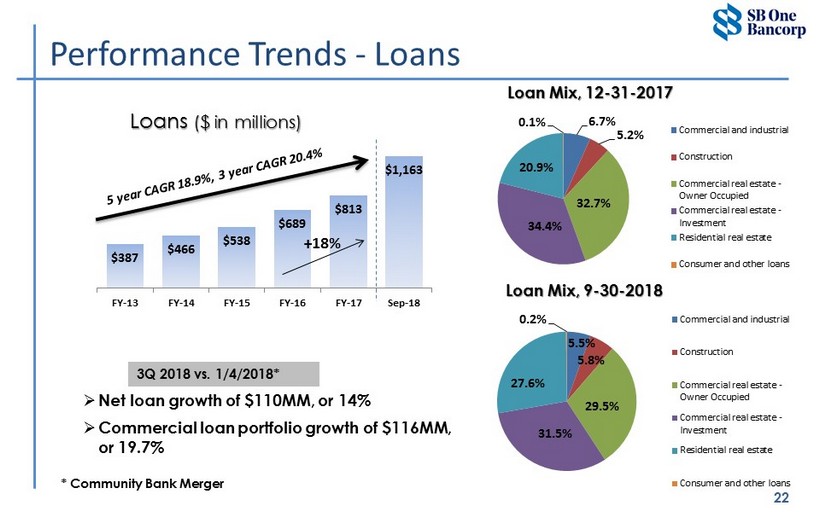
$387 $466 $538 $689 $813 $1,163 FY-13 FY-14 FY-15 FY-16 FY-17 Sep-18 22 Performance Trends - Loans Loans ($ in millions) » Net loan growth of $110MM, or 14% » Commercial loan portfolio growth of $116MM, or 19.7% 3Q 2018 vs. 1/4/2018* +18% * Community Bank Merger 6.7% 5.2% 32.7% 34.4% 20.9% 0.1% Commercial and industrial Construction Commercial real estate - Owner Occupied Commercial real estate - Investment Residential real estate Consumer and other loans Loan Mix, 12 - 31 - 2017 Loan Mix, 9 - 30 - 2018 5.5% 5.8% 29.5% 31.5% 27.6% 0.2% Commercial and industrial Construction Commercial real estate - Owner Occupied Commercial real estate - Investment Residential real estate Consumer and other loans

PA 1% NJ 54% NY 45% • Net funded $353 million (balances at September 30, 2018) o Associated unfunded commitments +$69.3 million (total exposure $422 million) • Weighted average rate: 4.44% • Weighted average term: 4.9 yrs. Other CML NBV 81% Top 20 NBV 19% 23 Commercial Loans Originated in 2017 and YTD ’18 Rate: 4.28% Term: 5.6 yrs. Avg Bal: $5.7M DSCR: 1.44x LTV: <55% Rate: 4.51% Term: 4.5 yrs. Avg. Bal: $539k Geographical distribution of Originations

24 Credit Risk Management Concentration Risk Management – CRE concentration ratio 329% – Focused on organic growth – Geographically diversified CRE Geographical Concentrations (9 - 30 - 2018) Non - performing Assets ($24.4MM) – Top two NPAs ($9MM, or 37% of total) • Both are CRE loans (one in NY and the other in NJ) 1. NY loan expecting full recovery and resolution of $4.3MM within the next six months 2. NJ loan potentially longer resolution, however cashflow positive to support debt service and a < 65% LTV – Next top three NPAs ($3.5MM, or 14% of total) – NPAs resulting from Community Bank of Bergen County merger ($8.4MM) • Residential Mortgages ($4.6MM / $975M credit mark) • Commercial Loans ($6.4MM / $1.5MM credit mark)
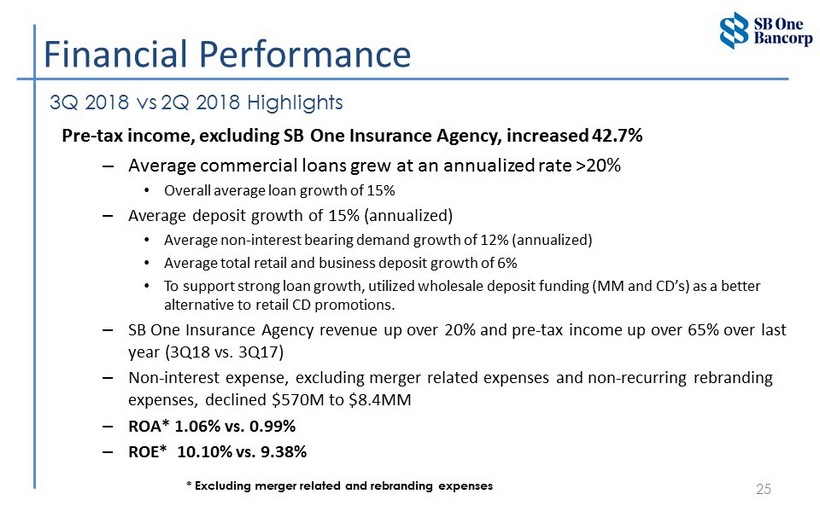
Pre - tax income, excluding SB One Insurance Agency, increased 42.7% – Average commercial loans grew at an annualized rate >20% • Overall average loan growth of 15% – Average deposit growth of 15% (annualized) • Average non - interest bearing demand growth of 12% (annualized) • Average total retail and business deposit growth of 6% • To support strong loan growth, utilized wholesale deposit funding (MM and CD’s) as a better alternative to retail CD promotions. – SB One Insurance Agency revenue up over 20% and pre - tax income up over 65% over last year (3Q18 vs. 3Q17) – Non - interest expense, excluding merger related expenses and non - recurring rebranding expenses, declined $570M to $8.4MM – ROA* 1.06% vs. 0.99% – ROE* 10.10% vs. 9.38% 25 Financial Performance 3Q 2018 vs 2Q 2018 Highlights * Excluding merger related and rebranding expenses

26 Financial Performance to Targets FY 2016 FY 2017 3Q 2018 (YTD) Targets NJ Banks and Thrifts Avg. (a) Loans, net annual growth 27.9% 18.1% 14.0% 15% to 20% 15.7% Deposit annual growth 27.6% 15.4% 6.40% 15% to 20% 14.9% NPAs to assets 1.10% 0.94% 1.67% <1.00% 0.97% ROA 0.72% 0.62% 0.84%* 0.72% 1.05%* 1.15% or better 0.93% ROE 9.60% 7.17% 9.71%* 6.84% 9.89%* > 13.5% 8.12% Net Interest Margin 3.37% 3.39% 3.42% 3.52% Net non - interest income (expense) as % of assets (1.92%) (1.90%) (1.77%)* (1.57%) (1.26%)* (1.80%) Insurance agency income before tax $1.2m (+79%) $1.4m (+18%) $1.8m (+29%) 20% N/A Diluted EPS $1.19 (+47%) $1.42 (+19%) $0.96 ($1.39)* Double digit N/A (a) Source: SNL - NJ Banks and Thrifts (38) 06/30/18 * Excludes merger related and rebranding expenses
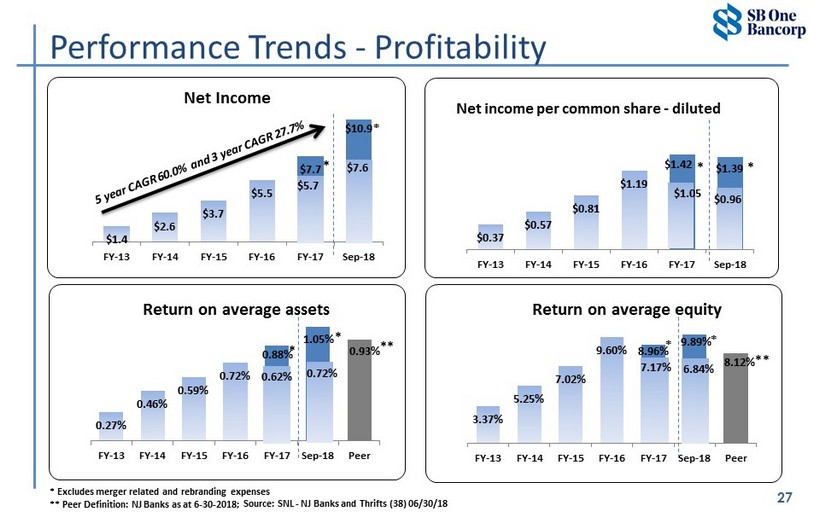
3.37% 5.25% 7.02% 9.60% 8.96% 9.89% 8.12% FY-13 FY-14 FY-15 FY-16 FY-17 Sep-18 Peer Return on average equity 7.17% 6.84% * * * * 0.27% 0.46% 0.59% 0.72% 0.88% 1.05% 0.93% FY-13 FY-14 FY-15 FY-16 FY-17 Sep-18 Peer Return on average assets 0.62% 0.72% * $0.37 $0.57 $0.81 $1.19 $1.42 $1.39 FY-13 FY-14 FY-15 FY-16 FY-17 Sep-18 Net income per common share - diluted $1.05 $0.96 * * $1.4 $2.6 $3.7 $5.5 $7.7 $10.9 FY-13 FY-14 FY-15 FY-16 FY-17 Sep-18 Net Income $5.7 $7.6 * * 27 Performance Trends - Profitability * Excludes merger related and rebranding expenses ** Peer Definition: NJ Banks as at 6 - 30 - 2018; * * * Source: SNL - NJ Banks and Thrifts (38) 06/30/18

80.89% 78.56% 77.47% 70.08% 68.54% 62.40% FY-13 FY-14 FY-15 FY-16 FY-17 Sep-18 Efficiency Ratio $438 $501 $670 $1,199 $1,413 $1,829 FY-13 FY-14 FY-15 FY-16 FY-17 Sep-18 Insurance Agency Income before Tax (in thousands) 28 Performance Trends - Profitability +29% 3.41% 3.49% 3.45% 3.37% 3.39% 3.42% FY-13 FY-14 FY-15 FY-16 FY-17 Sep-18 Net interest margin 1.15% 1.06% 1.03% 1.02% 0.91% 0.79% FY-13 FY-14 FY-15 FY-16 FY-17 Sep-18 Non Interest Income % of Average Assets * Excludes merger related and rebranding expenses * Sep - 18 represents for 9 months ended September 30, 2018

Growth in Shareholder Value

Stock Performance 3 Year Total Return 30 Source: SNL as of November 2, 2018 Growth in Shareholder Value

31 Source: SNL as of November 2, 2018 Stock Performance 5 Year Total Return Growth in Shareholder Value

$18.3 $36.2 $47.8 $60.8 $99.1 $162.2 $191.0 $5.38 $7.81 $10.25 $13.09 $20.90 $26.85 $23.85 FY-12 FY-13 FY-14 FY-15 FY-16 FY-17 Sep-18 Shareholder Value Market Cap Stock Price 177.5% 32 173.0% Source: SNL and internal data Growth in Shareholder Value 48.7% 119.0% 98.2% 82.9% SBBX Stock Price / Tangible Book Value per common share 151.0%

Appendix: Non - GAAP items

Income Statement Non - GAAP measures and ratios The following tables present a reconciliation of certain non-GAAP performance measures and ratios used by management to evaluate and measure our performance to the most directly comparable GAAP financial measures: (Dollars in thousands) 2018 (unaudited) Income Statement Non-GAAP measures and ratios Interest income (GAAP) Loans receivable, including fees $ 37,471 $ 32,953 $ 26,862 $ 21,497 $ 19,512 $ 18,007 Interest bearing deposits 69 35 23 9 11 16 Securities - taxable 2,476 1,437 1,443 1,239 854 603 Securities - tax-exempt 1,272 1,274 832 899 923 1,016 Total Interest Income (GAAP) 41,288 35,699 29,160 23,644 21,300 19,642 Tax equivalent adjustments Securities - tax-exempt 647 644 - - - - Total Tax equivalent adjustments 647 644 - - - - Interest income - tax equivalent Loans receivable, including fees $ 37,471 $ 32,953 $ 26,862 $ 21,497 $ 19,512 $ 18,007 Interest bearing deposits 69 35 23 9 11 16 Securities - taxable 2,476 1,437 1,443 1,239 854 603 Securities - tax-exempt 1,919 1,918 832 899 923 1,016 Total Interest income - tax equivalent 41,935 36,343 29,160 23,644 21,300 19,642 Total Interest Expense (GAAP) (8,542) (6,611) (4,762) (3,568) (3,294) (3,201) Tax-equivalent net interest income 33,393 29,732 24,398 20,076 18,006 16,441 Net interest income (GAAP) 32,746 29,088 24,398 20,076 18,006 16,441 Yields and costs Yield on securitites tax-exempt - tax equivalent 4.19% 4.13% 3.85% 4.00% 4.38% 4.99% Yield on interest earning assets - tax equivalent 4.29% 4.15% 4.02% 4.05% 4.11% 4.05% Cost of interest bearing liabilities (GAAP) 1.12% 0.96% 0.81% 0.74% 0.75% 0.75% Net Interest margin (GAAP) 3.35% 3.32% 3.31% 3.37% 3.41% 3.31% Net interest margin, tax equivalent basis 3.42% 3.39% 3.37% 3.45% 3.49% 3.41% As of and for the Year Ended December 31, 2017 As of and for the nine months ended September 30, 2016 2015 2014 2013

Balance Sheet Non - GAAP measures and ratios The following tables present a reconciliation of certain non-GAAP performance measures and ratios used by management to evaluate and measure our performance to the most directly comparable GAAP financial measures: (Dollars in thousands) 2018 (unaudited) Balance Sheet Non - GAAP measures and ratios Total assets $ 1,459,642 $ 979,383 $ 848,728 $ 684,503 $ 595,915 $ 533,911 Goodwill (25,987) (2,820) (2,820) (2,820) (2,820) (2,820) Tangible assets $ 1,433,655 $ 976,563 $ 845,908 $ 681,683 $ 593,095 $ 531,091 Common stockholders' equity $ 151,222 $ 94,193 $ 60,072 $ 53,941 $ 51,229 $ 46,425 Goodwill (25,987) (2,820) (2,820) (2,820) (2,820) (2,820) Tangible common 'equity $ 125,235 $ 91,373 $ 57,252 $ 51,121 $ 48,409 $ 43,605 Book value per common share $ 19.07 $ 15.59 $ 12.67 $ 11.61 $ 10.99 $ 10.03 Effect of intangible assets $ (3.28) $ (0.47) $ (0.59) $ (0.61) $ (0.60) $ (0.61) Tangible common equity per common share outstanding $ 15.79 $ 15.13 $ 12.08 $ 11.00 $ 10.38 $ 9.42 Equity to total assets 10.36% 9.62% 7.08% 7.88% 8.60% 8.70% Effect of intangible assets -1.62% -0.26% -0.31% -0.38% -0.43% -0.48% Tangible common equity to tangible assets 8.74% 9.36% 6.77% 7.50% 8.16% 8.21% As of and for the Year Ended December 31, 2017 As of and for the nine months ended September 30, 2016 2015 2014 2013

Merger and Rebrand Expenses Non - GAAP measures Net income (GAAP) $ 7,570 $ 5,178 Merger related expenses net of tax (1) 3,220 345 Non-recurring rebrand expenses net of tax (2) 152 - S-3 Registration filing expenses net of tax (1) - 45 Net income, as adjusted $ 10,942 $ 5,568 Average diluted shares outstanding (GAAP) 7,868,280 5,200,466 Average diluted shares from capital raise (3) - 462,454 Average diluted shares outstanding, as adjusted 7,868,280 4,738,012 Diluted EPS, as adjusted $ 1.39 $ 1.18 Return on average assets, as adjusted 1.05% 0.83% Return on average equity, as adjusted 9.89% 10.03% (3) Calculation is based on 1,249,999 common stock shares issued and outstanding as part of the capital raise completed on June 21, 2017 divided by the number of days in the period. Nine Months Ended September 30, (2) Non-recurring rebrand expenses net of tax expense of $54 thousand (1) Merger related expenses net of tax expenses $1.1 million YTD 2018 and $137 thousand YTD 2017; S-3 registration filing net of tax expenses of $30 thousand in 2017. 2018 2017
