Attached files
| file | filename |
|---|---|
| 8-K - 8-K - PACWEST BANCORP | a18-39642_18k.htm |
2018 Third Quarter Results Investor Presentation Filed by PacWest Bancorp pursuant to Rule 425 under the Securities Act of 1933 and deemed filed pursuant to Rule 14a-12 under the Securities Exchange Act of 1934 Subject Company: El Dorado Savings Bank, F.S.B. Commission File No.: 001-36408
This communication contains certain forward-looking information about PacWest, El Dorado Savings Bank (“El Dorado”), and the combined company after the close of the transaction that is intended to be covered by the safe harbor for “forward-looking statements” provided by the Private Securities Litigation Reform Act of 1995. Such statements include future financial and operating results, expectations, intentions and other statements that are not historical facts such as our future effective tax rate; our ability to complete the El Dorado transaction, including obtaining required regulatory approvals and approval by the stockholders of El Dorado, or any future transaction, successfully integrate such acquired entities, or achieve expected beneficial synergies and/or operating efficiencies, in each case within expected time-frames or at all; changes in our stock price before completion of the pending El Dorado acquisition, including as a result of the financial performance of the Company or El Dorado prior to closing; the reaction to the pending El Dorado acquisition of the companies’ customers, employees and counterparties; and the possibility that personnel changes/retention will not proceed as planned. Such statements are based on information available at the time of this communication and are based on current beliefs and expectations of the Company’s management and are subject to significant risks, uncertainties and contingencies, many of which are beyond our control. Actual results may differ materially from those set forth or implied in the forward-looking statements due to a variety of factors, including the risk factors described in documents filed by the Company with the Securities and Exchange Commission. We are under no obligation (and expressly disclaim any such obligation) to update or alter our forward-looking statements, whether as a result of new information, future events or otherwise, except as required by law. Forward-Looking Statements
Company Overview 4 Third Quarter Highlights 8 Investment Securities 13 Loans and Leases 15 Credit Quality 24 Deposits 28 Net Interest Margin 31 Controlled Expenses 36 Acquisitions 39 Strong Franchise Value 46 Non-GAAP Measurements 49 Presentation Index
Company Overview

We are a commercial bank focused on core deposit growth paired with national lending and venture banking platforms NASDAQ traded (PACW) with a market capitalization of $5.1 billion (1) Average daily trading volume of 1,088,258 shares over the last three months (1) Dividend: $2.40 per share, 5.91% yield (1); dividend increased 20% in 2Q18 5th largest publicly-traded bank headquartered in California with total assets of $24.8 billion, loans and leases of $17.2 billion and deposits of $17.9 billion at September 30, 2018 Profitable Growth Net earnings of $116.3 million, return on average assets (“ROAA”) of 1.89% and return on average tangible equity (“ROATE”) of 21.61% for 3Q18 Industry leading tax equivalent NIM of 4.99% for 3Q18 and 5.09% for YTD18 Loan and lease production of $1.32 billion for 3Q18 and $3.32 billion for YTD18 $15.5 billion of core deposits with cost of average total deposits of 46 bps for 3Q18 and 38 bps for YTD18 NPAs at 0.68% of total loans and leases and foreclosed assets for 3Q18 Efficiency ratio of 40.8 % for YTD18 Experienced acquirer with 29 bank and finance company acquisitions since 2000 Announced El Dorado Savings Bank acquisition on September 12, 2018. El Dorado will add approximately $2.2 billion in assets, $0.6 billion in loans and $2.0 billion in deposits. Closing expected in 1Q19. Analyst coverage: BMO Capital Markets, D.A. Davidson & Co., FIG Partners, JMP Securities, Keefe, Bruyette & Woods, Piper Jaffray, Raymond James, Sandler O’Neill & Partners, Stephens Inc., SunTrust Robinson Humphrey, Wedbush Morgan, Wells Fargo Securities (1) As of October 31, 2018 Company Overview
Business Model Community Banking National Lending Venture Banking Pacific Western Bank Attractive branch network with 74 full service branches in California Offers a full suite of deposit products and services, including on-line banking Focused on business lending products, including commercial real estate and tax-exempt Limited consumer loan offerings Borrower relationships generally include a deposit account Efficient deposit model with average Community Banking branch size of $156 million Diversified by loan and lease type, geography and industry Asset-Based Lending (ABL) Lender Finance & Timeshare, Equipment Financing, Premium Finance and General ABL Security Cash Flow Lending Commercial Real Estate General, Multifamily, SBA, Healthcare and Construction Focus on small to middle-market businesses Expertise in niche segments limits new competitors Borrower relationships may include deposit accounts and treasury services Five banking groups: Technology, Life Sciences, Equity Funds Group, Structured Finance, Specialty Finance Operates a single branch in Durham, NC with $6.3 billion in deposits Offices located in key innovative hubs across the United States Offers a comprehensive suite of financial services for venture-backed companies and their venture capital and private equity investors Provides comprehensive treasury management solutions, including credit cards and international-related products and services to clients Borrower relationships almost always include a deposit account Operates Square 1 Asset Management (registered investment advisor)
Source: SNL Financial and FactSet Research Systems; Market data as of September 28, 2018. Note: KBW Regional Bank Index (KRX) includes 50 institutions with a median market cap of $3.8 billion as of September 28, 2018; median weighted by market capitalization. Five Year Total Return
Third Quarter Highlights

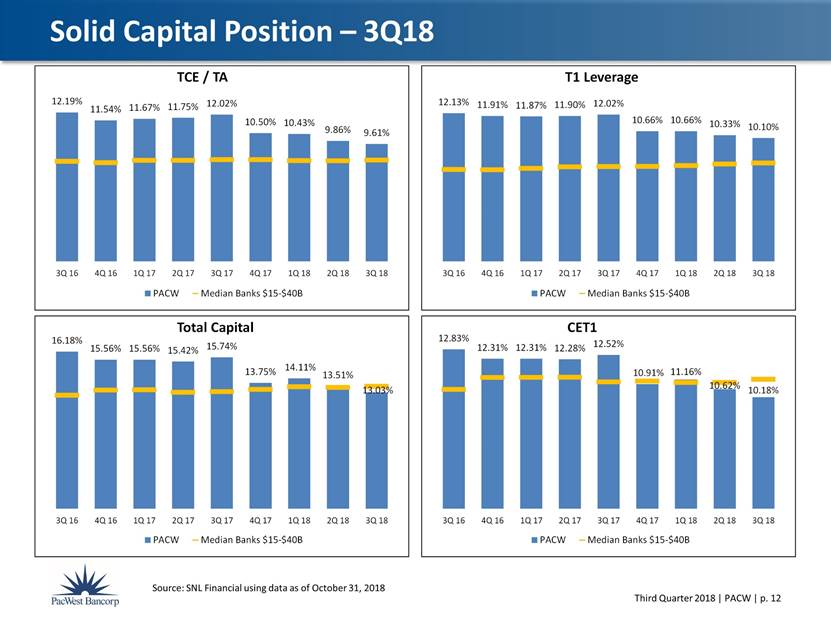
See “Non-GAAP Measurements” slides beginning on page 49. Third Quarter Highlights Robust Earnings Net earnings of $116.3 million EPS of $0.94 ROAA and ROATE of 1.89% and 21.61% (1) Industry Leading Net Interest Margin Tax equivalent NIM of 4.99% for 3Q18 and 5.09% YTD Tax equivalent yield on average loans and leases of 6.20% for 3Q18 and YTD Low Efficiency Ratio Efficiency ratio of 40.9% Average branch size of $238 million in deposits Noninterest expense to average assets of 2.09% Profitable Deposit Base Cost of average total deposits of 46bps for 3Q18 and 38bps YTD Core deposits steady at 87% of total deposits Pending El Dorado Savings Bank acquisition will provide approximately $2.0 billion of stable core deposits Loan and Lease Production and Credit Quality Loan and lease production of $1.32 billion; up 4.8% from 2Q18 Net loan and lease growth of $345 million; growth across all business lines NPAs to total loans and leases and foreclosed assets of 0.68%; 0.69% in 2Q18 Net charge-offs to average loans and leases of 0.04%; 0.41% in 2Q18 Net charge-offs 48% lower for YTD 2018 compared to same period in 2017 Strong Capital Levels Tangible common equity ratio of 9.61% (1) Consolidated CET1 and total capital ratios of 10.18% and 13.03%
See “Non-GAAP Measurements” slides beginning on page 49. . Financial Highlights ? ($ in millions, except per share amounts) 3Q18 2Q18 Q / Q Total Assets 24,782 $ 24,530 $ 1% Loans and Leases Held for Investment, net of deferred fees 17,230 $ 16,885 $ 2% Total Deposits 17,880 $ 17,929 $ 0% Core Deposits 15,513 $ 15,586 $ 0% Net Earnings 116.3 $ 115.7 $ 1% Earnings Per Share 0.94 $ 0.92 $ 2% Return on Average Assets ("ROAA") 1.89% 1.93% -0.04 Return on Average Tangible Equity ("ROATE") (1) 21.61% 20.98% 0.63 Tangible Common Equity Ratio (1) 9.61% 9.86% -0.25 Tangible Book Value Per Share (1) 17.28 $ 17.35 $ 0% Tax Equivalent Net Interest Margin 4.99% 5.18% -0.19 Efficiency Ratio 40.9% 39.8% 1.1%
Solid Earnings Track Record (In millions, except EPS) 3Q16 4Q16 1Q17 2Q17 3Q17 4Q17 1Q18 2Q18 3Q18 Net Earnings 93.9 $ 85.6 $ 78.7 $ 93.6 $ 101.5 $ 84.0 $ 118.3 $ 115.7 $ 116.3 $ Diluted EPS 0.77 $ 0.71 $ 0.65 $ 0.77 $ 0.84 $ 0.66 $ 0.93 $ 0.92 $ 0.94 $ $0.40 $0.50 $0.60 $0.70 $0.80 $0.90 $1.00 $50 $60 $70 $80 $90 $100 $110 $120 $130 3Q16 4Q16 1Q17 2Q17 3Q17 4Q17 1Q18 2Q18 3Q18 EPS Millions Net Earnings Diluted EPS
Source: SNL Financial using data as of October 31, 2018 Solid Capital Position – 3Q18 12.19% 11.54% 11.67% 11.75% 12.02% 10.50% 10.43% 9.86% 9.61% 3Q 16 4Q 16 1Q 17 2Q 17 3Q 17 4Q 17 1Q 18 2Q 18 3Q 18 TCE / TA PACW Median Banks $15-$40B 12.13% 11.91% 11.87% 11.90% 12.02% 10.66% 10.66% 10.33% 10.10% 3Q 16 4Q 16 1Q 17 2Q 17 3Q 17 4Q 17 1Q 18 2Q 18 3Q 18 T1 Leverage PACW Median Banks $15-$40B 16.18% 15.56% 15.56% 15.42% 15.74% 13.75% 14.11% 13.51% 13.03% 3Q 16 4Q 16 1Q 17 2Q 17 3Q 17 4Q 17 1Q 18 2Q 18 3Q 18 Total Capital PACW Median Banks $15-$40B 12.83% 12.31% 12.31% 12.28% 12.52% 10.91% 11.16% 10.62% 10.18% 3Q 16 4Q 16 1Q 17 2Q 17 3Q 17 4Q 17 1Q 18 2Q 18 3Q 18 CET1 PACW Median Banks $15-$40B
Investment Securities

3.07% overall portfolio tax equivalent yield (2) (1) Fair value at 9/30/18 (2) Yield is for 3Q18 Investment Portfolio Average Life and Effective Duration Municipal Securities Composition Diversified Investment Portfolio 6.8 7.0 6.5 6.4 6.3 5.9 6.0 5.7 5.6 5.4 3 4 5 6 7 8 3Q17 4Q17 1Q18 2Q18 3Q18 Years Average Life Effective Duration SBA Securities, $67.6mm, 2% Agency Residential MBS, $249.8mm, 7% U.S. Treasuries, $397.6mm, 10% Agency Residential CMOs, $569.6mm, 15% Agency Commercial MBS, $1,077.0mm, 28% Private CMOs, $110.5mm, 3% Municipal Securities, $1,271.6mm, 33% Other, $76.6mm, 2% $3.8 Billion Total Portfolio (1) S&P Ratings % Total Issue Type % Total AAA 9% G.O. Limited 7% AA 81% G.O. Unlimited 43% A 3% Revenue 50% BBB 1% Not Rated 6% 100% 100%
Loans and Leases
Diversified Loan and Lease Portfolio (1) Net of deferred fees (2) In 4Q17 we acquired $2.1 billion in loans from the CUB acquisition and we sold $1.5 billion in cash flow loans. ($ in millions) $ Mix $ Mix Real Estate Mortgage: Commercial 4,933 $ 28% 4,339 $ 28% Residential 2,746 16% 1,850 12% Total Real Estate Mortgage 7,679 44% 6,189 40% RE Construction & Land: Commercial 854 5% 681 4% Residential 1,147 7% 568 4% Total RE Construction & Land 2,001 12% 1,249 8% Total Real Estate 9,680 56% 7,438 48% Commercial: Asset-based 3,222 19% 2,793 18% Venture capital 2,032 12% 1,959 12% Other commercial 1,898 11% 3,114 20% Total Commercial 7,152 42% 7,866 50% Consumer 398 2% 386 2% Total Loans HFI (1)(2) 17,230 $ 100% 15,690 $ 100% 9/30/2018 9/30/2017 Commercial Mortgage Residential Mortgage Commercial Construction Residential Construction Asset - based Venture Capital Other Commercial Consumer As of September 30, 2018
Diversified Loan and Lease Portfolio ($ in millions) $ Mix $ Mix Asset-Based: Lender Finance & Timeshare 1,817 $ 56% 1,594 $ 57% Equipment Finance 683 21% 594 22% Premium Finance 315 10% 203 7% Other 407 13% 402 14% Total Asset-Based 3,222 $ 100% 2,793 $ 100% 9/30/2018 9/30/2017 ($ in millions) $ Mix $ Mix Real Estate: Other Commercial 3,311 $ 34% 2,321 $ 31% Income Producing Residential 2,619 27% 1,730 23% Construction & Land 2,001 21% 1,249 17% Hospitality 589 6% 696 9% SBA 550 6% 485 7% Healthcare 483 5% 841 11% Other Residential 127 $ 1% 120 $ 2% Total Real Estate 9,680 $ 100% 7,438 $ 100% 9/30/2018 9/30/2017 Other Commercial, $3,311mm, 34% Income Producing Residential, $2,619mm, 27% Construction & Land, $2,001mm, 21% Hospitality, $589mm, 6% SBA, $550mm, 6% Healthcare, $483mm, 5% Other Residential, $127mm, 1% Real Estate ($9.7B) Lender Finance & Timeshare, $1,817mm, 56% Equipment Finance, $683mm, 21% Premium Finance, $315mm, 10% Other, $407mm, 13% Asset - Based ($3.2B)
Diversified Loan and Lease Portfolio Secured Business Loans, $693mm, 36% Security Monitoring, $607mm, 32% Unsecured Business Loans, $223mm, 12% Municipal, $115mm, 6% Cash Flow, $109mm, 6% SBA, $83mm, 4% HOA Loans, $68mm, 4% Other Commercial ($1.9B) Expansion Stage, $975mm, 48% Equity Fund Loans, $628mm, 31% Early Stage, $293mm, 14% Late Stage, $136mm, 7% Venture Capital ($2.0B) ($ in millions) $ Mix $ Mix Other Commercial: Secured Business Loans 693 $ 36% 379 $ 12% Security Monitoring 607 32% 563 18% Unsecured Business Loans 223 12% 128 4% Municipal 115 6% 46 1% Cash Flow 109 6% 1,851 60% SBA 83 4% 84 3% HOA Loans 68 4% 63 2% Total Other Commercial 1,898 $ 100% 3,114 $ 100% 9/30/2018 9/30/2017 ($ in millions) $ Mix $ Mix Venture Capital: Expansion Stage 975 $ 48% 891 $ 45% Equity Fund Loans 628 31% 341 18% Early Stage 293 14% 464 24% Late Stage 136 7% 263 13% Total Venture Capital 2,032 $ 100% 1,959 $ 100% 9/30/2018 9/30/2017
PacWest originates construction loans in both its National Lending and Community Banking groups. The National Lending (NL) construction group was started in early 2015 with the hiring of a seasoned team with multiple years of experience working together. NL originates primarily non or limited recourse, primarily up to 60% loan-to-cost loans to high quality, experienced, well-capitalized institutional sponsors for ground-up construction and renovation projects. NL loans are structured with completion guaranties, debt service/carry guaranties, standard non-recourse carve-outs and environmental indemnity. Proceeds generally are not advanced until all equity and subordinated debt has been invested, substantially reducing the “out of the ground” risk. NL considers projects in the top 25 MSAs where the senior team has experience, market knowledge and contacts. Current concentrations are in California, New York City and Washington DC. Community Banking (CB) originates construction loans primarily within Pacific Western Bank’s Southern California footprint. CB may advance up to 70% of cost, but on a full recourse basis to well-capitalized sponsors with whom the Bank has prior lending experience. Construction & Land Loans - $2.0 billion at 9/30/18 National Community ($ in millions) Lending Banking Outstanding balance 952 $ 1,049 $ Unfunded commitments 1,667 $ 794 $ Weighted average coupon 6.62% 5.98% Average commitment 41.6 $ 3.4 $ Classified loans - $ 0.4 $ Multi - family apts, 30% Condominiums, 12% Hospitality, 13% Office, 9% Land, 9% Retail, 6% SFR, 11% Industrial, Mixed - use & Other, 10% Total Construction Portfolio by Property Type NL - $0 - 25mm, 8% NL - $25mm - 50mm, 27% NL - $50mm - 100mm, 16% NL - $100mm - 150mm, 8% CB - $0 - 10mm, 16% CB - $10mm - 25mm, 12% CB - $25mm - 100mm, 7% CB - $100mm - 150mm, 6% Construction Commitments
Loan Types Construction- significant projects include: A lifestyle center in Chula Vista, CA A suburban retail center in Garden Grove, CA A grocery-anchored community shopping center in Cary, N.C. High traffic retail infill on San Vicente Blvd. in Los Angeles Owner-Occupied Not adversely affected by rental market volatility SBA retail is 100% owner-occupied SBA guarantied portions retained (75% average guaranty) CRE Traditional retail-focused commercial real estate lending including: National Lending $238mm portfolio of 12 loans across 9 states with $19.8mm average balance focused on lifestyle centers, urban luxury centers and grocery-anchored centers Community Banking $362mm portfolio almost entirely in California focused on suburban retail/strip centers and single tenant retail storefronts Only one traditional retail mall; placed on nonaccrual in 2Q18. (1) $43.5 million in classified loans at September 30, 2018 with related SBA guaranties totaling $0.3 million. Retail Real Estate Portfolio Overview Outstanding balance: $782mm (1) /4.5% of Loans
SNCs are not a line of business. SNC relationships are included in business line balances. SNCs are facilities greater than $100 million with a federally supervised agent/lead bank shared by three or more federally supervised financial institutions. At September 30th, 31 SNC borrowers with $867 million outstanding; down 58% from $2.086 billion at 3Q17. Credit underwriting standards are the same as standards applied to all loans. No energy-related SNCs. At September 30th, no nonaccrual loans and $67 million (7.8%) in classified loans. Classified loans increased from $31 million at 2Q18 primarily due to the downgrade of a $34.5mm security monitoring credit, a category with no prior loss history. Shared National Credit (SNC) Relationships RE Rental & Leasing, $148mm, 17% Consumer Finance, $176mm, 20% Real Estate Development, $81mm, 9% Healthcare RE, $83mm, 10% Other, $66mm, 8% Security Monitoring, $243mm, 28% Technology, $70mm, 8% $867 Million of SNC Loans at 9/30/2018
Loan and Lease Production of $1.32 Billion in 3Q18 The weighted average rate on new production presents contractual rates and does not include amortized fees. Amortized fees added approximately 30 basis points to loan yields in 2017 and 31 basis points YTD 2018. $1,003 $1,556 $745 $1,257 $1,316 $722 $724 $747 $1,204 $967 $903 $729 $931 $1,154 $1,133 $638 $813 $936 $829 $795 $1,725 $2,280 $1,492 $2,461 $2,283 $1,541 $1,542 $1,867 $1,983 $1,928 4.0% 4.5% 5.0% 5.5% 6.0% $0 $500 $1,000 $1,500 $2,000 $2,500 $3,000 Q3 Q4 Q1 Q2 Q3 2017 2018 Avg. Rate on Production Millions Production Disbursements Payoffs Paydowns Avg Production/Disbursements Avg Payoffs/Paydowns Rate on Production ($ in millions) Production/ Disbursements Payoffs/ Paydowns Net Change Rate on Production (1) 3Q18 2,283 $ 1,928 $ 355 $ 5.17% 2Q18 2,461 1,983 478 5.04% 1Q18 1,492 1,867 (375) 5.37% 4Q17 2,280 1,542 738 4.95% 3Q17 1,725 1,541 184 5.04%
Impact of Rising Rates on the Loan and Lease Portfolio As of September 30, 2018 $1,050 $832 $766 $3,648 1 Year 2 Years 3 Years > 3 Years Fixed/Hybrid Years to Maturity/Repricing ( In Millions ) Fixed - Rate, 16% Variable - Rate, 64% Hybrid, 20% Loan Portfolio by Repricing Type Amount % (In millions) 1-month LIBOR 5,776 $ 2-month LIBOR 16 3-month LIBOR 84 6-month LIBOR 1,864 12-month LIBOR 137 Total LIBOR-based Loans 7,877 57% Prime Rate 4,540 33% Other Index 1,374 10% Total Variable/Hybrid Loans 13,791 $ 100% Variable-Rate and Hybrid Loans by Index
Credit Quality

Amounts and ratios related to 2018 periods are for total loans and leases. Amounts and ratios for 2017 periods are for Non-PCI loans and leases. Classified loans and leases are those with a credit risk rating of substandard or doubtful. Allowance for credit losses includes allowance for loan and lease losses and reserve for unfunded loan commitments. Credit Quality Trends (1) ($ in thousands) 3Q17 4Q17 1Q18 2Q18 3Q18 Nonaccrual Loans and Leases HFI $ 157,697 155,784 103,725 113,745 112,972 As a % of Loans and Leases HFI % 1.01% 0.92% 0.63% 0.67% 0.66% Nonperforming Assets $ 169,327 157,113 105,461 115,976 117,379 As a % of Loans and Leases & Foreclosed Assets % 1.08% 0.93% 0.64% 0.69% 0.68% Classified Loans and Leases HFI (2) $ 344,777 278,405 208,042 236,292 260,459 As a % of Loans and Leases HFI % 2.21% 1.65% 1.26% 1.40% 1.51% Credit Loss Provision $ 15,500 6,500 4,000 17,500 11,500 As a % of Average Loans and Leases (annualized) % 0.40% 0.15% 0.10% 0.43% 0.28% Trailing Twelve Months Net Charge-offs $ 53,991 62,957 49,723 45,912 46,568 As a % of Average Loans and Leases % 0.35% 0.40% 0.31% 0.28% 0.28% Allowance for Credit Losses (ACL) (3) $ 173,579 161,647 167,136 167,500 177,281 As a % of Loans and Leases HFI % 1.11% 0.96% 1.02% 0.99% 1.03% ACL / Nonaccrual Loans and Leases HFI % 110.07% 103.76% 161.14% 147.26% 156.93%
Key Credit Trends – Loans HFI 1.11% 0.96% 1.02% 0.99% 1.03% 3Q17 4Q17 1Q18 2Q18 3Q18 ACL / Loans and Leases 2.21% 1.65% 1.26% 1.40% 1.51% 3Q17 4Q17 1Q18 2Q18 3Q18 Classified Loans and Leases / Loans and Leases 1.01% 0.92% 0.63% 0.67% 0.66% 3Q17 4Q17 1Q18 2Q18 3Q18 Nonaccrual Loans and Leases / Loans and Leases 1.08% 0.93% 0.64% 0.69% 0.68% 3Q17 4Q17 1Q18 2Q18 3Q18 NPAs / Loans and Leases and Foreclosed Assets
At September 30, 2018, the Company’s ten largest loan relationships on nonaccrual status had an aggregate book balance of $83.2 million and represented 74% of total nonaccrual loans and leases. Nonaccrual and Delinquent Loan and Lease Detail Decrease due to loan payoff. Increase due primarily to one loan of $11.9 million. % of Loan % of Loan 9/30/2018 6/30/2018 ($ in thousands) Balance Category Balance Category Balance Balance Real estate mortgage: Commercial 29,723 $ 0.6% 33,105 $ 0.7% 824 $ 2,620 $ Residential 3,259 0.1% 3,527 0.1% 5,436 2,983 Total real estate mortgage 32,982 0.4% 36,632 0.5% 6,260 5,603 Real estate construction and land: Commercial - 0.0% - 0.0% - - Residential - (A) 0.0% 10,450 1.0% 8,498 5,969 Total R.E. construction and land - 0.0% 10,450 0.5% 8,498 5,969 Commercial: Asset-based 34,619 1.1% 29,677 0.9% - - Venture capital 35,520 (B) 1.7% 27,940 1.4% 1,028 - Other commercial 9,579 0.5% 8,782 0.5% 222 230 Total commercial 79,718 1.1% 66,399 0.9% 1,250 230 Consumer 272 0.1% 264 0.1% 605 75 Total 112,972 $ 0.7% 113,745 $ 0.7% 16,613 $ 11,877 $ Nonaccrual Loans and Leases Accruing and 30 - 89 Days Past Due 9/30/2018 6/30/2018
Deposits
Does not include $2.0 billion and $1.9 billion of client investment funds held at September 30, 2018 and September 30, 2017, respectively. In 4Q17 we added $2.7 billion of deposits from the CUB acquisition. Deposit Detail Core: 87% Core: 81% ($ in millions) Deposit Category Amount % of Total Amount % of Total Noninterest-bearing demand deposits 7,834 $ 44% 6,912 $ 41% Interest checking deposits 2,278 13% 1,957 12% Money market deposits 4,783 27% 3,967 24% Savings deposits 618 3% 695 4% Total core deposits 15,513 87% 13,531 81% Non-core non-maturity deposits 483 3% 1,119 6% Total non-maturity deposits 15,996 90% 14,650 87% Time deposits $250,000 and under 1,509 8% 1,770 11% Time deposits over $250,000 374 2% 353 2% Total time deposits 1,883 10% 2,123 13% Total deposits (1) (2) 17,879 $ 100% 16,773 $ 100% September 30, 2018 September 30, 2017 Noninterest - bearing demand deposits Interest checking deposits Money market deposits Savings deposits Non - core non - maturity deposits Time deposits $250,000 and under Time deposits over $250,000 September 30, 2018 Noninterest - bearing demand deposits Interest checking deposits Money market deposits Savings deposits Non - core non - maturity deposits Time deposits $250,000 and under Time deposits over $250,000 September 30, 2017
Deposit Portfolio Includes brokered time deposits of $616 million with a weighted average maturity of 6 months and a weighted average cost of 2.03%. $16.8 $18.9 $18.1 $17.9 $17.9 0.52% 0.53% 0.56% 0.68% 0.83% 0.31% 0.30% 0.31% 0.37% 0.46% 0.00% 0.20% 0.40% 0.60% 0.80% 1.00% 1.20% 0.0 5.0 10.0 15.0 20.0 25.0 3Q17 4Q17 1Q18 2Q18 3Q18 Cost Balance ($ in Billions) Core Deposits Non-Core Deposits Cost of Interest-Bearing Deposits Cost of Total Deposits (In millions) Time Deposits Time Deposits Total $250,000 Over Time Time Deposit Maturities and Under $250,000 Deposits Due in three months or less 520 $ 113 $ 633 $ Due in over three months through six months 350 160 510 Due in over six months through twelve months 519 59 578 Due in over 12 months through 24 months 94 39 133 Due in over 24 months 26 3 29 Total 1,509 $ (1) 374 $ 1,883 $ September 30, 2018
Net Interest Margin
Includes 27bps in Q1 2016 and 29bps in Q4 2016 due to accelerated discount accretion from the payoff of nonaccrual PCI loans. Source: SNL Financial using data as of October 31, 2018 (1) Industry Leading Tax Equivalent Net Interest Margin (1) (1) 5.46% 5.22% 5.53% 5.33% 5.26% 5.47% 5.16% 5.21% 5.08% 4.97% 5.11% 5.18% 4.99% 3.39% 3.32% 3.40% 3.36% 3.37% 3.35% 3.34% 3.45% 3.52% 3.51% 3.53% 3.62% 3.61% 3.00% 3.50% 4.00% 4.50% 5.00% 5.50% 6.00% 6.50% 7.00% 3Q 15 4Q 15 1Q 16 2Q 16 3Q 16 4Q 16 1Q 17 2Q 17 3Q 17 4Q 17 1Q 18 2Q 18 3Q 18 PACW Reported TE NIM Banks $15-$40B Reported NIM
Includes 34bps in Q1 2016 and 35bps in Q4 2016 due to accelerated discount accretion from the payoff of nonaccrual PCI loans. Source: SNL Financial using data as of October 31, 2018 Higher Loan Yields From Disciplined & Diversified Lending (1) (1) 6.34% 6.21% 6.57% 6.24% 6.17% 6.31% 5.94% 6.07% 6.01% 5.89% 6.11% 6.30% 6.20% 4.15% 4.16% 4.18% 4.20% 4.13% 4.18% 4.20% 4.31% 4.45% 4.48% 4.53% 4.74% 4.83% 3.50% 4.00% 4.50% 5.00% 5.50% 6.00% 6.50% 7.00% 3Q 15 4Q 15 1Q 16 2Q 16 3Q 16 4Q 16 1Q 17 2Q 17 3Q 17 4Q 17 1Q 18 2Q 18 3Q 18 PACW - Reported TE Loan Yield Banks $15-$40B - Reported Loan Yield
Source: SNL Financial using data as of October 31, 2018 Deposit Franchise: 3Q18 Deposit Cost of 46 Basis Points 0.33% 0.24% 0.23% 0.20% 0.19% 0.19% 0.21% 0.25% 0.31% 0.30% 0.31% 0.37% 0.46% 0.24% 0.25% 0.26% 0.26% 0.26% 0.26% 0.27% 0.33% 0.39% 0.42% 0.46% 0.52% 0.62% 0.13% 0.16% 0.36% 0.37% 0.39% 0.45% 0.70% 0.95% 1.15% 1.20% 1.45% 1.74% 1.92% 0.00% 0.50% 1.00% 1.50% 2.00% 2.50% 3Q 15 4Q 15 1Q 16 2Q 16 3Q 16 4Q 16 1Q 17 2Q 17 3Q 17 4Q 17 1Q 18 2Q 18 3Q 18 PACW - Reported Deposit Cost Banks $15-$40B - Reported Deposit Cost Avg Fed Funds Rate
Asset-Sensitive Balance Sheet Benefits From Rising Rates Note: The above table presents forecasted net interest income and net interest margin for the next 12 months using the forward yield curve as the base scenario and shocking the static balance sheet for immediate and sustained parallel upward movements in interest rates of 100, 200 and 300 basis points. ($ in millions) Forecasted Percentage Forecasted Net Interest Income Change Net Interest Margin Interest Rate Scenario (Tax Equivalent) From Base (Tax Equivalent) Up 300 basis points 1,131.2 $ 10.3% 5.26% Up 200 basis points 1,097.2 7.0% 5.10% Up 100 basis points 1,061.8 3.6% 4.94% Base case 1,025.4 - 4.77% September 30, 2018 0.0% 2.0% 4.0% 6.0% 8.0% 10.0% 12.0% Base Up 100 Up 200 Up 300 PacWest Bancorp Pro Forma Combined IRR Model Results - % Change in NII - Year 1 Static Balance Sheet - September 30, 2018 Sudden Parallel Shocks PACW
Controlled Expenses
Source: SNL Financial using data as of October 31, 2018 Efficiency Ratio Trend 39.6% 39.3% 38.5% 40.6% 40.1% 40.1% 41.4% 40.3% 40.4% 41.0% 41.7% 39.8% 40.9% 60.0% 60.5% 61.7% 61.4% 58.6% 59.9% 61.2% 57.2% 56.8% 56.3% 57.2% 56.0% 55.2% 35.0% 40.0% 45.0% 50.0% 55.0% 60.0% 65.0% 3Q 15 4Q 15 1Q 16 2Q 16 3Q 16 4Q 16 1Q 17 2Q 17 3Q 17 4Q 17 1Q 18 2Q 18 3Q 18 PACW Reported Efficiency Ratio Banks $15-$40B Median Efficiency Ratio
Focus and Execution Drive Efficiency 41.6% 38.5% 39.8% 40.8% 41.7% 39.8% 40.9% 2014 2015 2016 2017 1Q18 2Q18 3Q18 Efficiency Ratio $147 $193 $203 $245 $238 $239 $238 2014 2015 2016 2017 1Q18 2Q18 3Q18 Average Branch Size ($ - M)
Acquisitions

Acquisition Strategy In-Market Consolidation Market Expansion Asset Generation Capability Strong Core Deposit Base Sound Strategic Focus Key Drivers of Accretion Cost Savings Customer Retention Margin Improvement
El Dorado Savings Bank Transaction Highlights Strategic Rationale Geographically expands PacWest’s community bank franchise into Northern California and Northern Nevada with the acquisition of a high-quality, 60 year-old, privately held community bank Enhances core funding with $2.0 billion in stable, granular, low cost deposits 91% core deposits(1) and a 0.13% cost of total deposits No brokered or wholesale deposits Strengthens PacWest’s balance sheet liquidity 29.4% loan-to-deposit ratio $1.6 billion in cash and investments consisting of short duration, high cash flow GSE securities Provides margin expansion opportunities by redeploying excess liquidity into community banking loans (not modeled) Limited execution risk given an already efficient operating platform (a 56% efficiency ratio and a 1.57% operating expense ratio) and no anticipated branch closures or reduction in customer-facing employees Achieves significant deposit market share in the banking markets served Provides a platform to expand commercial banking activities in Northern California and Northern Nevada Provides revenue opportunities by enhancing product offerings and lending limits to current customers (not modeled) Transaction Metrics GAAP EPS: neutral to 2019 and 2020 earnings Cash EPS(2): Accretion of ~1% in 2019 and 2020 respectively Incremental Cash EPS on shares issued: exceeds $4.50 and $5.20 in 2019 and 2020 respectively Tangible Book Value Earnback: < 3.5 years Core Deposit Premium(1): 13.3% Internal Rate of Return: > 17% Pro forma regulatory capital ratios remain strong Note: Financial data as of or for the three months ended June 30, 2018 or an otherwise denoted quarter. Defined as total deposits less time deposits with balances greater than $100,000. Calculated by adjusting GAAP EPS for merger adjustments.
Pro Forma Community Bank Franchise PacWest El Dorado California Utah Nevada Arizona Las Vegas Carson City Bakersfield San Francisco Los Angeles Oxnard Anaheim Huntington Beach Sacramento San Bernardino San Diego Phoenix San Jose Fresno Stockton Fremont Modesto
Pro Forma Loan and Deposit Composition Note: Data as of or for the three months ended June, 30, 2018. Excludes purchase accounting and other merger-related adjustments. PacWest El Dorado Pro Forma(1) Total Deposits: $17.9 billion Cost of Deposits: 0.36% Total Deposits: $2.0 billion Cost of Deposits: 0.13% Total Deposits: $19.9 billion Cost of Deposits: 0.34% PacWest El Dorado Pro Forma(1) Gross Loans: $16.9 billion Yield on Loans: 6.28% Gross Loans: $0.6 billion Yield on Loans: 3.28% Gross Loans: $17.5 billion Yield on Loans: 6.20%Yi C&D 12% C&I 27% Res. RE 2% CRE 35% Multifamily 13% Consumer & Other 11% C&D 11% C&I 26% Res. RE 5% CRE 34% Multifamily 13% Consumer & Other 11% Res. RE 91% CRE 1% Consumer & Other 8% DDA 45% NOW & Other 2% MMDA & Sav. 43% Retail Time 8% Jumbo Time 2% DDA 41% NOW & Other 5% MMDA & Sav. 44% Retail Time 8% Jumbo Time 2% DDA 3% NOW & Other 32% MMDA & Sav. 47% Retail Time 15% Jumbo Time 3%
El Dorado Transaction Summary Note: Estimated financial impact is presented solely for illustrative purposes based on consensus analyst estimates for PACW and preliminary estimates for EL Dorado. Includes estimated purchase accounting and other merger-related adjustments. Based on the fixed exchange ratio, fixed cash amount and PACW’s closing stock price of $50.04 on September 11, 2018. Defined as total deposits less all time deposits with balances greater than $100,000. Consideration and Deal Value(1) Aggregate Deal Value: $466.7 million; $59.8 million in cash and $406.9 million in stock PACW Shares Issued: ~8.1 million Cash Per Share: $427.92 Pro Forma El Dorado Stockholders Ownership: ~ 6.2% Transaction Multiples(1) Required Approvals Regulatory Approvals: FDIC and California DBO Stockholder Vote: El Dorado stockholders Other Will operate as a new region under Pacific Western Bank’s Community Banking Group John Cook, President of El Dorado, will serve as the Sierra Regional President Expected closing: Q1 2019 Price / Tangible Book Value per Share: 2.05x Price / LTM EPS: 27.3x Price / 2019 EPS: 22.9x Core Deposit Premium(2): 13.3%
El Dorado Financial Impact and Key Assumptions Note: Estimated financial impact is presented solely for illustrative purposes based on consensus analyst estimates for PACW and preliminary estimates for El Dorado. Includes estimated purchase accounting and other merger related adjustments. Financial Impact GAAP EPS: neutral to 2019 and 2020 earnings Cash EPS: Accretion of ~1% in 2019 and 2020 respectively Incremental Cash EPS on shares issued: exceeds $4.50 and $5.20 in 2019 and 2020 respectively Tangible Book Value Earnback: < 3.5 years Core Deposit Premium: 13.3% Internal Rate of Return: > 17% Cost Savings: Approximately 17% of El Dorado’s noninterest expense base 100% phase-in for 2019 Gross Loan Mark: $16.2 million; accreted straight-line over 5 years Securities Mark: $35.0 million $1.6 billion in cash and securities repositioned at a 3.75% average yield Fixed Assets: $21.0 million write-up; $10.5 million depreciated straight-line over 23 years Core Deposit Intangibles: $74.1 million or 4.4% of non-time deposits; amortized SYD over 10 years Durbin Amendment: $2.0 million annual interchange revenue loss Revenue Synergies: Not modeled Restructuring Costs: $35.1 million total pre-tax Effective Tax Rate: 29.6% Key Assumptions
Strong Franchise Value
National Lending Combined With California Branch Network Los Angeles, CA Durham, NC Chevy Chase, MD Chicago, IL St. Louis, MO Denver, CO New York, NY Boston, MA Minneapolis, MN Austin, TX Campbell, CA Menlo Park, CA San Francisco, CA Seattle, WA Atlanta, GA San Diego, CA National Lending office Venture Banking office Community Banking branch
* Assets are as of June 30, 2018. All assets amounts using data from SNL Financial as of October 31, 2018. California-Based Public Banks and Thrifts Rank Company Name Ticker Assets ($000) 1 Wells Fargo & Company WFC 1,872,981,000 $ 2 First Republic Bank FRC 96,094,222 $ 3 SVB Financial Group SIVB 58,139,734 $ 4 East West Bancorp, Inc. EWBC 39,073,106 $ 5 PacWest Bancorp PACW 24,782,126 $ 6 Cathay General Bancorp CATY 16,461,722 $ 7 Hope Bancorp, Inc. HOPE 15,229,495 $ 8 Pacific Premier Bancorp, Inc. PPBI 11,503,881 $ 9 CVB Financial Corp. CVBF 11,480,341 $ 10 Banc of California, Inc. BANC 10,260,822 $ 11 Axos Financial, Inc. AX 9,791,520 $ 12 Opus Bank OPB 7,395,074 $ 13 Farmers & Merchants Bank of Long Beach FMBL 7,309,219 $ 14 Luther Burbank Corporation LBC 6,692,415 $ 15 TriCo Bancshares TCBK 6,318,865 $ 16 Mechanics Bank MCHB 6,133,131 $ * 17 Westamerica Bancorporation WABC 5,529,463 $ 18 Hanmi Financial Corporation HAFC 5,487,042 $ 19 First Foundation, Inc. FFWM 5,466,282 $ 20 Preferred Bank PFBC 4,076,188 $ 21 Farmers & Merchants Bancorp FMCB 3,200,000 $ 22 Heritage Commerce Corp HTBK 3,192,910 $ 23 1867 Western Financial Corporation WFCL 2,997,181 $ * 24 Exchange Bank EXSR 2,612,514 $ 25 Bank of Marin Bancorp BMRC 2,545,715 $ 26 Sierra Bancorp BSRR 2,463,040 $ 27 River City Bank RCBC 2,183,436 $ 28 RBB Bancorp RBB 2,136,839 $ 29 American Business Bank AMBZ 2,096,298 $ 30 Pacific City Financial Corporation PCB 1,663,787 $ As of September 30, 2018
The Company uses certain non-GAAP financial measures to provide meaningful supplemental information regarding the Company’s operational performance and to enhance investors’ overall understanding of such financial performance. These non-GAAP financial measures should not be considered a substitute for financial information presented in accordance with GAAP and may be different from non-GAAP financial measures used by other companies. The table on the following slide presents reconciliations of certain GAAP to non-GAAP financial measures. Non-GAAP Measurements
Tangible Common Equity Ratio/Tangible Book Value Per Share September 30, June 30, March 31, December 31, September 30, ($ in thousands, except per share amounts) 2018 2018 2018 2017 2017 Tangible Common Equity Ratio & Tangible Book Value Per Share Stockholders' equity 4,741,685 $ 4,777,959 $ 4,867,490 $ 4,977,598 $ 4,610,668 $ Less: Intangible assets 2,610,776 2,616,363 2,621,950 2,628,296 2,201,137 Tangible common equity 2,130,909 $ 2,161,596 $ 2,245,540 $ 2,349,302 $ 2,409,531 $ Total assets 24,782,126 $ 24,529,557 $ 24,149,330 $ 24,994,876 $ 22,242,932 $ Less: Intangible assets 2,610,776 2,616,363 2,621,950 2,628,296 2,201,137 Tangible assets 22,171,350 $ 21,913,194 $ 21,527,380 $ 22,366,580 $ 20,041,795 $ Equity to assets ratio 19.13% 19.48% 20.16% 19.91% 20.73% Tangible common equity ratio (1) 9.61% 9.86% 10.43% 10.50% 12.02% Book value per share 38.46 $ 38.36 $ 38.47 $ 38.65 $ 37.96 $ Tangible book value per share (2) 17.28 $ 17.35 $ 17.75 $ 18.24 $ 19.84 $ Shares outstanding 123,283,450 124,567,950 126,537,871 128,782,878 121,449,794 Return on Average Tangible Equity Net earnings 116,287 $ 115,735 $ 118,276 $ 84,037 $ 101,466 $ Average stockholders' equity 4,748,819 $ 4,832,480 $ 4,901,207 $ 4,920,498 $ 4,592,489 $ Less: Average intangible assets 2,614,055 2,619,351 2,625,593 2,495,876 2,202,922 Average tangible common equity 2,134,764 $ 2,213,129 $ 2,275,614 $ 2,424,622 $ 2,389,567 $ Return on average equity 9.72% 9.61% 9.79% 6.78% 8.77% Return on average tangible equity (3) 21.61% 20.98% 21.08% 13.75% 16.85% (1) Tangible common equity divided by tangible assets (2) Tangible common equity divided by shares outstanding (3) Annualized net earnings divided by average tangible common equity