Attached files
| file | filename |
|---|---|
| EX-99.1 - EX-99.1 - MFA FINANCIAL, INC. | a18-39544_1ex99d1.htm |
| 8-K - 8-K - MFA FINANCIAL, INC. | a18-39544_18k.htm |
Forward Looking Statements When used in this presentation or other written or oral communications, statements which are not historical in nature, including those containing words such as “will,” “believe,” “expect,” “anticipate,” “estimate,” “plan,” “continue,” “intend,” “should,” “could,” “would,” “may” the negative of these words or similar expressions, are intended to identify “forward-looking statements” within the meaning of Section 27A of the 1933 Act and Section 21E of the 1934 Act and, as such, may involve known and unknown risks, uncertainties and assumptions. Statements regarding the following subjects, among others, may be forward-looking: changes in interest rates and the market (i.e., fair) value of MFA’s MBS, residential whole loans, CRT securities and other assets; changes in the prepayment rates on residential mortgage assets, an increase of which could result in a reduction of the yield on certain investments in our portfolio and an increase of which could require us to reinvest the proceeds received by us as a result of such prepayments in investments with lower coupons; credit risks underlying MFA’s assets, including changes in the default rates and management’s assumptions regarding default rates on the mortgage loans securing MFA’s Non-Agency MBS and relating to MFA’s residential whole loan portfolio; MFA’s ability to borrow to finance its assets and the terms, including the cost, maturity and other terms, of any such borrowings; implementation of or changes in government regulations or programs affecting MFA’s business; MFA’s estimates regarding taxable income, the actual amount of which is dependent on a number of factors, including, but not limited to, changes in the amount of interest income and financing costs, the method elected by MFA to accrete the market discount on Non-Agency MBS and residential whole loans and the extent of prepayments, realized losses and changes in the composition of MFA’s Agency MBS, Non-Agency MBS and residential whole loan portfolios that may occur during the applicable tax period, including gain or loss on any MBS disposals and whole loan modifications, foreclosures and liquidations; the timing and amount of distributions to stockholders, which are declared and paid at the discretion of MFA’s Board of Directors and will depend on, among other things, MFA’s taxable income, its financial results and overall financial condition and liquidity, maintenance of its REIT qualification and such other factors as MFA’s Board of Directors deems relevant; MFA’s ability to maintain its qualification as a REIT for federal income tax purposes; MFA’s ability to maintain its exemption from registration under the Investment Company Act of 1940, as amended (or the Investment Company Act), including statements regarding the Concept Release issued by the Securities and Exchange Commission (SEC) relating to interpretive issues under the Investment Company Act with respect to the status under the Investment Company Act of certain companies that are engaged in the business of acquiring mortgages and mortgage-related interests; MFA’s ability to continue growing its residential whole loan portfolio which is dependent on, among other things, the supply of loans offered for sale in the market; expected returns on our investments in non-performing residential whole loans (NPLs), which are affected by, among other things, the length of time required to foreclose upon, sell, liquidate or otherwise reach a resolution of the property underlying the NPL, home price values, amounts advanced to carry the asset (e.g., taxes, insurance, maintenance expenses, etc. on the underlying property) and the amount ultimately realized upon resolution of the asset; targeted or expected returns on MFA’s investments in recently-originated loans, the performance of which is, similar to MFA’s other mortgage loan investments, subject to, among other things, prepayment risk, credit risk and financing cost associated with such investments; risks associated with our investments in MSR related assets, including servicing, regulatory and economic risks, and risks associated with investing in real estate assets, including changes in business conditions and the general economy. These and other risks, uncertainties and factors, including those described in the annual, quarterly and current reports that MFA files with the SEC, could cause MFA’s actual results to differ materially from those projected in any forward-looking statements it makes. All forward-looking statements are based on beliefs, assumptions and expectations of MFA’s future performance, taking into account all information currently available. Readers are cautioned not to place undue reliance on these forward-looking statements, which speak only as of the date on which they are made. New risks and uncertainties arise over time and it is not possible to predict those events or how they may affect MFA. Except as required by law, MFA is not obligated to, and does not intend to, update or revise any forward-looking statements, whether as a result of new information, future events or otherwise. 2
Executive summary In the third quarter of 2018, MFA generated GAAP EPS of $0.19. • • Q3 dividend to common stockholders was $0.20 per share. • Estimated REIT taxable income for the quarter was $0.21 per common share. Estimated undistributed taxable income was $0.11 per common share at September 30, 2018. • Wecompletedacommonequityofferingofnearly51millionshares,raising approximately $389 million of net proceeds. • Investment activity was very robust as we purchased over $2.3 billion of assets and increased our portfolio by more than $1.3 billion in the third quarter. • Book value per share declined approximately 1% to $7.46 from $7.54 at June 30, 2018. 3
Executive summary (cont’d.) Over $700 million of residential whole loan purchases included approximately $400 million of Non-QM loans, $190 million of Fix and Flip loans, nearly $25 million of Single Family Rental loans and nearly $80 million of Non-Performing and Re-Performing loans. • • Our strategy of investing in newly originated loans continues to expand our portfolio and the investment performance has thus far been consistent with our expectations. • We remain willing to explore new investment structures to strengthen our originator relationships and gain access to loan flow. • MFA’s asset management team maintains oversight of servicing of our credit sensitive loans, particularly non-performing loans, to improve outcomes and expected returns. • Strong credit fundamentals continue to drive performance of our Legacy Non-Agency portfolio, which generated a yield in the third quarter of 10.76%. 4
Investment strategy Continue to grow investment assets • Newly originated loans should provide recurring (and increasing) portfolio growth. • Optimize capital structure associated with asset growth. • Produce attractive returns that are comparable to peers, but with less risk due to lower leverage, less interest rate exposure and reduced prepayment sensitivity. • Utilize Agency MBS to invest liquidity pending more attractive investment opportunities: •Hedged to minimize duration exposure •Highly liquid MBS 5
Market conditions and investment activity • Vigorous investment activity in the third quarter, particularly after our equity raise in early August. • Expand investment opportunities in the form of newly originated whole loans. Acquiring these assets is a unique process: • Long gestation periods • Creative approach to partnering with originators • Flow vs bulk arrangements • Opportunities still exist to purchase non-performing and re-performing credit sensitive whole loans. 6
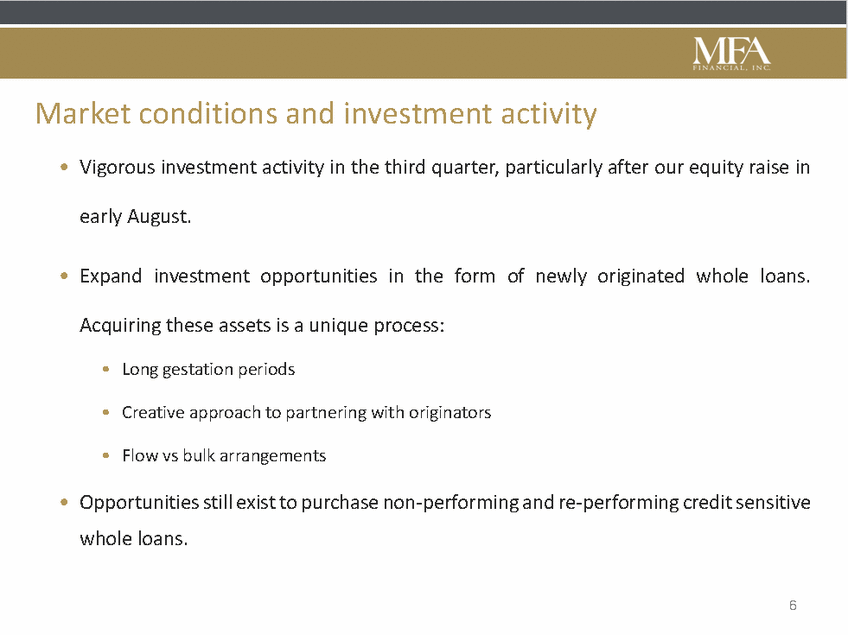
Q3 2018 net income per common share of $0.19 • Net income was higher on a sequential quarter basis primarily due to: $mm $mm • Higher net interest income from carrying value loans, reflecting ongoing portfolio growth, particularly in more recently originated loans. Higher net other income, reflecting a continued strong contribution from fair value loans, higher income overall on sales of securities and higher unrealized gains on CRTs. Operating and other expenses declined as the prior quarter was impacted by the timing of recognition of expenses associated with certain share-based compensation awards. • • (1) Includes interest expense on financing associated with all residential whole loans. Interest income received on residential whole loans held at fair value is reported in Other Income in Net gains on Residential Whole Loans held at fair value. (2) Net income impact of MBS and CRT securities sold is comprised of: Realized gains on MBS and CRT securities sold Reversal of previously unrealized gains on sold CRT securities held at fair value 16.4 (6.8) 7.4 (2.2) 9.6 5.2 7 Summary Income StatementQ3 2018 Q2 2018 Net Interest Income: MBS, CRT and MSR related$48.4 $48.6 Residential whole loans (1) 11.42.7 Income on cash balances less interest on Senior Notes(1.3)(1.3) Net Interest Income$58.6 $49.9 Other Income, net: Net gains on residential whole loans held at fair value (1) 34.932.4 Net income impact of MBS and CRT sales (2) 9.65.2 Unrealized gains/(loss) on CRT securities held at fair value3.7(0.2) Other0.23.5 Other Income, net:$48.4 $41.0 Operating and Other Expenses(19.8)(20.5) Preferred Dividends(3.8)(3.8) Net Income Available to Common Shareholders$83.4 $66.6 Earnings Per Common Share$0.19 $0.17
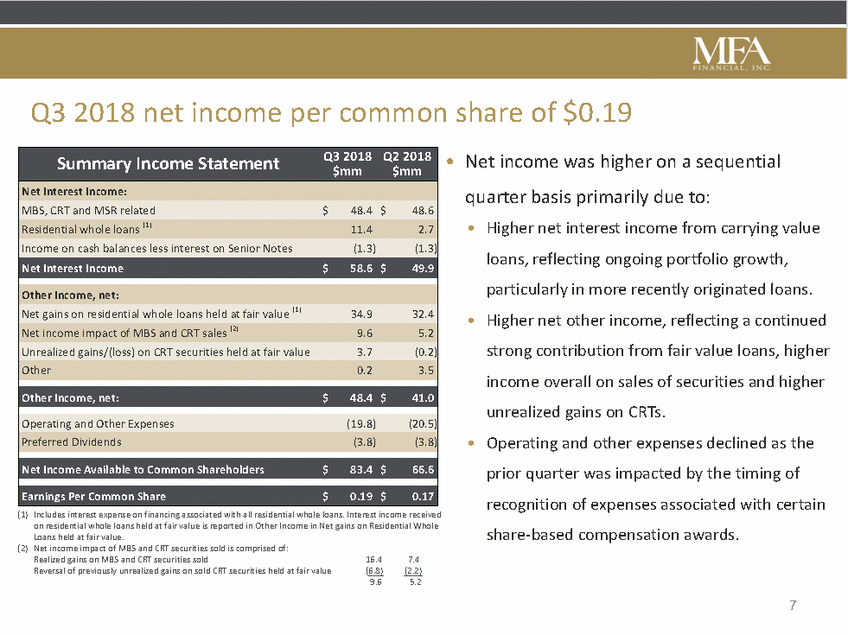
Third quarter 2018 investment flows • • Vigorous investment activity with asset acquisition in excess of $2.3 billion. Investment portfolio grew by $1.3 billion in the third quarter and by $1.6 billion year to date as new loan initiatives add meaningfully to investment flows. We opportunistically sold $119 million of CRT securities and $24 million of Non-Agency MBS in the quarter. • 3rd Quarter 3rd Quarter September 30, 3rd Quarter $ in Millions June 30, 2018 and other $3,601 $(188) $707 $24 $4,144 $543 and REO $571 $(3) $84 $(113) $539 $(32) Securities (1) RPL/NPL are securitized financial instruments that are backed by re-performing and non-performing loans. The majority of these securities are structured such that the coupon increases up to 300-400 basis points (bps) at 36-48 months from issuance. (2) MSR Related Assets include investments in term notes whose cash flows are considered to be largely dependent on underlying MSRs that directly or indirectly act as collateral for the investment. 8 Sales, MTM RunoffAcquisitionschanges2018Change Residential Whole Loans RPL/NPL MBS (1) $909$(192)$446$(1)$1,162$253 MSR Related Assets (2) $381$(166)$350$—$565$184 Credit Risk Transfer Legacy Non-Agency MBS$2,335$(145)$2$(19)$2,173$(162) Agency MBS$2,363$(192)$758$(24)$2,905$542 Totals$10,160$(886)$2,347$(133)$11,488$1,328
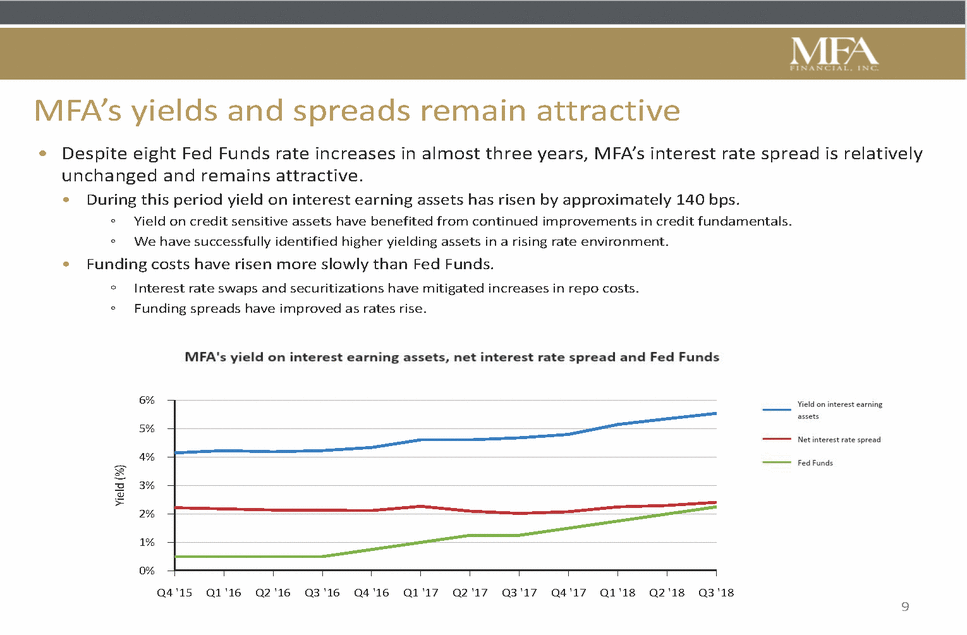
MFA’s yields and spreads remain attractive • Despite eight Fed Funds rate increases in almost three years, MFA’s interest rate spread is relatively unchanged and remains attractive. • During this period yield on interest earning assets has risen by approximately 140 bps. ◦ ◦ Yield on credit sensitive assets have benefited from continued improvements in credit fundamentals. We have successfully identified higher yielding assets in a rising rate environment. • Funding costs have risen more slowly than Fed Funds. ◦ ◦ Interest rate swaps and securitizations have mitigated increases in repo costs. Funding spreads have improved as rates rise. 6% 5% 4% 3% 2% 1% 0% Q4 '15Q1 '16Q2 '16Q3 '16Q4 '16Q1 '17 Q2 '17Q3 '17Q4 '17Q1 '18 Q2 '18 Q3 '18 9 Yield (%)
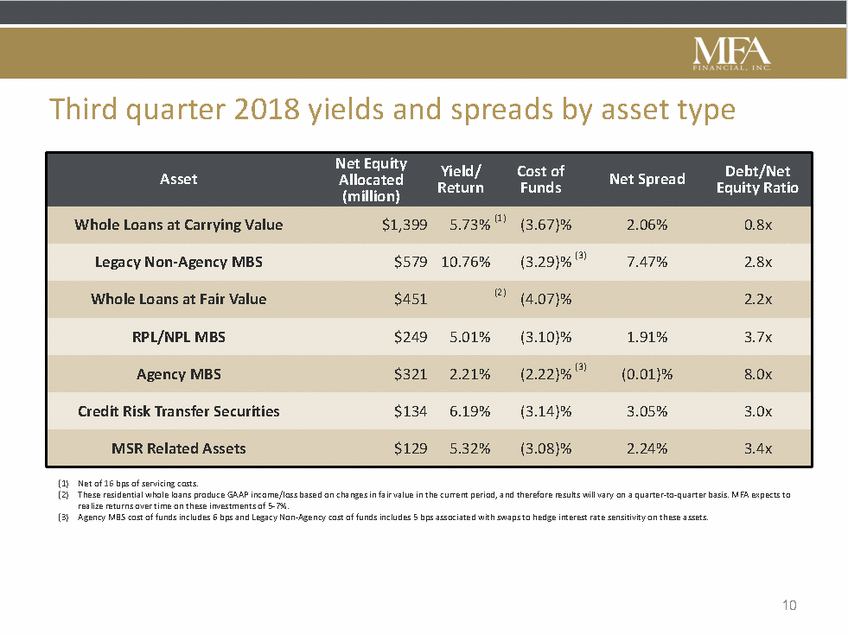
Third quarter 2018 yields and spreads by asset type Asset Allocated Net Spread Return Funds Equity Ratio (1) (2) Net of 16 bps of servicing costs. These residential whole loans produce GAAP income/loss based on changes in fair value in the current period, and therefore results will vary on a quarter-to-quarter basis. MFA expects to realize returns over time on these investments of 5-7%. Agency MBS cost of funds includes 6 bps and Legacy Non-Agency cost of funds includes 5 bps associated with swaps to hedge interest rate sensitivity on these assets. (3) 10 Net EquityYield/Cost ofDebt/Net (million) Whole Loans at Carrying Value$1,3995.73% (1) (3.67)%2.06%0.8x Legacy Non-Agency MBS$57910.76%(3.29)% (3) 7.47%2.8x Whole Loans at Fair Value$451(2) (4.07)%2.2x RPL/NPL MBS$2495.01%(3.10)%1.91%3.7x Agency MBS$3212.21%(2.22)% (3) (0.01)%8.0x Credit Risk Transfer Securities$1346.19%(3.14)%3.05%3.0x MSR Related Assets$1295.32%(3.08)%2.24%3.4x
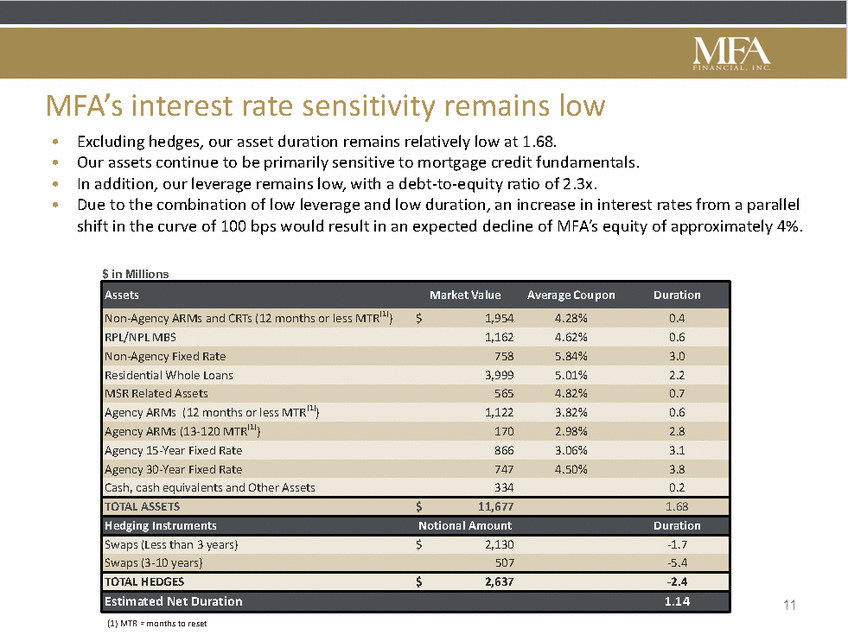
MFA’s interest rate sensitivity remains low • • • • Excluding hedges, our asset duration remains relatively low at 1.68. Our assets continue to be primarily sensitive to mortgage credit fundamentals. In addition, our leverage remains low, with a debt-to-equity ratio of 2.3x. Due to the combination of low leverage and low duration, an increase in interest rates from a parallel shift in the curve of 100 bps would result in an expected decline of MFA’s equity of approximately 4%. $ in Millions 11 (1) MTR = months to reset AssetsMarket ValueAverage CouponDuration Non-Agency ARMs and CRTs (12 months or less MTR(1)) $1,9544.28%0.4 RPL/NPL MBS1,1624.62%0.6 Non-Agency Fixed Rate7585.84%3.0 Residential Whole Loans3,9995.01%2.2 MSR Related Assets5654.82%0.7 Agency ARMs (12 months or less MTR(1)) 1,1223.82%0.6 Agency ARMs (13-120 MTR(1)) 1702.98%2.8 Agency 15-Year Fixed Rate8663.06%3.1 Agency 30-Year Fixed Rate7474.50%3.8 Cash, cash equivalents and Other Assets3340.2 TOTAL ASSETS$11,6771.68 Hedging InstrumentsNotional AmountDuration Swaps (Less than 3 years)$2,130-1.7 Swaps (3-10 years)507-5.4 TOTAL HEDGES$2,637-2.4 Estimated Net Duration1.14
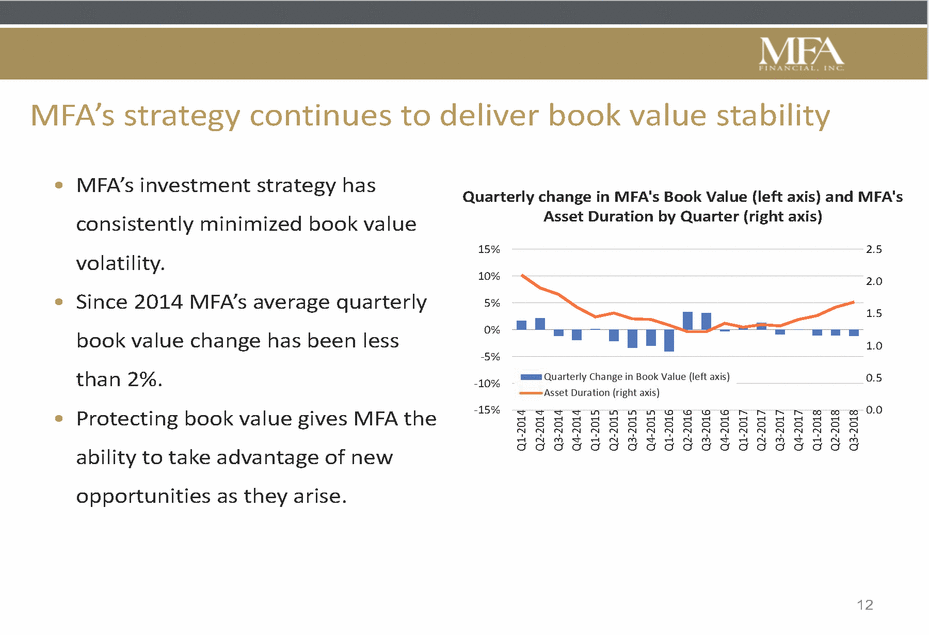
MFA’s strategy continues to deliver book value stability • MFA’s investment strategy has consistently minimized book value volatility. Since 2014 MFA’s average quarterly book value change has been less than 2%. Protecting book value gives MFA the ability to take advantage of new opportunities as they arise. Quarterly change in MFA's Book Value (left axis) and MFA's Asset Duration by Quarter (right axis) 15% 2.5 10% 2.0 • 5% 1.5 0% 1.0 -5% 0.5 -10% -15% 0.0 • 12 Q1-2014 Q2-2014 Q3-2014 Q4-2014 Q1-2015 Q2-2015 Q3-2015 Q4-2015 Q1-2016 Q2-2016 Q3-2016 Q4-2016 Q1-2017 Q2-2017 Q3-2017 Q4-2017 Q1-2018 Q2-2018 Q3-2018
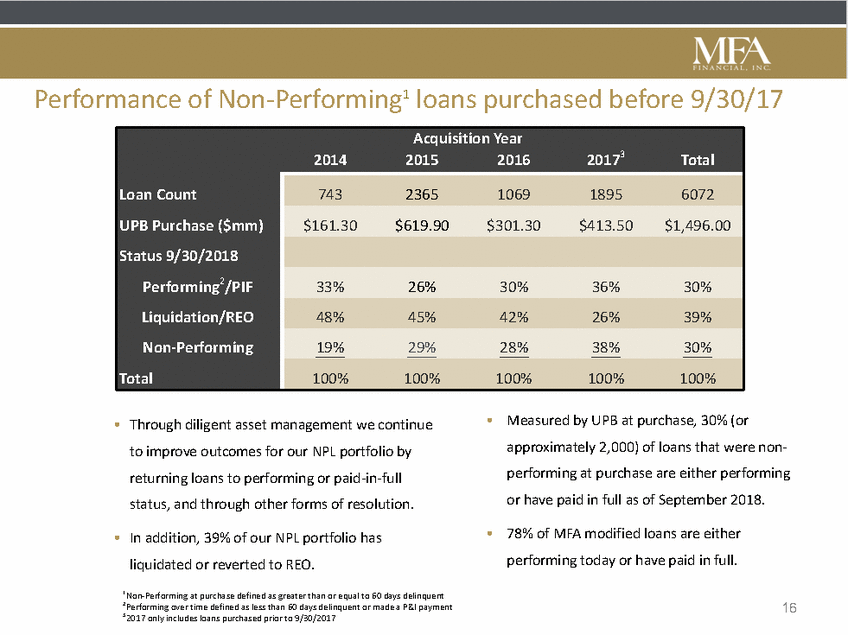
Continued positive fundamentals National HPA-YoY As of August 2018 for residential mortgage U-3 Unemployment Rate As of September 2018 credit 4% As of Q2-2018 Source: Zillow Source: FRB # of Units (millions) Mar-12 Jun-12 Sep-12 Dec-12 Mar-13 Jun-13 Sep-13 Dec-13 Mar-14 Jun-14 Sep-14 Dec-14 Mar-15 Jun-15 Sep-15 Dec-15 Mar-16 Jun-16 Sep-16 Dec-16 Mar-17 Jun-17 Sep-17 Dec-17 Mar-18 Jun-18 Jan-10 May-10 Sep-10 Jan-11 May-11 Sep-11 Jan-12 May-12 Sep-12 Jan-13 May-13 Sep-13 Jan-14 May-14 Sep-14 Jan-15 May-15 Sep-15 Jan-16 May-16 Sep-16 Jan-17 May-17 Sep-17 Jan-18 May-18 Sep-02 Apr-03 Nov-03 Jun-04 Jan-05 Aug-05 Mar-06 Oct-06 May-07 Dec-07 Jul-08 Feb-09 Sep-09 Apr-10 Nov-10 Jun-11 Jan-12 Aug-12 Mar-13 Oct-13 May-14 Dec-14 Jul-15 Feb-16 Sep-16 Apr-17 Nov-17 Jun-18 Sep-01 Jun-02 Mar-03 Dec-03 Sep-04 Jun-05 Mar-06 Dec-06 Sep-07 Jun-08 Mar-09 Dec-09 Sep-10 Jun-11 Mar-12 Dec-12 Sep-13 Jun-14 Mar-15 Dec-15 Sep-16 Jun-17 Mar-18 12% 10% 8% 6% % 4% 2% 0% Source: Corelogic 12% 10% 8% 6% 7% 2% 0% Source: BLS National for Sale Inventory As of August 2018 2.4 2.2 2.0 1.8 1.6 1.4 1.2 1.0 Deliquency Rate on Single-Family Resi Mortgages 14% 12% 10% 8% 6% 4% 2%3.25% 0% 13 1.21mm 3. 5.5
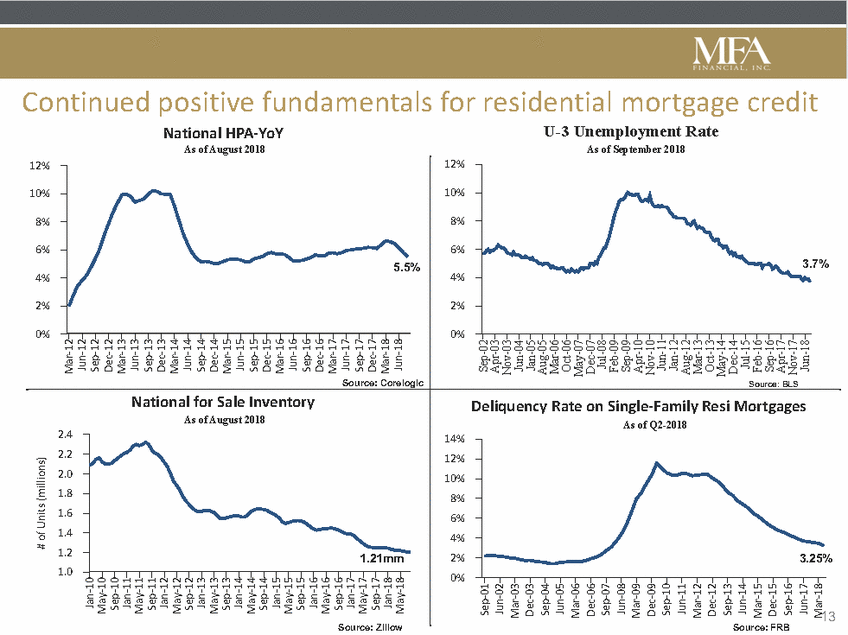
Residential whole loan portfolio update • We sourced over $700 million of residential whole loans in the third quarter. We continue to grow our portfolio of Non-QM, Fix & Flip and Single Family Rental loans adding origination partners and developing our existing relationships. Year to date flows in legacy loans have outpaced last year with over $60 billion of supply. Volumes in the legacy loan market year-to-date exceeds last year’s pace. Returns to date on Non-Performing loans continue to be consistent with our expectation of 5-7%. 14 • • • •
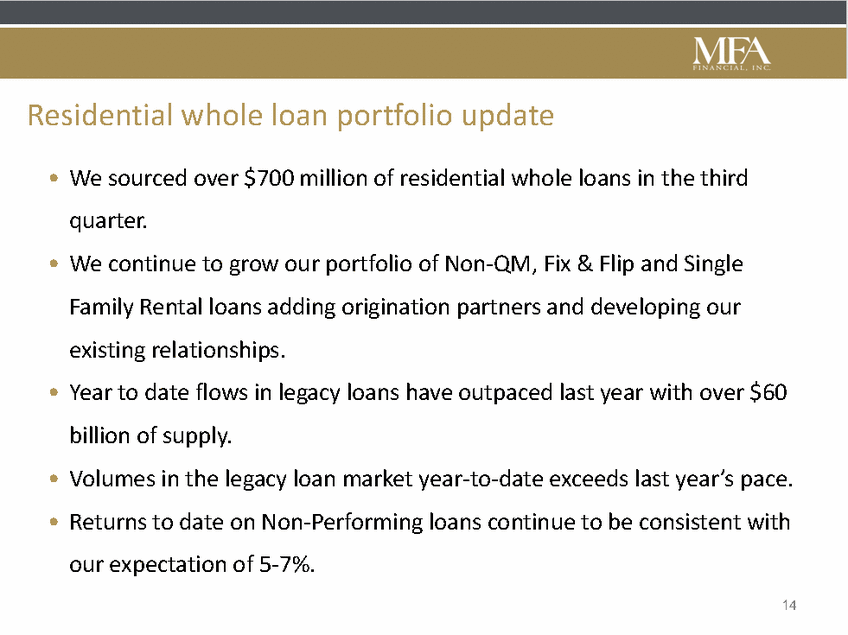
RPL portfolio delinquency characteristics as of 9/30/2018 • 88% of our RPL portfolio is less than 60 days delinquent. • On average, 28% of the 60+ days delinquent loans are making payments. • Prepay speeds have outperformed expectations maintaining a range between 6% and 14%. 15 Reflects 3 month trailing average voluntary prepayments
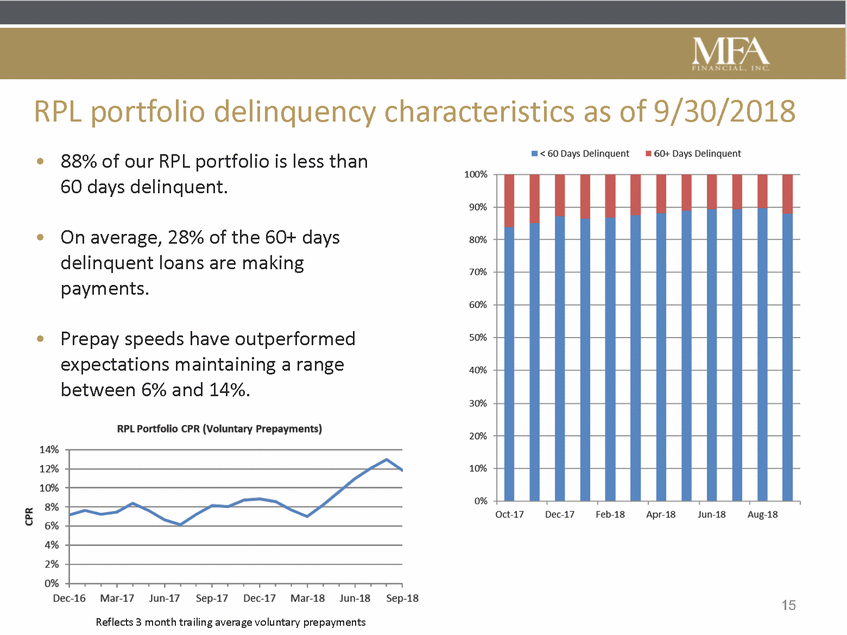
Performance of Non-Performing1 loans purchased before 9/30/17 • Measured by UPB at purchase, 30% (or approximately 2,000) of loans that were non-performing at purchase are either performing or have paid in full as of September 2018. • Through diligent asset management we continue to improve outcomes for our NPL portfolio by returning loans to performing or paid-in-full status, and through other forms of resolution. • 78% of MFA modified loans are either performing today or have paid in full. • In addition, 39% of our NPL portfolio has liquidated or reverted to REO. 1Non-Performing at purchase defined as greater than or equal to 60 days delinquent 2Performing over time defined as less than 60 days delinquent or made a P&I payment 32017 only includes loans purchased prior to 9/30/2017 16 Acquisition Year 20142015201620173Total Loan Count UPB Purchase ($mm) Status 9/30/2018 Performing2/PIF Liquidation/REO Non-Performing Total 7432365106918956072 $161.30$619.90$301.30$413.50$1,496.00 33%26%30%36%30% 48%45%42%26%39% 19% 29% 28% 38% 30% 100%100%100%100%100%
Non-QM investments • We are purchasing loans made to creditworthy borrowers who have limited conventional mortgage finance options. We have purchased over $1 billion UPB to date and are currently working with several origination partners. Able to achieve appropriate leverage through warehouse lines and potentially through capital markets transactions. Targeted yield on Non-QM assets of 5% and ROE of low double digits. • • • 17 Non-QM Portfolio Statistics as of 9/30/18 WA LTV66% WA FICO706 WA Coupon6.54% Avg Balance$410,716 Hybrid ARMs80% Fixed Rate20% Top 2 States CA54% FL15%
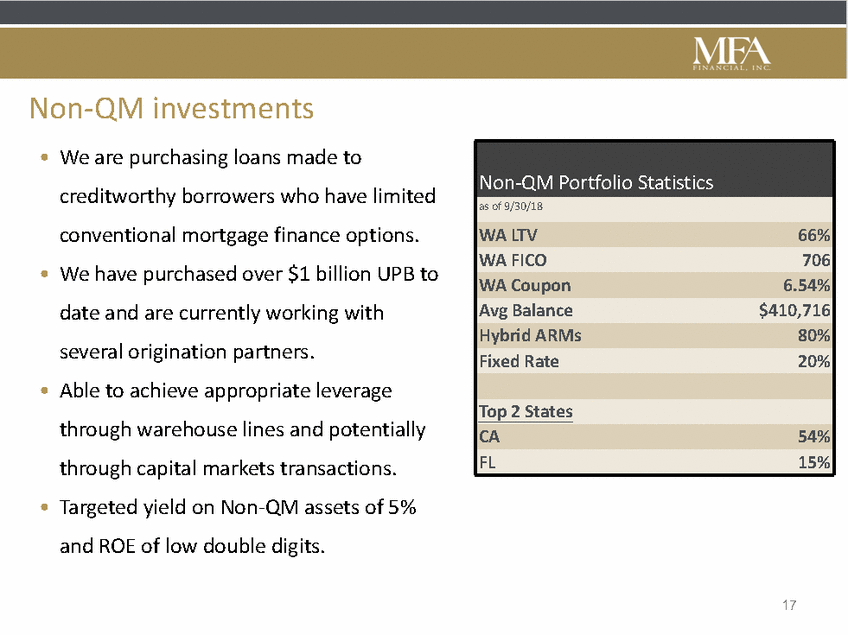
Business purpose loans - Rehabilitation and Single Family Rental (SFR) Loans We continue to grow our holdings of Rehabilitation and SFR loans as we expand our existing originator relationships and develop new ones. Since inception we have acquired (including undrawn commitments) close to $600mm of Rehabilitation and SFR loans. Rehabilitation loans (“Fix and Flip”) • Fixed rate short term loans collateralized by residential property. Term is generally less than 24 months. Borrower intends to rehabilitate property and resell. Non-owner occupied business purpose loans. Target yield of 7% to 8%. • • • SFR Loans • Hybrid and fixed rate loans collateralized by residential property/properties. Term is 30 years. Borrower intends to rent out property. Non-owner occupied business purpose loans. Target yield of 6%. • • • * WA ARV-LTV: Weighted average after repair loan to value ** WA DSCR: Weighted average debt service coverage ratio 18 SFR Portfolio Statistics (9/30/18) WA LTV68% WA FICO737 WA DSCR**1.51 WA Coupon6.3% 5/1 Hybrid Loans90% UPB$80mm Rehabilitation Portfolio Statistics (9/30/18) WA ARV-LTV*65% WA FICO707 WA Term13 WA Passthrough Rate7.51% UPB$329mm Undrawn Commitments$44mm
Summary • We remain active in the market and again grew the portfolio as we purchased more than $2.3 billion of investments in the third quarter. • We continue to expand our investment opportunity set within the residential mortgage space, utilizing the same disciplined approach to risk/reward as we have in the past. • Lengthy efforts to develop and cultivate originator relationships are expected to continue to produce growth in acquisitions of newly originated performing whole loans. • MFA’s asset management team is playing an active role in the servicing of our credit sensitive whole loans, leading to better results and improved returns. 19
Additional Information 20
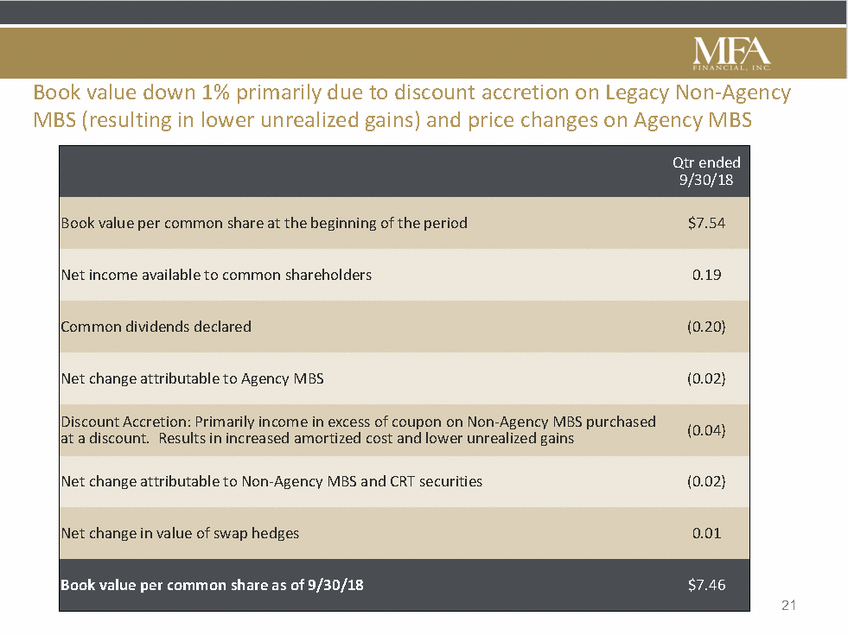
Book value down 1% primarily due to discount accretion on Legacy Non-Agency MBS (resulting in lower unrealized gains) and price changes on Agency MBS (0.04) at a discount. Results in increased amortized cost and lower unrealized gains 21 Qtr ended 9/30/18 Book value per common share at the beginning of the period$7.54 Net income available to common shareholders0.19 Common dividends declared(0.20) Net change attributable to Agency MBS(0.02) Discount Accretion: Primarily income in excess of coupon on Non-Agency MBS purchased Net change attributable to Non-Agency MBS and CRT securities(0.02) Net change in value of swap hedges0.01 Book value per common share as of 9/30/18$7.46
