Attached files
| file | filename |
|---|---|
| EX-99.1 - EXHIBIT 99.1 - CM Seven Star Acquisition Corp | s113828_ex99-1.htm |
| EX-2.1 - EXHIBIT 2.1 - CM Seven Star Acquisition Corp | s113828_ex2-1.htm |
| 8-K - FORM 8-K - CM Seven Star Acquisition Corp | s113828_8k.htm |
Exhibit 99.2

CM Seven Star Acquisition Corp. Business Combination with Kaixin Auto Group Investor Presentation November 2018

2 Disclaimer Important Notice Regarding Forward - Looking Statements and Non - GAAP Measures This presentation contains certain “forward - looking statements” within the meaning of the Securities Act of 1933 and the Securit ies Exchange Act of 1934, both as amended. Statements that are not historical facts, including statements about the pending trans act ion between CM Seven Star Acquisition Corporation ("CMSS"), Renren Inc. (“Renren”) and Kaixin Auto Group (" Kaixin ") and the transactions contemplated thereby, and the parties, perspectives and expectations, are forward - looking statements. Such statements include, but are not limited to, statements regarding the proposed transaction, including the anticipated initial enterprise va lue and post - closing equity value, the benefits of the proposed transaction, integration plans, expected synergies and revenue opportun ities, anticipated future financial and operating performance and results, including estimates for growth, the expected management and governance of the combined company, and the expected timing of the transactions. The words “expect,” “believe,” “estimate,” “intend,” “plan” and similar expressions indicate forward - looking statements. These forward - looking statements are not guarantee s of future performance and are subject to various risks and uncertainties, assumptions (including assumptions about general econ omi c, market, industry and operational factors), known or unknown, which could cause the actual results to vary materially from th ose indicated or anticipated. Such risks and uncertainties include, but are not limited to: ( i ) risks related to the expected timing and likelihood of completion of the pending transaction, including the risk that the transaction may not close due to one or more closing conditions to the tran sac tion not being satisfied or waived, such as regulatory approvals not being obtained, on a timely basis or otherwise, or that a go ver nmental entity prohibited, delayed or refused to grant approval for the consummation of the transaction or required certain condition s, limitations or restrictions in connection with such approvals; (ii) risks related to the ability of CMSS and Kaixin to successfully integrate the businesses; (iii) the occurrence of any event, change or other circumstances that could give rise to the termin ati on of the applicable transaction agreements; (iv) the risk that there may be a material adverse change with respect to the financia l p osition, performance, operations or prospects of Kaixin or CMSS; (v) risks related to disruption of management time from ongoing business operations due to the proposed transaction; (vi) the risk that any announcements relating to the proposed transaction could h ave adverse effects on the market price of CMSS’s common stock; (vii) the risk that the proposed transaction and its announcemen t c ould have an adverse effect on the ability of Kaixin and CMSS to retain customers and retain and hire key personnel and maintain relationships with their suppliers and customers and on their operating results and businesses generally; (viii) risks relate d t o successfully integrating the businesses of the companies, which may result in the combined company not operating as effective ly and efficiently as expected;

3 Disclaimer (ix) the risk that the combined company may be unable to achieve cost - cutting synergies or it may take longer than expected to achieve those synergies; and (x) risks associated with the financing of the proposed transaction. A further list and descript ion of risks and uncertainties can be found in CMSS’s Annual Report on Form 10 - K for the fiscal year ending December 31, 2017 filed with the SEC, in CMSS’s quarterly reports on Form 10 - Q filed with the SEC subsequent thereto and in the proxy statement on Schedule 14A that will be filed with the SEC by CMSS in connection with the proposed transaction, and other documents that the parties may fi le or furnish with the SEC, which you are encouraged to read. Should one or more of these risks or uncertainties materialize, or s hou ld underlying assumptions prove incorrect, actual results may vary materially from those indicated or anticipated by such forwar d - looking statements. Accordingly, you are cautioned not to place undue reliance on these forward - looking statements. Forward - look ing statements relate only to the date they were made, and CMSS, Renren, Kaixin , and their subsidiaries undertake no obligation to update forward - looking statements to reflect events or circumstances after the date they were made except as required by law or applicable regulation. This presentation includes non - GAAP financial measures including adjusted EBITDA and adjusted EBITDA margin. They are measures that provide supplemental information that CMSS and Kaixin believe are useful to analysts and investors to evaluate ongoing results of operations, when considered alongside GAAP measures such as net income, operating income and gross profit. Adjustd EBITDA excludes the financial impact of items management does not consider in assessing the ongoing operating performance of CMSS, Kaixin , or the combined company, and thereby facilitates review of its operating performance on a period - to - period basis. Other companies may have different capital structures or different lease terms, and comparability to the results of operations of C MSS , Kaixin or the combined company may be impacted by the effects of acquisition accounting on its depreciation and amortization. As a result of the effects of these factors and factors specific to other companies, CMSS and Kaixin believe adjusted EBITDA provides helpful information to analysts and investors to facilitate a comparison of their operating performance to that of other comp ani es. The presentation of adjusted EBITDA in these materials should not be construed as an inference that Kaixin’s future results will be unaffected by unusual or non - recurring items.

4 Disclaimer Additional Information and Where to Find It In connection with the transaction described herein, CMSS will file relevant materials with the Securities and Exchange Commi ssi on (the “SEC”), including a proxy statement on Schedule 14A. Promptly after filing its definitive proxy statement with the SEC, CMS S will mail the definitive proxy statement and a proxy card to each stockholder entitled to vote at the special meeting relating to the transaction. INVESTORS AND SECURITY HOLDERS OF CMSS ARE URGED TO READ THESE MATERIALS (INCLUDING ANY AMENDMENTS OR SUPPLEMENTS THERETO) AND ANY OTHER RELEVANT DOCUMENTS IN CONNECTION WITH THE TRANSACTION THAT CMSS WILL FILE WITH THE SEC WHEN THEY BECOME AVAILABLE BECAUSE THEY WILL CONTAIN IMPORTANT INFORMATION ABOUT CMSS, KAIXIN AND THE TRANSACTION. The preliminary proxy statement, the definitive proxy statement and other relevant materials in connecti on with the transaction (when they become available), and any other documents filed by CMSS with the SEC, may be obtained free o f charge at the SEC’s website (www.sec.gov ). Participants in Solicitation CMSS, Kaixin , Renren, and their respective directors, executive officers and employees and other persons may be deemed to be participants in the solicitation of proxies from the holders of CMSS common stock in respect of the proposed transaction. Inf orm ation about CMSS’s directors and executive officers and their ownership of CMSS’s common stock is set forth in CMSS’s Annual Report on Form 10 - K for the year ended December 31, 2017 filed with the SEC, as modified or supplemented by any Form 3 or Form 4 filed wit h the SEC since the date of such filing. Other information regarding the interests of the participants in the proxy solicitati on will be included in the proxy statement pertaining to the proposed transaction when it becomes available. These documents can be obta ine d free of charge from the sources indicated above.

5 Transaction Overview (1) CM Seven Star is sponsored by SVF, a Fund managed by CMAM, a wholly owned subsidiary of CMFH (2) As of June 30 th , 2018 (3) Does not Include approximately 4.7 million shares reserved under a management equity incentive plan, a portion of which will be issued at closing (4) Assumes no redemptions from trust proceeds (5) Based on management estimates Kaixin Auto Group A Leading Chinese Used Car Dealership Group owned by Renren, invested by Softbank CM Seven Star Acquisition Corp (1) $208 million in trust capital (2) Managed by Sing Wang and sponsored by a fund managed b y a subsidiary of China Minsheng Financial Holding Corporation + Key Transaction Highlights Kaixin Auto Group (NASD: KXIN) • Approximately 28.3 million shares initial consideration (3) • Renren rolling 100% of its equity (~46% pro - forma initial ownership ) (4) • Significant earnouts tied to financial and stock performance • 0.7x ’20E sales and 8.0x ’20E Adj. EBITDA (5) • Minimum $5 million cash closing condition • Expected closing Q1 ’19

Transaction Rationale 6 Exposure to Huge and Rapidly Growing Market 1 Focused on High Value Segment 2 Differentiated Business Model 3 Discounted Valuation to Comps 5 Earnouts Tied to Business and Stock Price Performance 6 Trust Proceeds to Fund Expansion 7 Experienced Management Team 4

7 China has the second largest car parc and the highest new car sales in the world, but the used car market remains underpenetrated by comparison to the US market The Chinese Used Car Market is in its Infancy 1 China New and Used Car Sales (in millions of units) United States New and Used Car Sales (in millions of units) Source: US Bureau of Transportation Statistics, China Association of Automobile Manufacturers, China National Bureau of Stat ist ics, iResearch . All data references passenger car only Total car parc (million of units , 2017) 200 185 Cars per capita (units, 2017) 0.6 0.1 New car sales (million of units, 2017) 17.3 24.7 Used car sales (million of units, 2017) 41.5 9.3 Used car to total car parc ratio 0.21 x 0.05 x Used car to new car sales ratio 2.4 x 0.4 x

8 Source: China Automobile Dealers Association, Chinabaogao , iResearch . All data references passenger car only Note: Historical RMB figures converted to USD at the annual average exchange rate for their respective year. FX used for converting estimate RMB figures of 6.93 RMB/1.00 USD • Growing new car sales and total car parc • Increasing vehicle change frequency • Rising average selling price • Improved quality control and pricing transparency helps consumer confidence • Improved access to financing with lower LTV • Relaxation of inter - provincial registrations High Growth Market Poised to Accelerate Key Growth Drivers: 1 Chinese used car sales market (in billions of USD)
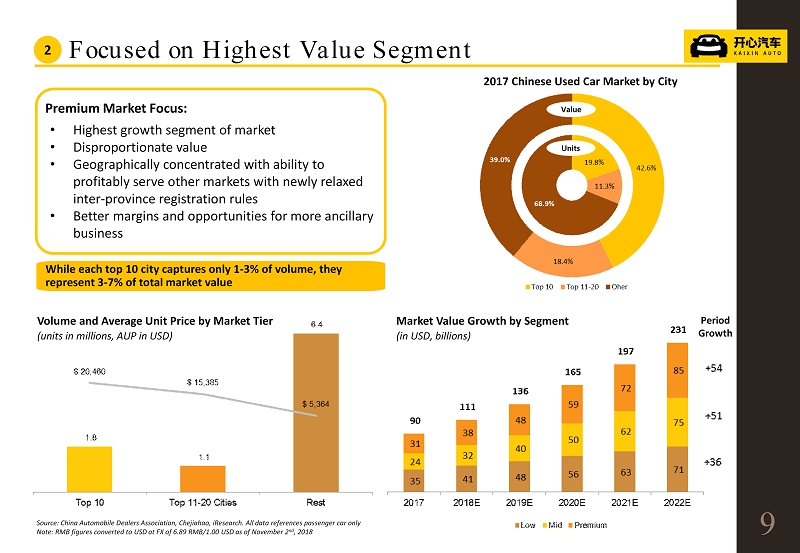
Market Value Growth by Segment (in USD, billions) 2017 Chinese Used Car Market by City Period Growth 9 Focused on Highest Value Segment • Highest growth segment of market • Disproportionate value • Geographically concentrated with ability to profitably serve other markets with newly relaxed inter - province registration rules • Better margins and opportunities for more ancillary business Premium Market Focus: While each top 10 city captures only 1 - 3% of volume, they represent 3 - 7% of total market value Volume and Average Unit Price by Market Tier (units in millions, AUP in USD) Source: China Automobile Dealers Association, Chejiahao , iResearch . All data references passenger car only Note: RMB figures converted to USD at FX of 6.89 RMB/1.00 USD as of November 2 nd , 2018 2
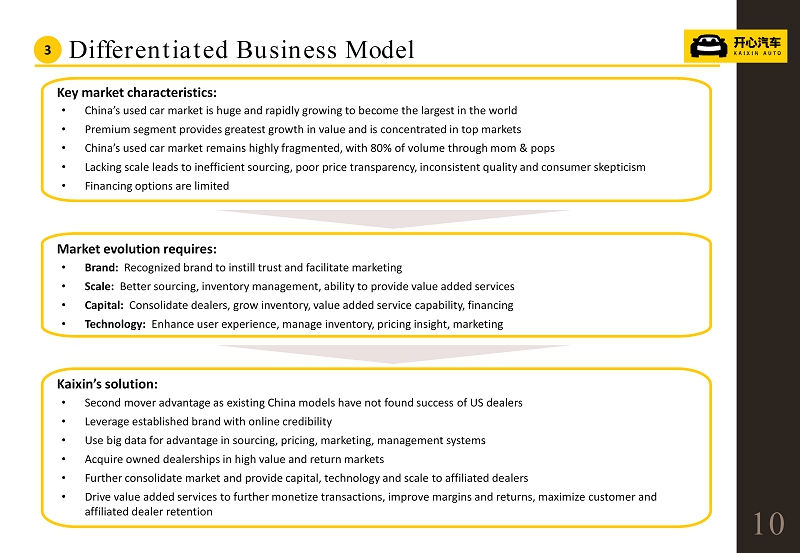
10 Differentiated Business Model • China’s used car market is huge and rapidly growing to become the largest in the world • Premium segment provides greatest growth in value and is concentrated in top markets • China’s used car market remains highly fragmented, with 80% of volume through mom & pops • Lacking scale leads to inefficient sourcing, poor price transparency, inconsistent quality and consumer skepticism • Financing options are limited Key market characteristics: • Brand: Recognized brand to instill trust and facilitate marketing • Scale: Better sourcing, inventory management, ability to provide value added services • Capital: Consolidate dealers, grow inventory, value added service capability, financing • Technology: Enhance user experience, manage inventory, pricing insight, marketing Market evolution requires: • Second mover advantage as existing China models have not found success of US dealers • Leverage established brand with online credibility • Use big data for advantage in sourcing, pricing, marketing, management systems • Acquire owned dealerships in high value and return markets • Further consolidate market and provide capital , technology and scale to affiliated dealers • Drive value added services to further monetize transactions, improve margins and returns, maximize customer and affiliated dealer retention Kaixin’s solution: 3

• Kaixin’s “internet gene” at core of network and big data to cross sell multiple high gross margin services • Provide consumer financing, insurance, and extended warranty products • Complete after - sale services increase revenue, margin and customer retention • Smaller dealerships affiliated within areas of KSOD • Independence with profit sharing • Network benefits from brand, scale, capital, systems, and experience • Dealers enjoy better sourcing, inventory management, profitability • Locations focused on key premium car markets • Aim to secure largest , most profitable, highest return • Partner with successful, local, and fully aligned entrepreneurs • Self - owned dealers operate as hubs for affiliates within specific region 11 Leading used car dealership for the premium segment Self - Owned Dealer (KSOD) Affiliated Network Dealer (KAND) Value Added and After Sale Services (VAASS) Business Model Overview 3

Transformed from a financing platform to a leading used car dealership network Tech - enabled financing platform Self - owned dealer network expansion Affiliated dealer network expansion 2015 2017 2018 Business model Renren Fenqi • Obtained leasing, factoring license • Initiated dealer floor plan financing • Listed first ABS on SSE Renren Jinkong • Expanded floor plan financing to 1,000+ dealers in 50+ cities Kaixin Auto • Determined to operate in the premium used car market by providing capital , tech and marketing support to dealers • Launched dealer JV partnership in top markets, operated as the largest premium used car dealership network in China Kaixin Auto • Commenced affiliated dealership model in Wuhan • Establishing expansion plan for national dealership network • Multiple capital sources to fund expansion Key takeaway from each stage 12 After sale services expansion 2019 Kaixin Auto • Consumer financing solutions and auto services operations fully launched with expansion plan leveraging existing KSOD / KAND hub - and - spoke • Repair and maintenance network to increase customer touch points • Focused business on premium used car sales • Optimized big data insight • Identified dealer network expansion strategy as growth driver • Gained deep insight on used car market across the country • Understood the importance of controlling the underlying financial asset • Capitalize on higher trade - in frequency of premium car segment with high - touch customer service Development Roadmap 3

• Leverage network and data to innovate and provide extended services • Expand products and services to a wider customer base and enhance customer satisfaction and loyalty • Fragmented market with ~ 200 , 000 dealers nationwide • Addressable market for consolidation ~ 150 , 000 , mostly mom and pop shops • Expand geographic reach, consolidate the market to gain share • Network covers 14 cities including key premium markets • Additional dealers to cover all key premium markets • Ramp up of unit sales through existing network and increase market share 13 Significant growth opportunities with current model Self - Owned Dealer (KSOD) Affiliated Network Dealer (KAND) Value Added and After Sale Services (VAASS) Note: Projections based on management budget . Converted to USD at 6.89 RMB/1.00 USD as of November 2 nd , 2018. Number of units sold, GMV, revenues , loans facilitated, and gross margin are rounded and approximately. GMV, units sold and gross margin do not include Jinan JV, to be disposed before closing of business combination 1. KOSD/KAND gross margin based on GMV for comparability purposes; KAND business revenue is recognized on net basis, thus the accounting gross margin is 100%, the numbers shown are margins based on GMV, of which Kaixin and KANDs share on the 80%/20% basis, respectively 2. VAASS' gross margin for the entire business division. Most of current business represents B2C financing, as an origination fe e, that carries 100% margin while after sales books +40% margin Size of Addressable Market Gross Margin ̴ 6.8 ̴ 14 ̴ 16 #of Units Sold (‘000) ̴ 5.6 % ̴ 6.1 % ̴ 6.5 % Current Short Term Medium Term ̴ 0.3 ̴ 23 ̴ 33 ̴ 6.0 % ̴ 6.5 % ̴ 6.5 % Current Short Term Medium Term ( 1 ) ( 2 ) ̴ 6.0 ̴ 80 ̴ 130 ̴ 95 % ̴ 88 % ̴ 90 % Current Short Term Medium Term Revenues ( USDmn ) Expansion Strategy 3 ̴ 400 ̴ 850 ̴ 965 GMV ( USDmn ) ̴ 16 ̴ 1 , 150 ̴ 1 , 570 ̴ 4 , 570 Loans facilitated (USDmn) ̴ 250 ̴ 2 , 735 ( 1 )
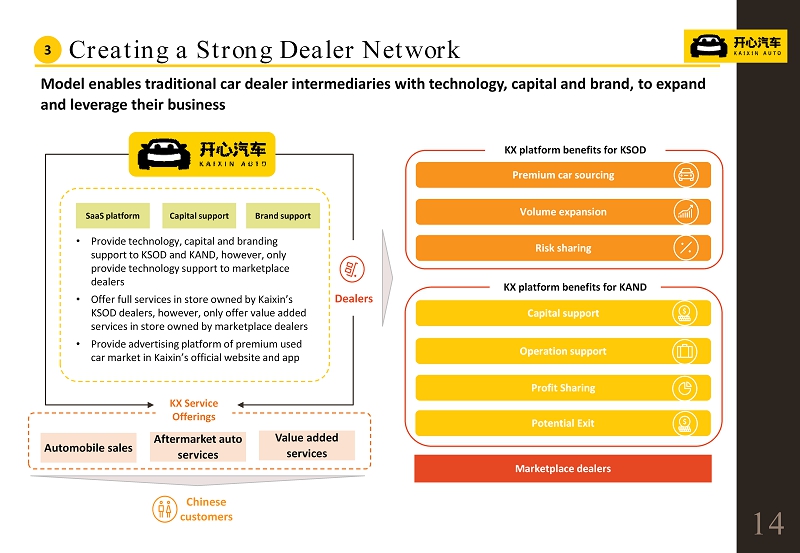
Model enables traditional car dealer intermediaries with technology, capital and brand, to expand and leverage their business 14 C hinese customers Creating a Strong Dealer Network Marketplace dealers Capital support Operation support Profit Sharing Premium car sourcing Volume expansion Risk sharing Potential Exit KX platform benefits for KAND KX platform benefits for KSOD • Provide technology, capital and branding support to KSOD and KAND, however, only provide technology support to marketplace dealers • Offer full services in store owned by Kaixin’s KSOD dealers, however, only offer value added services in store owned by marketplace dealers • Provide a dvertising platform of premium used car market in Kaixin’s official website and app SaaS platform Capital support Brand support KX Service Offerings Automobile sales Aftermarket auto services Value added services D ealers 3

Dealer selection process in a targeted city 2 3 Marketplace dealers • Connect with 50 - 200 dealers within each city through market coverage (e.g. floorplan financing, consumer auto loan, and insurance) • Obtain operational performance insight Large scale dealership partners • Select dealers with large scale operation: • Premium used car sales as major source of revenue • Good reputation from past cooperation, customers and market Shortlisted dealership partners • Understand dealers’ appetite for potential JV partnership • Perform due diligence on potential partner, including monthly revenue, gross and net profit, past cooperation with Kaixin , fleet size, turnover rate and other credit data 1 100 % of dealership network 30 % of dealership network 5 - 10 dealers per city KSOD • Form a new joint venture with the selected dealer 15 Self - Owned Dealership Selection Process 3

Sourcing Inspection Reconditioning Storage Sales Affiliated dealership model to tackle car sourcing and increase KSOD revenue 16 Source: Management information Involved KAND dealers Performed by KSOD dealers • KAND dealers supply KSOD with complementary car source, enlarging KSOD premium used car coverage and ensuring steady supply • KAND dealers receive percentage of profit upon successful sales • Premium cars sourced from KAND dealers sold through same district’s KSOD dealer KAND Profile • Local dealers with diverse source of premium used cars • Lack of inventory storage and management capabilities KSOD Profile • Strong financing ability through floor plan financing • Solid warehouse and inventory management system • Seasoned online sales platform and offline sales team Identified local dealers with strong sourcing capabilities through legacy financing business and KSOD cooperation • Build complementary car source coverage within KSOD operating region • Broaden Kaixin’s brand reach to nearby regions and cities for car sourcing and customers Affiliated Dealership Model 3

Kaixin offers dealers access to SaaS management technology and market data analysis 17 SaaS Enabled Platform • Enhance dealers’ management capabilities • Maintain central management over self - owned dealers Kaixin SaaS platform Inventory Sales Profile Management Financial Management Enterprise Management Core KX SaaS Components Big data analysis • Data source originates from multiple online used car sales platforms • Perform data analysis on specific market where dealers operate Pricing is highly dependent on quality of vehicle Accurate pricing insight to dealers based on market data • Supply of premium used car by brand over 2 weeks • Comparison of inventory with market supply Degree of influence of SaaS on business process Sourcing Inspection Reconditioning Storage Sales 3

Kaixin’s internet gene enhances the retail platform through its globally direct sales (SDR) engine and the development of a video online community for premium car owners 18 Ecommerce Platform 3 Customer acquisition flow Personalized News Feed based on Interest Real - time online help to find the right vehicle through chat, live video feed , virtual test drive Self - serve eCommerce platform with wide selection
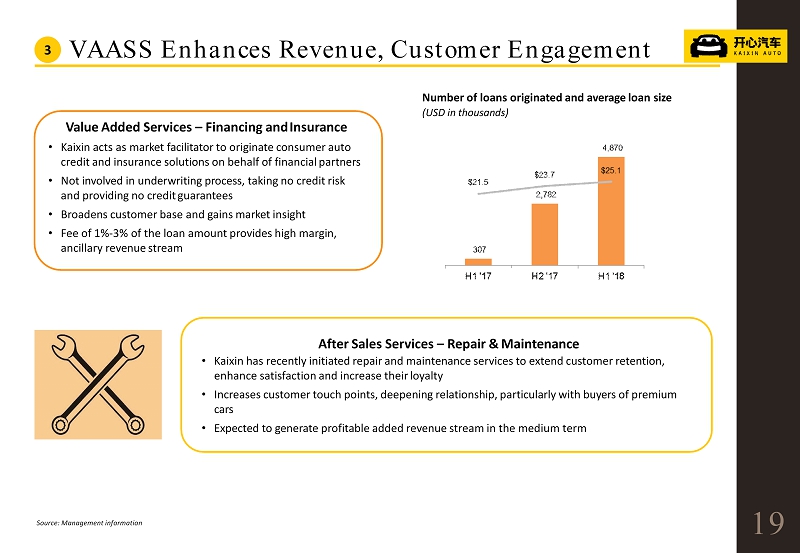
1 9 Number of loans originated and average loan size ( USD in thousands) VAASS Enhances Revenue, Customer Engagement Value Added Services – Financing and Insurance • Kaixin acts as market facilitator to originate consumer auto credit and insurance solutions on behalf of financial partners • Not involved in underwriting process, taking no credit risk and providing no credit guarantees • Broadens customer base and gains market insight • Fee of 1 % - 3 % of the loan amount provides high margin, ancillary revenue stream After Sales Services – Repair & Maintenance • Kaixin has recently initiated repair and maintenance services to extend customer retention, enhance satisfaction and increase their loyalty • Increases customer touch points, deepening relationship, particularly with buyers of premium cars • Expected to generate profitable added revenue stream in the medium term Source: Management information 3

20 Management Team: Internet + Auto + Finance Joseph Chen Chairman Chen Ji Chief Executive Officer Jun Ma Chief Technology O fficer Business Operations Capital Operations Support Operations Kai Wang Director Consumer Finance Li Cai Director Risk Management Jintao Yu Director Business Development Xiaoguang Li VP Marketing Lin Zhu VP Capital Markets Jinfeng Xie VP Sales Yan Yue Director Human Resources Thomas Ren Chief Financial Officer 4

21 Estimated Sources and Uses ( 1 , 2 ) (in millions of USD) 1. RMB figures converted to USD at FX of 6.89 RMB/ 1.00 USD as of November 2 nd , 2018 2. Assumes no redemptions from trust proceeds 3. As of June 30 th , 2018 4. Denotes approximately 4.7 million total shares reserved under a management equity incentive plan (only a portion of these shares will be issued at closing) 5. Includes earnout shares issued based on the achievement of financial projections Implied Initial Valuation ( 1 , 2 , 3 ) (in millions of USD, except per share data) Earnout ( 1 ) Ownership Summary (in millions of USD, share data in millions) Transaction Overview 5 , 6 • 2019 earnout shares will be awarded if during 15 month after the closing, the stock price > $ 13.00 (for any 60 days during a period of 90 trading days) • All earnout shares will be awarded if during 30 month after the closing, the stock price > $ 13.50 (for any 60 days during a period of 90 trading days) • Shares are issued proportionally between low/high thresholds Sources Uses Trust proceeds 208.4 Rollover equity 330.0 Stock consideratiion 330.0 Cash to balance sheet 198.6 Fees & expeneses 9.7 Total sources $538.4 Total uses $538.4 ( 4 ) ( 3 ) Metric Threshold Shares Threshold Shares Revenue $725.7 1.95 - - Adj. EBITDA (low) 21.8 3.90 49.3 4.875 Adj. EBITDA (high) 29.0 7.80 69.7 9.750 2019 2020 Shares outstanding 61.4 Share price 10.00 Market cap $614.4 Total debt 50.6 Cash (210.8) Enterprise value $454.2 Transaction Multiples (5) 15.7 x'19E Adj. EBITDA ($35.2) 8.0 x'20E Adj. EBITDA ($81.3)

22 Source: Capital IQ at close of November 2 nd , 2018 1 . Adjusted EBITDA for Kaixin Comparable Valuation TEV/Sales 5 , 6 N/A N/A TEV/EBITDA ( 1 )

Key Metrics China U.S. Kaixin Car King Guazi Uxin Carmax 1 Carvana TAM (2017 A) 9.3mn units / USD87bn 39.2mn units / USD 764bn Valuation USD454mn N/A N/A c.USD1.9bn c.USD25.9 bn c.USD7.2bn Car Revenue Recognition KSOD: Gross KAND: Net Gross Net Net Gross Gross Gross Merchandise Value (2017A) USD95mn 2 N/A N/A GMV: USD6,641mn Used Car (2C): 40% Used Car (2B): 60% GMV: USD16,574mn Used Car: 87% Wholesale Car : 13% GMV: USD825mn Used Car : 97% Wholesale Car: 13% Revenue Breakdown (2017A) Revenue: USD117mn 2 Car Sales (2C): 76% Loan Financing: 23% Others: 1% N/A N/A Revenue: USD299mn Used Car (2C): 12% Used Car (2B): 27% 2C Loan Facilitation: 48% Others: 13% Revenue: USD16,637mn Used Car: 80% Wholesale Car : 12% Others: 8% Revenue: USD859mn Used Car: 93% Wholesale Car:3% Others: 4% 2018E - 2020E Revenue CAGR 57.0% N/A N/A 64.6% 6.9 % 65.4% Gross Merchandise Value Margin (2017A) KSOD: 5% - 6% 3 KAND: 6% - 6.5% 4 N/A N/A Used Car (2C): 3.0% 5 Used Car (2B): 0.9% Used Car: 10.9% Wholesale Car: 18.0% Used Car: 4.1 % Wholesale Car: 6.5 % Average selling price (2017A) USD51k/Car USD19k - 22k/Car c.USD10k/Car Overall: USD11k/Car Used Car (2C) : USD14k/Car Used Car (2B) : USD8k/Car Overall: USD15k/Car Used Car: USD20k/Car Wholesale Car: USD5k/Car Overall: USD16k/Car Used Car: USD18k/Car Wholesale Car: USD4k/Car Source : Company information, expert interviews, desktop research, Capital IQ market data as of November 2 nd , 2018 1. Fiscal year ends at February 28 th 2. Gross Merchandise Value and Revenue of Kaixin does not include Jinan JV, to be disposed before closing of business combination 3. GMV Margin of Kaixin represent normalized range ( 2017 was a ramp - up year) 4. KAND business revenue is recognized on net basis, thus the accounting gross margin is 100 %,. Numbers shown are margins based on GMV of which Kaixin and KANDs share on the 80 %/ 20 % basis, respectively 5. Uxin’s gross margin includes the result of its 2 C loan facilitation business in which Uxin takes credit risk by providing guarantee on full repayment of principal and accrued and unpaid interest to its financing par tn ers 23 Comparable Analysis 5 , 6

2 4 Units Sold (in units, thousands) Number of Locations (in units) Revenues (in millions of USD) Gross Profit (in millions of USD) Adj. EBITDA (in millions of USD) Key Operating & Financial Metrics A verage U nit P rice (in thousands of USD) Source: Projections are based on m anagement budget and converted to USD at the exchange rate of RMB 6.93 /USD 1.00 Note: Projection assumptions of Kaixin do not include Jinan JV, to be disposed before closing of business combination
Investment Summary 25 • Largest player in premium pre - owned car segment with huge and rapid growth potential in this industry • Highly scalable business model through “Affiliate Network” powers growth • Well positioned to capitalize on growth in large cities and also expand to smaller markets – goal to establish nationwide dealer network • Technology platform optimizes dealer operations and utilizes big data to provide insight into market dynamics and identify opportunities • Significant opportunity for robust growth in revenue at attractive margin translates into profitable growth in 2019 Source: Management