Attached files
| file | filename |
|---|---|
| EX-99.1 - PRESS RELEASE - WestRock Co | exh_991.htm |
| 8-K - FORM 8-K - WestRock Co | f8k_110518.htm |
EXHIBIT 99.2

Q4 FY18 Results November 5, 2018 Steve Voorhees Chief Executive Officer Ward Dickson Chief Financial Officer Jeff Chalovich President, Corrugated Packaging Bob Feeser President, Consumer Packaging

2 Forward Looking Statements This presentation contains forward - looking statements within the meaning of the Private Securities Litigation Reform Act of 1995 , including but not limited to the statements on the slides entitled “Record FY18 With Continued Momentum into FY19”, “Panama City Mill – Hurricane Impact”, “Brazil Mill Upgrade”, “Q4 FY18 Consumer Packaging Results”, “KapStone Acquisition”, “Q1 FY19 Sequential Guidance including KapStone”, “FY19 Capital Investment and Dividend”, “FY19 Financial Guidance including KapStone” , “ WestRock: Creating Shareholder Value”, and “FY19 Additional Guidance Assumptions” that give guidance or estimates for future periods as well as statements regarding, among other things, ou r initial damage estimate from Hurricane Michael of approximately $100 million; that we expect linerboard production (353k tons) to return to full operation during the month of November and t hat the market pulp production line (292k tons) will be limited to 50% production for the next six months; that the Brazil mill upgrade is expected to (a) involve a capital investment of $345 mill ion with an after - tax IRR in the high teens, (b) increase energy self - sufficiency from approximately 55% to 85%, (c) change fiber mix from approx. 80% virgin / 20% recycled to 100% virgin fiber a nd replace expensive local recovered fiber with low cost eucalyptus, (d) allow us to source approximately half of our fiber needs from own land and the balance from short and long term contracts , ( e) increase capacity to approximately 750k tons/y, up from approximately 520 tons/y and (e) be completed during the first half of calendar 2021; that we expect to increase our corrugat ed adjusted segment EBITDA in Brazil by more than 125% and adjusted segment EBITDA margins to more than 30% after we complete the mill upgrade and Porto Feliz project; that we expect to achieve full 100k ton run rate of MPS internalization during the first half of FY19; that the KapStone acquisition ( i ) broadens WestRock’s portfolio of differentiated paper and packaging solutions with the addition of attractive paper grades and distribution capabilities, (ii) strengthens WestRock’s presence on the West Coast, (iii) increases mix of virgin fiber based paper in WestRock’s paper portfo lio , (iv) is expected to yield approximately $200 million in synergies and performance improvements, (v) expected to be immediately accretive to our adjusted earnings and cash flow, inclusive of p urc hase accounting adjustments and (vi) will result in the combined company being positioned to generate strong cash flow that is expected to allow our leverage ratio to return to 2.25x to 2.50 x t arget during FY 2020; that we expect adjusted segment EBITDA of $737 to $767 million in the first quarter of fiscal 2019, and that this forecast will be driven by, among other items, the items listed on slide 12; that our FY19 capital investment and dividend are as presented on slide 13; that in fiscal 2019 we expect >16% net sales growth (to >$19 billion), >24% adjusted segment EBITDA gr owt h (to approximately $3.6 billion), approximately 12% growth in adjusted EPS to approximately $4.60 per share and to increase adjusted operating cash flow by approximately $100 million to a ppr oximately $2.55 billion, and that these forecasts will be driven by, among other items, the items listed on slide 14; that the KapStone acquisition enhances our geographical presence, extends ou r p roduct and solution offerings and provides significant opportunity for synergies and value creation; that we have sustained momentum into FY19; and that our FY19 additional guidance assumption s a nd mill maintenance schedule are as presented on slide 19. Forward - looking statements are based on our current expectations, beliefs, plans or forecasts and are typically identified by wo rds or phrases such as "may," "will," "could," "should," "would," "anticipate," "estimate," "expect," "project," "intend," "plan," "believe," "target," "prospects," "potential" and "forecast, " a nd other words, terms and phrases of similar meaning. Forward - looking statements involve estimates, expectations, projections, goals, forecasts, assumptions, risks and uncertainties. WestRock cau tio ns readers that a forward - looking statement is not a guarantee of future performance and that actual results could differ materially from those contained in the forward - looking statement. WestRo ck’s businesses are subject to a number of general risks that would affect any such forward - looking statements, including, among others, decreases in demand for their products; increases in energy , raw materials, shipping and capital equipment costs; reduced supply of raw materials; fluctuations in selling prices and volumes; intense competition; the potential loss of certain custo mer s; the scope, costs, timing and impact of any restructuring of our operations and corporate and tax structure; the occurrence of a natural disaster, such as hurricanes or other unanticipated p rob lems, such as labor difficulties, equipment failure or unscheduled maintenance and repair, which could result in operational disruptions of varied duration; our desire or ability to continue t o r epurchase company stock; the impact of the Tax Cuts and Jobs Act; risks associated with integrating KapStone’s operations into our operations and our ability to realize anticipated synergies and pr odu ctivity improvements; and adverse changes in general market and industry conditions. Such risks and other factors that may impact management's assumptions are more particularly described in ou r filings with the Securities and Exchange Commission, including in Item 1A under the caption "Risk Factors" in our Annual Report on Form 10 - K for the year ended September 30, 2017 and our Form 10 - Q for the quarter ended June 30, 2018. The information contained herein speaks as of the date hereof and WestRock does not have or undertake any obligation to update or revise its for ward - looking statements, whether as a result of new information, future events or otherwise.
3 Disclaimer; Non - GAAP Financial Measures We may from time to time be in possession of certain information regarding WestRock that applicable law would not require us to disclose to the public in the ordinary course of business, but would require us to disclose if we were engaged in the purchase or sale of our securitie s. This presentation shall not be considered to be part of any solicitation of an offer to buy or sell WestRock securities. This presentation also may not i ncl ude all of the information regarding WestRock that you may need to make an investment decision regarding WestRock securities. Any investment decision sh oul d be made on the basis of the total mix of information regarding WestRock that is publicly available as of the date of the investment decision . We report our financial results in accordance with accounting principles generally accepted in the United States ("GAAP"). Ho wev er, management believes certain non - GAAP financial measures provide users with additional meaningful financial information that should be consi dered when assessing our ongoing performance. Management also uses these non - GAAP financial measures in making financial, operating and planning deci sions and in evaluating our performance. Non - GAAP financial measures should be viewed in addition to, and not as an alternative for, our GAAP results. The non - GAAP financial measures we present may differ from similarly captioned measures presented by other companies. See the Appendi x f or details about these non - GAAP financial measures, as well as the required reconciliations.
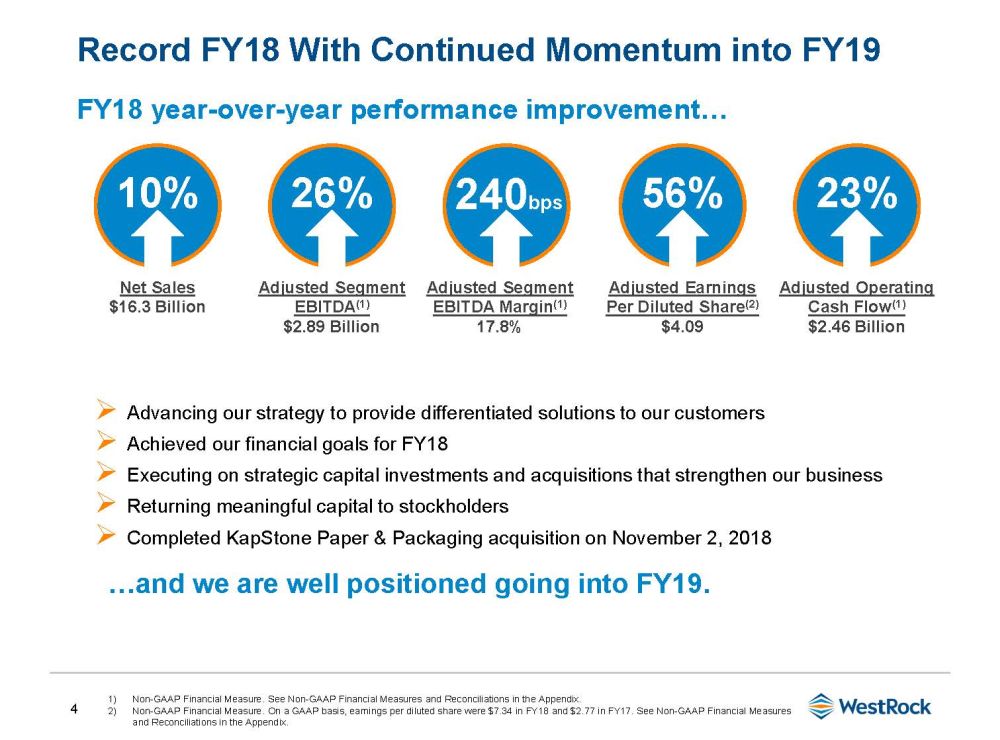
4 Record FY18 With Continued Momentum into FY19 FY18 year - over - year performance improvement… …and we are well positioned going into FY19. » Advancing our strategy to provide differentiated solutions to our customers » Achieved our financial goals for FY18 » Executing on strategic capital investments and acquisitions that strengthen our business » Returning meaningful capital to stockholders » Completed KapStone Paper & Packaging acquisition on November 2, 2018 10% 26% 56% 23% Net Sales $16.3 Billion Adjusted Segment EBITDA (1) $2.89 Billion Adjusted Earnings Per Diluted Share (2) $4.09 Adjusted Operating Cash Flow (1) $2.46 Billion 240 bps Adjusted Segment EBITDA Margin (1) 17.8% 1) Non - GAAP Financial Measure. See Non - GAAP Financial Measures and Reconciliations in the Appendix. 2) Non - GAAP Financial Measure. On a GAAP basis, earnings per diluted share were $7.34 in FY18 and $2.77 in FY17. See Non - GAAP Finan cial Measures and Reconciliations in the Appendix.
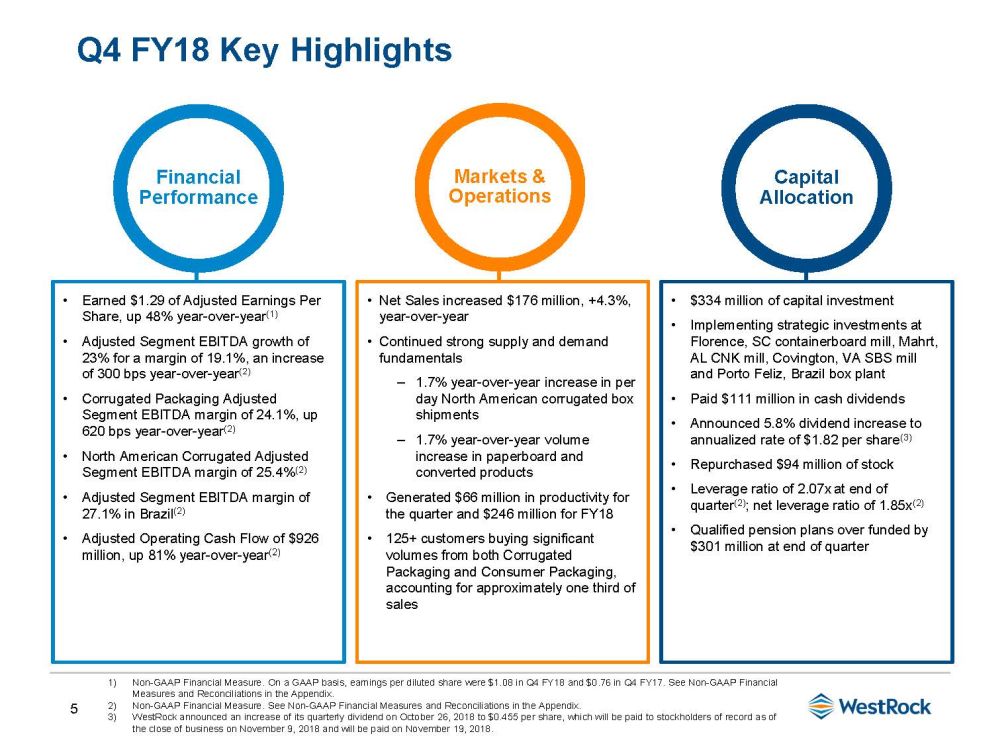
5 Q4 FY18 Key Highlights • Net Sales increased $176 million, +4.3%, year - over - year • Continued strong supply and demand fundamentals ‒ 1.7% year - over - year increase in per day North American corrugated box shipments ‒ 1.7% year - over - year volume increase in paperboard and converted products • Generated $66 million in productivity for the quarter and $246 million for FY18 • 125+ customers buying significant volumes from both Corrugated Packaging and Consumer Packaging, accounting for approximately one third of sales • $334 million of capital investment • Implementing strategic investments at Florence, SC containerboard mill, Mahrt, AL CNK mill, Covington, VA SBS mill and Porto Feliz , Brazil box plant • Paid $111 million in cash dividends • Announced 5.8% dividend increase to annualized rate of $1.82 per share (3) • Repurchased $94 million of stock • Leverage ratio of 2.07x at end of quarter (2) ; net leverage ratio of 1.85x (2) • Qualified pension plans over funded by $301 million at end of quarter • Earned $1.29 of Adjusted E arnings P er S hare, up 48 % year - over - year (1) • Adjusted Segment EBITDA growth of 23% for a margin of 19.1%, an increase of 300 bps year - over - year (2) • Corrugated Packaging Adjusted Segment EBITDA margin of 24.1%, up 620 bps year - over - year (2) • North American Corrugated Adjusted Segment EBITDA margin of 25.4% (2) • Adjusted Segment EBITDA margin of 27.1% in Brazil (2) • Adjusted Operating Cash Flow of $926 million, up 81% year - over - year (2) Financial Performance Markets & Operations Capital Allocation 1) Non - GAAP Financial Measure. On a GAAP basis, earnings per diluted share were $1.08 in Q4 FY18 and $0.76 in Q4 FY17. See Non - GAAP Financial Measures and Reconciliations in the Appendix. 2) Non - GAAP Financial Measure. See Non - GAAP Financial Measures and Reconciliations in the Appendix. 3) WestRock announced an increase of its quarterly dividend on October 26, 2018 to $0.455 per share, which will be paid to stock hol ders of record as of the close of business on November 9, 2018 and will be paid on November 19, 2018.

6 Q4 FY18 WestRock Consolidated Results 1) Non - GAAP Financial Measure. See Non - GAAP Financial Measures and Reconciliations in the Appendix. 2) Non - GAAP Financial Measure. On a GAAP basis, earnings per diluted share was $1.08 in Q4 FY18 and $0.76 in Q4 FY17. See Non - GAAP Financial Measures and Reconciliations in the Appendix. Highlights: • Adjusted earnings per diluted share of $1.29 (2) , up 48% year - over - year • Adjusted Segment EBITDA up 23% year - over - year; margin increased 300 bps to 19.1% (1) • Margins improved due to higher volume, improved price / mix and productivity • Adjusted Operating Cash Flow (1) increased $413 million, +81%, year - over - year • Leverage ratio of 2.07x at end of quarter (1) Financial Performance ($ in millions, except percentages and per share items) Q4 FY18 Q4 FY17 Net Sales $4,237 $4,061 Adjusted Segment Income (1) $493 $353 Adjusted Segment EBITDA (1) $807 $654 % Margin (1) 19.1% 16.1% Adjusted Earnings Per Diluted Share (2) $1.29 $0.87 Adjusted Operating Cash Flow (1) $926 $513 Adjusted Segment EBITDA (1) ($ in millions) +23% $654 19 124 66 $807 (34) (10) (12) Q4 FY17 Volume Price / Mix Inflation Productivity Hurricane Florence FX & Other Q4 FY18

7 Q4 FY18 Corrugated Packaging Results 1) Non - GAAP Financial Measure. See Non - GAAP Financial Measures and Reconciliations in the Appendix. Segment Highlights: • Adjusted Segment EBITDA up 42% year - over - year (1) North America: • 620 bps improvement in Adjusted Segment EBITDA margins (1) • Box shipments up 1.7% per day year - over - year due to gains across various segments, including e - commerce and retail • Total North American shipments up 4% year - over - year • Integration rate of 73%; FY18 integration rate of 75% Brazil: • Adjusted Segment EBITDA margin of 27.1% (1) Key Bridge Variances: • Volume : Total segment shipments up driven by higher export containerboard and box volume • Price / Mix : Flow through of previously published PPW price increases • E/M/F : Higher costs in freight, virgin fiber and chemicals, more than offset by favorable OCC pricing • Productivity : Driven by capital investments, supply chain optimization, procurement savings and acquisition integration • Hurricane : Lost production and weather - related input cost inflation • Other : Impact of prior year asset retirement adjustment; lower Recycling profitability due to lower OCC prices Financial Performance ($ in millions, except percentages) Q4 FY18 Q4 FY17 Segment Sales $2,390 $2,239 Adjusted Segment Income (1) $378 $229 Adjusted Segment EBITDA (1) $548 $386 % Margin (1) 24.1% 17.9% North American Adjusted Segment EBITDA Margin (1) 25.4% 19.2% Brazil Adjusted Segment EBITDA Margin (1) 27.1% 18.4% Adjusted Segment EBITDA (1) ($ in millions) +42% $386 $548 26 113 41 34 (20) (8) (5) (19) Q4 FY17 Volume Price / Mix Energy / Materials / Freight Wage and Other Inflation Produc- tivity Hurricane Florence FX Other Q4 FY18

8 • Mill sustained extensive damage from Hurricane Michael in October 2018 • No employees or family members were injured as a result of the storm • Initial damage estimate for property and business interruption approximately $100 million; $15 million insurance deductible • Expect linerboard production (353k tons/y) to return to full operation during the month of November • Market pulp production line (292k tons/y) limited to 50% production for the next 6 months • Company supporting our mill team and the Panama City community as the recovery continues • Ensuring that our customers are properly supported Panama City Mill – Hurricane Impact

9 Project Overview: • Achieving full potential of the Tres Barras mill by adding virgin pulping capacity, biomass power boiler, turbine generator and debottlenecking the paper machines • Expected capital investment of $345 million USD, with after - tax IRR in the high teens • Expected project results ‒ Increases energy self - sufficiency from approx. 55% to 85% ‒ Fiber mix improves from approx. 80% virgin / 20% recycled to 100% virgin fiber; replaces expensive local recovered fiber with low cost eucalyptus ‒ Approx. half of our fiber needs sourced from our own land and balance under short and long term contracts ‒ Production increases to approx. 750k tons per year from approx. 520K tons per year (supporting Porto Feliz project and sustaining sales to third parties in the region) ‒ Upgrade expected to be completed during first half of calendar 2021 Cumulative Impact on WestRock Brazil Business • After completion of the Tres Barras and Porto Feliz projects, Brazil Corrugated Adjusted Segment EBITDA is expected to increase by more than 125% and Adjusted Segment EBITDA margins to more than 30% Brazil Mill Upgrade

10 Q4 FY18 Consumer Packaging Results 1) Non - GAAP Financial Measure. See Non - GAAP Financial Measures and Reconciliations in the Appendix. Segment Highlights: • Solid demand in paperboard end markets • Growth in food service, liquid packaging, beverage, healthcare and retail food • Shipments of paperboard and converted products increased 1.7% • Operating rates above 98% in all grades • Strong Consumer backlogs: SBS: 5 - 6 weeks CNK: 5 - 6 weeks CRB: 5 - 6 weeks • MPS internalization continuing and expect to achieve full 100k ton run rate during first half of FY19 Key Bridge Variances: • Price (Paperboard and Converted Products) : Flow through of previously published PPW price increases • Other Volume, Price/Mix : Higher paperboard and converted products volumes more than offset by lower pulp volume and display sales • E/M/F : Inflation in wood, freight, chemicals, partially offset by lower recycled fiber • Productivity : Improvements from procurement savings, return - generating capital projects, ongoing performance improvement initiatives and internalization of tons Financial Performance ($ in millions, except percentages) Q4 FY18 Q4 FY17 Segment Sales $1,879 $1,866 Adjusted Segment Income (1) $133 $137 Adjusted Segment EBITDA (1) $275 $280 % Margin (1) 14.6% 15.0% Adjusted Segment EBITDA (1) ($ in millions) $280 18 43 3 $275 (14) (34) (21) Q4 FY17 Price (Paperboard & Converted Products) Other Volume / Price / Mix Energy / Materials / Freight Wage and Other Inflation Produc- tivity Other Q4 FY18

11 Compelling Strategic Combination • Broadens WestRock’s portfolio of differentiated paper and packaging solutions with the addition of attractive paper grades and distribution capabilities • Strengthens WestRock’s presence on the West Coast in both our integrated virgin mill and converting assets • Increases mix of virgin fiber based paper in WestRock’s paper portfolio • Expect approximately $200 million in synergies and performance improvements Attractive Financial Profile • Purchase price of $35 per share for a total enterprise value of approximately $4.8 billion; approximately 6.4x (1) Adjusted EBITDA (2) multiple including anticipated synergy and performance improvements • Expected to be immediately accretive to WestRock’s adjusted earnings and cash flow, inclusive of purchase accounting adjustments • Combined LTM leverage at 9/30/18 of approximately 3.0x excluding the impact of synergies and performance improvements • Combined company will be positioned to generate strong cash flow that is expected to allow our leverage ratio to return to 2.25x to 2.50x target during FY 2020 KapStone Acquisition 1) Based on KapStone’s TTM adjusted EBITDA performance as of September 30, 2018 2) Non - GAAP Financial Measure.

12 Q1 FY19 Sequential Guidance including KapStone 1) Non - GAAP Financial Measure. See Non - GAAP Financial Measures and Forward - looking Guidance in the Appendix. Q4 FY18 Adjusted Segment EBITDA Associated with Adjusted EPS (1) $802 million Items Impacting Q1 FY19 Adjusted Segment EBITDA (1) KapStone (closed Nov 2) $90 million Corrugated and Consumer Price $(70) to $(40) million Volume / Mix Maintenance Downtime & Other (60k tons of incremental maintenance downtime on legacy WestRock mills) $(20) million Group Insurance, Pension Income & Other $(20) million Lost Production resulting from Hurricane Michael $(45) million Total of Items Impacting Q1 FY19 Adjusted Segment EBITDA (1) $(65) to $(35) million Q1 FY19 Adjusted Segment EBITDA (1) $737 to $767 million Other Sequential Adjusting EPS Items: Negative approximately $(0.29) per share - Increased depreciation & amortization expense of $(0.15) - Higher interest expense of $(0.09) - Higher number of shares outstanding of $(0.01); average shares outstanding of 262.7 million - Tax rate of approximately 24.5% on adjusted income, up sequentially from 20.8% Sequential pricing benefit more than offset by seasonally lower consumer volumes and two fewer shipping days WestRock business prior to KapStone

13 $1.50 $1.60 $1.72 $1.82 FY16 FY17 FY18 FY19E Florence, SC Porto Feliz & Tres Barras Mahrt, AL & Covington, VA FY19 Capital Investment and Dividend Total Capex Approximately $1.5 Billion $500 Million Strategic Capital 1) WestRock announced an increase of its quarterly dividend on October 26, 2018 to $0.455 per share, which will be paid to stock hol ders of record as of the close of business on November 9, 2018 and will be paid on November 19, 2018. (1) Annualized Dividend Per Share Current Dividend Yield Above 4% $1.0 Billion Base Capital (Maintenance & Return Generating)

14 FY19 Financial Guidance including KapStone Net Sales > $19 billion vs FY18 of $16.3 billion Adj. Segment EBITDA (1) approx. $3.6 b illion vs. FY18 of $2.89 billion Adjusted EPS (2) a pprox . $4.60 vs. FY18 of $4.09 Adjusted Operating Cash Flow (1) approx. $2.55 billion vs. FY18 of $2.46 billion » Full year impact of previously published price increases in both segments » Continued N.A. Corrugated Box Volume growth excluding KapStone » KapStone contributes approximately $3.2 billion (11 months) » Approximately $(550) million lower sales from Recycling accounting change and elimination of KapStone intercompany sales » Approximately $(100) million lower sales from L&D wind down » KapStone contributes greater than $550 million of Adjusted EBITDA (1) including synergies (11 months) » Price / volume / mix contributes greater than $400 million » Inflation and higher maintenance downtime related to strategic capital projects approximately $(130) million greater than productivity » Hurricane Michael impact, lower pension income, FX and other $(100) million of additional expense » Incremental depreciation and amortization of approximately $0.80 per share (11 Months) » Incremental interest expense of approximately $0.50 per share (11 months) » FY19 effective tax rate of approx. 24% to 25% » Approximately 265 million shares outstanding for FY19 » Additional EBITDA offset by: » Cash tax rate of approximately 23% in FY19 compared to less than 10% in FY18 » Higher interest rates and acquisition related interest expense » L&D cash proceeds of approximately $50 million in FY19 compared to $130 million in FY18 >16% >24% Approx. 12% Approx. $100M 1) Non - GAAP Financial Measure. See Non - GAAP Financial Measures and Reconciliations in the Appendix. 2) Non - GAAP Financial Measure. On a GAAP basis, earnings per diluted share was $1.08 in Q4 FY18 and $0.76 in Q4 FY17. See Non - GAAP Financial Measures and Reconciliations in the Appendix.

15 WestRock: Creating Shareholder Value x FY18 saw strong execution, strong results and productive deployment of our capital x Our market conditions remain favorable: x Solid demand across most markets x High operating rates x Strong backlogs x Addition of KapStone: x Enhances geographical presence x Extends product and solution offerings x Provides significant opportunity for synergies and value creation x Sustained momentum into FY19 OUTSTANDING EXECUTION & DELIVERY DISCIPLINED CAPITAL ALLOCATION BROAD PORTFOLIO OF DIFFERENTIATED SOLUTIONS

Appendix

17 Non - GAAP Financial Measures Adjusted Earnings Per Diluted Share We use the non - GAAP financial measure “adjusted earnings per diluted share,” also referred to as “adjusted earnings per share” o r “Adjusted EPS” because we believe this measure provides our board of directors, investors, potential investors, securities analysts and ot hers with useful information to evaluate our performance since it excludes restructuring and other costs, net, and other specific items that w e b elieve are not indicative of our ongoing operating results. Our management and board of directors use this information to evaluate our perfo rma nce relative to other periods. We believe the most directly comparable GAAP measure is Earnings per diluted share. Adjusted Operating Cash Flow We use the non - GAAP financial measure “adjusted operating cash flow” because we believe this measure provides our board of direc tors, investors, potential investors, securities analysts and others with useful information to evaluate our performance relative t o o ther periods because it excludes restructuring and other costs, net of tax, that we believe are not indicative of our ongoing operating re sul ts. While this measure is similar to adjusted free cash flow, we believe it provides greater comparability across periods when capital expen dit ures are changing since it excludes an adjustment for capital expenditures. While this measure is similar to adjusted free cash flow, we believe it provides greater comparability across periods when capital expenditures are changing since it excludes an adjustment for capi tal expenditures. We believe the most directly comparable GAAP measure is net cash provided by operating activities. Adjusted Segment EBITDA and Adjusted Segment EBITDA Margins We use the non - GAAP financial measures “adjusted segment EBITDA” and “adjusted segment EBITDA margins”, along with other factors , to evaluate our segment performance against our peers. We believe that investors also use these measures to evaluate our perform anc e relative to our peers. We calculate adjusted segment EBITDA for each segment by adding that segment’s adjusted segment income to its d epr eciation, depletion and amortization. We calculate adjusted segment EBITDA margin for each segment by dividing that segment’s adjusted seg ment EBITDA by its adjusted segment sales.

18 Non - GAAP Financial Measures (cont.) Leverage Ratio and Net Leverage Ratio We use the non - GAAP financial measures “leverage ratio” and “net leverage ratio” as measurements of our operating performance an d to compare to our publicly disclosed target leverage ratio. We believe investors use each measure to evaluate our available borr owi ng capacity – in the case of “net leverage ratio”, adjusted for cash and cash equivalents. We define leverage ratio as our Total Funded Deb t d ivided by our Credit Agreement EBITDA, each of which term is defined in our credit agreement, dated July 1, 2015. Borrowing capacity under our credit agreement depends on, in addition to other measures, the Credit Agreement Debt/EBITDA ratio or the leverage ratio. As of Sept emb er 30, 2018, our leverage ratio was 2.07 times. While the leverage ratio under our credit agreement determines the credit spread on our debt, we are not subject to a leverage ratio cap. Our credit agreement is subject to a Debt to Capitalization and Consolidated Interest Co ver age Ratio, as defined therein. We define net leverage ratio as the product of our Total Funded Debt minus cash and cash equivalents divided by our Credit Agreement EBITDA. As of September 30, 2018, our net leverage ratio was 1.85 times. Forward - looking Guidance We are not providing a reconciliation of forward - looking non - GAAP financial measures to the most directly comparable U.S. GAAP m easure because we are unable to predict with reasonable certainty the ultimate outcome of certain significant items without unreason abl e effort. These items include, but are not limited to, merger and acquisition - related expenses, restructuring expenses, asset impairments, litig ation settlements, changes to contingent consideration and certain other gains or losses. These items are uncertain, depend on various factors, and could have a material impact on U.S. GAAP reported results for the guidance period. Adjusted Tax Rate We use the non - GAAP financial measure “Adjusted Tax Rate”. We believe this non - GAAP financial measure is useful because it adjus ts our GAAP effective tax rate to exclude the impact of restructuring and other costs, net, and other specific items that management be lieves are not indicative of the ongoing operating results of the business. “Adjusted Tax Rate” is calculated as “Adjusted Tax Expense” divi ded by “Adjusted Pre - Tax Income”. We believe that the most directly comparable GAAP measures to Adjusted Tax Expense and Adjusted Pre - Tax Income are “Income tax (expense) benefit” and “Income before income taxes”, respectively.

19 FY19 Additional Guidance Assumptions Other Guidance Assumptions Depreciation & Amortization Approx. $1.50 - $1.55 billion FY19 Adjusted EPS (1) Profile Approx. 38% 1H / 62% 2H Interest Expense Approx. $505 - $515 million Interest Income Approx. $55 - $60 million Effective Adjusted Book Tax Rate 24% to 25% Adjusted Cash Tax Rate Approx. 23% Share Count Approx. 265 million 1) Non - GAAP Financial Measure. 2) FY19 amounts are forecasts. North American Corrugated Packaging Consumer Packaging Mill Maintenance Schedule (2) (tons in thousands) Q1 Q2 Q3 Q4 Full Year WestRock 41 84 101 0 226 FY19 KapStone 9 1 31 4 45 Combined 50 85 132 4 271 FY18 WestRock 73 35 125 0 233 Q1 Q2 Q3 Q4 Full Year FY19 19 41 56 3 119 FY18 28 11 8 0 47

20 Adjusted Segment EBITDA Associated with Adjusted Earnings Per Share (AEPS) ($ in millions, except per share amount) Q4 FY18 Adjusted Segment EBITDA 807.3$ Adjustments excluded from Adjusted EPS: Land and Development Segment EBITDA 2.7 Losses at closed plants and transition costs 1.3 Consumer Packaging segment acquisition reserve adjustment (10.1) Other 0.5 Adjusted Segment EBITDA associated with AEPS 801.7 Depreciation, amortization and depletion (314.3) Accelerated depreciation on major capital projects and Land and Development depreciation and amortization 7.9 Interest expense, net (74.0) Interest expense adjustments 3.5 Other Income (expense) adjustments (0.3) Adjusted pre-tax income 424.5 Adjusted taxes (88.5) 336.0 Noncontrolling interest (0.4) Adjusted net income 335.6$ Diluted weighted average shares outstanding 259.2 Adjusted earnings per diluted share 1.29$
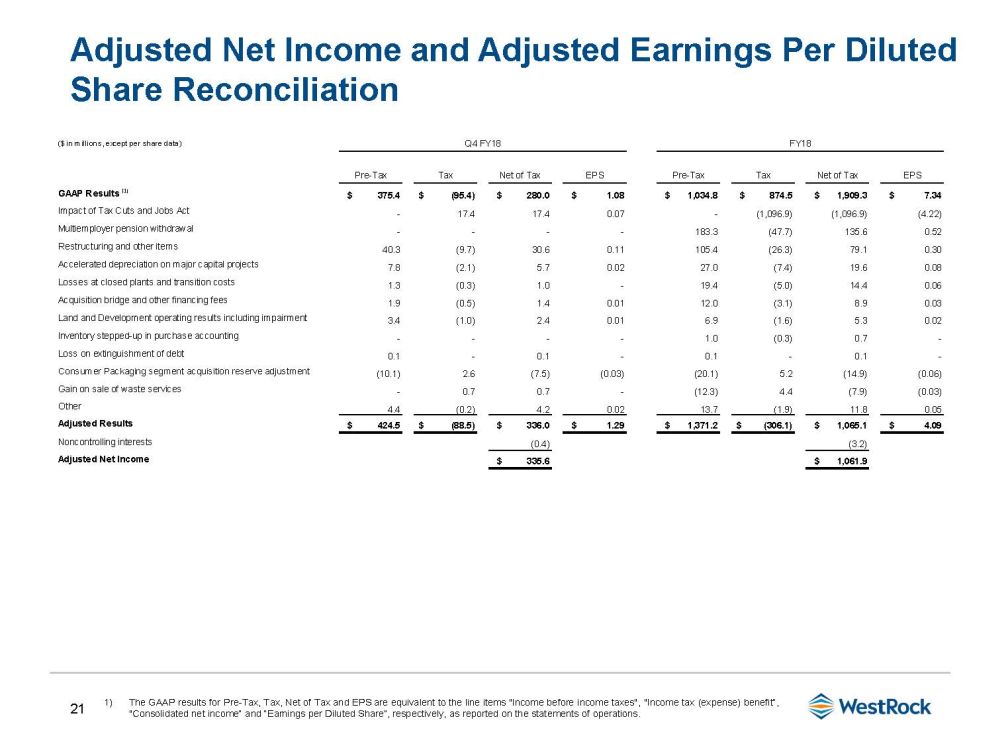
21 Adjusted Net Income and Adjusted Earnings Per Diluted Share Reconciliation 1) The GAAP results for Pre - Tax, Tax, Net of Tax and EPS are equivalent to the line items "Income before income taxes", "Income tax (expense) benefit“, "Consolidated net income“ and “Earnings per Diluted Share”, respectively, as reported on the statements of operations. ($ in millions, except per share data) Q4 FY18 FY18 Pre-Tax Tax Net of Tax EPS Pre-Tax Tax Net of Tax EPS GAAP Results (1) $ 375.4 $ (95.4) $ 280.0 $ 1.08 $ 1,034.8 $ 874.5 $ 1,909.3 $ 7.34 Impact of Tax Cuts and Jobs Act - 17.4 17.4 0.07 - (1,096.9) (1,096.9) (4.22) Multiemployer pension withdrawal - - - - 183.3 (47.7) 135.6 0.52 Restructuring and other items 40.3 (9.7) 30.6 0.11 105.4 (26.3) 79.1 0.30 Accelerated depreciation on major capital projects 7.8 (2.1) 5.7 0.02 27.0 (7.4) 19.6 0.08 Losses at closed plants and transition costs 1.3 (0.3) 1.0 - 19.4 (5.0) 14.4 0.06 Acquisition bridge and other financing fees 1.9 (0.5) 1.4 0.01 12.0 (3.1) 8.9 0.03 Land and Development operating results including impairment 3.4 (1.0) 2.4 0.01 6.9 (1.6) 5.3 0.02 Inventory stepped-up in purchase accounting - - - - 1.0 (0.3) 0.7 - Loss on extinguishment of debt 0.1 - 0.1 - 0.1 - 0.1 - Consumer Packaging segment acquisition reserve adjustment (10.1) 2.6 (7.5) (0.03) (20.1) 5.2 (14.9) (0.06) Gain on sale of waste services - 0.7 0.7 - (12.3) 4.4 (7.9) (0.03) Other 4.4 (0.2) 4.2 0.02 13.7 (1.9) 11.8 0.05 Adjusted Results $ 424.5 $ (88.5) $ 336.0 $ 1.29 $ 1,371.2 $ (306.1) $ 1,065.1 $ 4.09 Noncontrolling interests (0.4) (3.2) Adjusted Net Income $ 335.6 $ 1,061.9
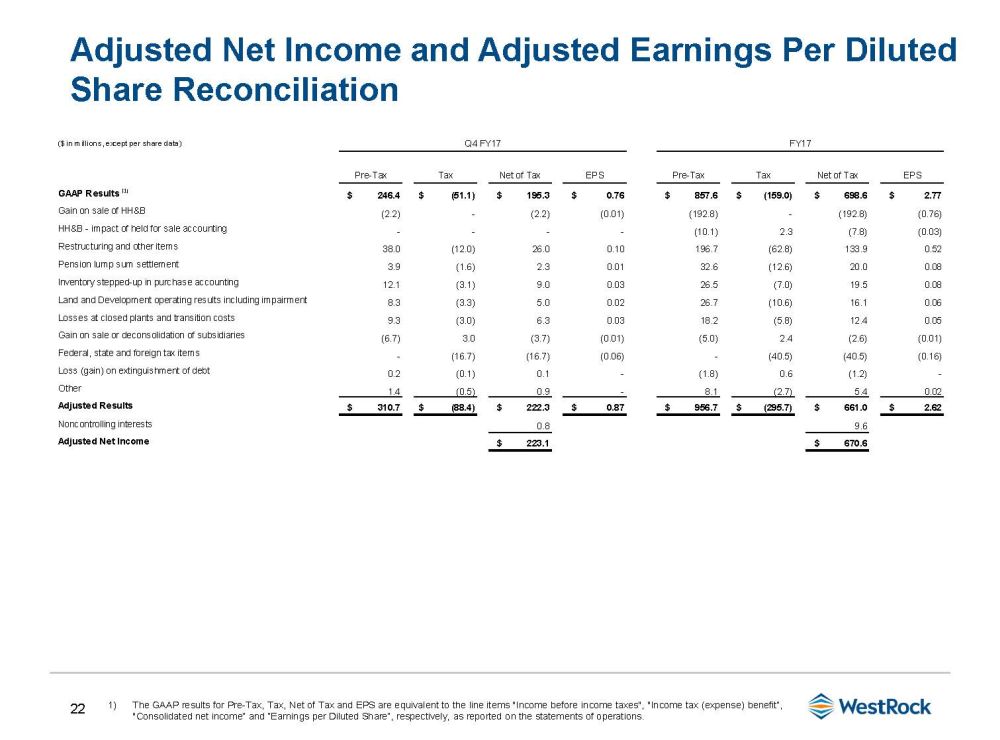
22 Adjusted Net Income and Adjusted Earnings Per Diluted Share Reconciliation ($ in millions, except per share data) Q4 FY17 FY17 Pre-Tax Tax Net of Tax EPS Pre-Tax Tax Net of Tax EPS GAAP Results (1) $ 246.4 $ (51.1) $ 195.3 $ 0.76 $ 857.6 $ (159.0) $ 698.6 $ 2.77 Gain on sale of HH&B (2.2) - (2.2) (0.01) (192.8) - (192.8) (0.76) HH&B - impact of held for sale accounting - - - - (10.1) 2.3 (7.8) (0.03) Restructuring and other items 38.0 (12.0) 26.0 0.10 196.7 (62.8) 133.9 0.52 Pension lump sum settlement 3.9 (1.6) 2.3 0.01 32.6 (12.6) 20.0 0.08 Inventory stepped-up in purchase accounting 12.1 (3.1) 9.0 0.03 26.5 (7.0) 19.5 0.08 Land and Development operating results including impairment 8.3 (3.3) 5.0 0.02 26.7 (10.6) 16.1 0.06 Losses at closed plants and transition costs 9.3 (3.0) 6.3 0.03 18.2 (5.8) 12.4 0.05 Gain on sale or deconsolidation of subsidiaries (6.7) 3.0 (3.7) (0.01) (5.0) 2.4 (2.6) (0.01) Federal, state and foreign tax items - (16.7) (16.7) (0.06) - (40.5) (40.5) (0.16) Loss (gain) on extinguishment of debt 0.2 (0.1) 0.1 - (1.8) 0.6 (1.2) - Other 1.4 (0.5) 0.9 - 8.1 (2.7) 5.4 0.02 Adjusted Results $ 310.7 $ (88.4) $ 222.3 $ 0.87 $ 956.7 $ (295.7) $ 661.0 $ 2.62 Noncontrolling interests 0.8 9.6 Adjusted Net Income $ 223.1 $ 670.6 1) The GAAP results for Pre - Tax, Tax, Net of Tax and EPS are equivalent to the line items "Income before income taxes", "Income tax (expense) benefit“, "Consolidated net income“ and “Earnings per Diluted Share”, respectively, as reported on the statements of operations.

23 ($ in millions, except percentages) Q4 FY18 Q4 FY17 Adusted pre-tax income 424.5$ 310.7$ Adjusted tax expense (88.5) (88.4) 336.0$ 222.3$ Adjusted Tax Rate 20.8% 28.5% ($ in millions) Q4 FY18 Q4 FY17 Net cash provided by operating activities 914.2$ 494.3$ Plus: Cash Restructuring and other costs, net of income tax benefit of $4.2 and $9.2 12.0 18.6 Adjusted Operating Cash Flow 926.2$ 512.9$ FY18 FY17 Net cash provided by operating activities 2,420.9$ 1,900.5$ Plus: Cash Restructuring and other costs, net of income tax benefit of $14.5 and $36.4 41.3 99.5 Adjusted Operating Cash Flow 2,462.2$ 2,000.0$ Adjusted Tax Rate Reconciliation Adjusted Operating Cash Flow

24 Adjusted Segment Sales and Adjusted Segment EBITDA Q4 FY18 ($ in millions, except percentages) Corrugated Packaging Consumer Packaging Land and Development Corporate / Eliminations Consolidated Segment / Net Sales 2,390.0$ 1,879.2$ 39.5$ (72.1)$ 4,236.6$ Less: Trade Sales (118.3) - - - (118.3) Adjusted Segment Sales 2,271.7$ 1,879.2$ 39.5$ (72.1)$ 4,118.3$ Segment Income (Loss) 377.5$ 132.6$ (2.8)$ -$ 507.3$ Non-allocated Expenses - - - (14.3) (14.3) Depreciation and Amortization 170.2 142.3 0.1 1.7 314.3 Segment EBITDA 547.7$ 274.9$ (2.7)$ (12.6)$ 807.3$ Plus: Inventory Step-up - - - - - Adjusted Segment EBITDA 547.7$ 274.9$ (2.7)$ (12.6)$ 807.3$ Segment EBITDA Margins 22.9% 14.6% 19.1% Adjusted Segment EBITDA Margins 24.1% 14.6% 19.1% Q4 FY17 ($ in millions, except percentages) Corrugated Packaging Consumer Packaging Land and Development Corporate / Eliminations Consolidated Segment / Net Sales 2,238.5$ 1,866.3$ 18.7$ (62.9)$ 4,060.6$ Less: Trade Sales (85.6) - - - (85.6) Adjusted Segment Sales 2,152.9$ 1,866.3$ 18.7$ (62.9)$ 3,975.0$ Segment Income (Loss) 229.0$ 124.6$ (5.6)$ -$ 348.0$ Non-allocated Expenses - - - (6.8) (6.8) Depreciation and Amortization 156.7 143.1 0.1 1.2 301.1 Segment EBITDA 385.7$ 267.7$ (5.5)$ (5.6)$ 642.3$ Plus: Inventory Step-up 0.2 11.9 - - 12.1 Adjusted Segment EBITDA 385.9$ 279.6$ (5.5)$ (5.6)$ 654.4$ Segment EBITDA Margins 17.2% 14.3% 15.8% Adjusted Segment EBITDA Margins 17.9% 15.0% 16.1%

25 Adjusted Segment Sales and Adjusted Segment EBITDA FY18 ($ in millions, except percentages) Corrugated Packaging Consumer Packaging Land and Development Corporate / Eliminations Consolidated Segment / Net Sales 9,103.4$ 7,291.4$ 142.4$ (252.1)$ 16,285.1$ Less: Trade Sales (385.8) - - - (385.8) Adjusted Segment Sales 8,717.6$ 7,291.4$ 142.4$ (252.1)$ 15,899.3$ Segment Income 1,207.9$ 454.6$ 22.5$ -$ 1,685.0$ Non-allocated Expenses - - - (47.5) (47.5) Depreciation and Amortization 676.8 569.3 0.7 5.4 1,252.2 Segment EBITDA 1,884.7$ 1,023.9$ 23.2$ (42.1)$ 2,889.7$ Plus: Inventory Step-up 1.0 - - - 1.0 Adjusted Segment EBITDA 1,885.7$ 1,023.9$ 23.2$ (42.1)$ 2,890.7$ Segment EBITDA Margins 20.7% 14.0% 17.7% Adjusted Segment EBITDA Margins 21.6% 14.0% 17.8% FY17 ($ in millions, except percentages) Corrugated Packaging Consumer Packaging Land and Development Corporate / Eliminations Consolidated Segment / Net Sales 8,408.3$ 6,452.5$ 243.8$ (244.9)$ 14,859.7$ Less: Trade Sales (318.2) - - - (318.2) Adjusted Segment Sales 8,090.1$ 6,452.5$ 243.8$ (244.9)$ 14,541.5$ Segment Income 753.9$ 425.8$ 13.8$ -$ 1,193.5$ Non-allocated Expenses - - - (43.5) (43.5) Depreciation and Amortization 597.9 508.2 0.7 5.3 1,112.1 Segment EBITDA 1,351.8$ 934.0$ 14.5$ (38.2)$ 2,262.1$ Plus: Inventory Step-up 1.4 25.1 - - 26.5 Adjusted Segment EBITDA 1,353.2$ 959.1$ 14.5$ (38.2)$ 2,288.6$ Segment EBITDA Margins 16.1% 14.5% 15.2% Adjusted Segment EBITDA Margins 16.7% 14.9% 15.4%

26 Corrugated Packaging Adjusted Segment EBITDA ($ in millions, except percentages) North American Corrugated Brazil Corrugated Other Corrugated Packaging Segment Sales 2,146.5$ 111.9$ 131.6$ 2,390.0$ Less: Trade Sales (118.3) - - (118.3) Adjusted Segment Sales 2,028.2$ 111.9$ 131.6$ 2,271.7$ Segment Income (Loss) 363.1$ 15.5$ (1.1)$ 377.5$ Depreciation and Amortization 152.0 14.8 3.4 170.2 Segment EBITDA 515.1$ 30.3$ 2.3$ 547.7$ Plus: Inventory Step-up - - - - Adjusted Segment EBITDA 515.1$ 30.3$ 2.3$ 547.7$ Segment EBITDA Margins 24.0% 27.1% 22.9% Adjusted Segment EBITDA Margins 25.4% 27.1% 24.1% ($ in millions, except percentages) North American Corrugated Brazil Corrugated Other Corrugated Packaging Segment Sales 1,950.2$ 117.2$ 171.1$ 2,238.5$ Less: Trade Sales (85.6) - - (85.6) Adjusted Segment Sales 1,864.6$ 117.2$ 171.1$ 2,152.9$ Segment Income 219.1$ 6.8$ 3.1$ 229.0$ Depreciation and Amortization 139.2 14.8 2.7 156.7 Segment EBITDA 358.3$ 21.6$ 5.8$ 385.7$ Plus: Inventory Step-up 0.2 - - 0.2 Adjusted Segment EBITDA 358.5$ 21.6$ 5.8$ 385.9$ Segment EBITDA Margins 18.4% 18.4% 17.2% Adjusted Segment EBITDA Margins 19.2% 18.4% 17.9% Q4 FY18 Q4 FY17

27 FY19 Recycling Business Realignment FY18 for comparison purposes only 1) Impact on Corrugated Packaging segment sales approximately $6 million higher per quarter in fiscal 2018 (due to intercompany eli minations). Net sales impacted by recovered fiber prices. Beginning October 2018, our recycling activity will be accounted for as a procurement function, shifting its focus to procure men t of low cost, high quality recovered fiber for our mill system. As a result, we will not record sales in FY19. The table above reflects the impact on Consolidated Net Sales as if this would have happened in FY18. ($ in millions) Q1 FY18 Q2 FY18 Q3 FY18 Q4 FY18 FY18 Consolidated Net Sales 3,894.0$ 4,017.0$ 4,137.5$ 4,236.6$ 16,285.1$ Less: Recycling Net Sales (1) (116.0) (109.9) (105.7) (106.1) (437.7) Consolidated Net Sales Adjusted for Recycling 3,778.0$ 3,907.1$ 4,031.8$ 4,130.5$ 15,847.4$

28 Packaging Shipments Results 1) Recast to exclude box plants contributed to Grupo Gondi prior to Q3 FY16. 2) Combined North America, Brazil and India shipments. Corrugated Packaging North America Corrugated Unit Q1 Q2 Q3 Q4 Q1 Q2 Q3 Q4 Q1 Q2 Q3 Q4 External Box, Containerboard & Kraft Paper Shipments Thousands of tons 1,940.6 1,969.2 2,019.8 2,063.5 1,951.8 2,049.5 2,030.7 1,986.2 1,950.4 2,039.9 2,030.0 2,081.3 Newsprint Shipments Thousands of tons 26.0 - - - - - - - - - - - Pulp Shipments Thousands of tons 80.1 71.1 94.3 89.7 80.1 66.6 82.0 93.5 95.2 72.2 66.4 82.5 Total North American Corrugated Packaging Shipments Thousands of tons 2,046.7 2,040.3 2,114.1 2,153.2 2,031.9 2,116.1 2,112.7 2,079.7 2,045.6 2,112.1 2,096.4 2,163.8 Corrugated Container Shipments (1) Billions of square feet 18.7 18.2 18.6 18.9 18.8 18.7 19.4 19.6 19.8 19.7 20.5 20.3 Corrugated Container Shipments per Shipping Day (1) Millions of square feet 306.3 288.6 291.4 294.5 312.9 291.9 308.0 316.6 325.4 311.7 320.5 321.9 Corrugated Packaging Maintenance Downtime Thousands of tons 119.9 68.1 60.5 32.2 115.4 77.8 45.1 18.4 73.1 35.2 125.2 - Corrugated Packaging Economic Downtime Thousands of tons 144.0 30.1 71.7 - 0.1 - - - - - - - Brazil and India Corrugated Packaging Shipments Thousands of tons 180.2 173.5 166.8 164.8 151.0 171.0 178.8 178.0 170.5 174.6 178.6 196.7 Corrugated Container Shipments Billions of square feet 1.5 1.3 1.4 1.6 1.5 1.6 1.6 1.6 1.6 1.5 1.6 1.6 Corrugated Container Shipments per Shipping Day Millions of square feet 19.2 18.1 18.7 19.8 20.4 20.2 21.3 20.8 21.7 20.6 20.2 21.0 Total Corrugated Packaging Segment Shipments (2) Thousands of tons 2,226.9 2,213.8 2,280.9 2,318.0 2,182.9 2,287.1 2,291.5 2,257.7 2,216.1 2,286.7 2,275.0 2,360.5 Consumer Packaging WestRock Consumer Packaging Paperboard and Converting Shipments Thousands of tons 876.0 898.3 911.0 929.9 879.0 906.8 929.3 986.1 942.6 961.9 993.8 1,002.9 Pulp Shipments Thousands of tons 73.3 76.1 75.3 68.8 37.5 40.2 27.9 37.1 40.2 30.5 31.5 28.8 Total Consumer Packaging Segment Shipments Thousands of tons 949.3 974.4 986.3 998.7 916.5 947.0 957.2 1,023.2 982.8 992.4 1,025.3 1,031.7 Consumer Packaging Converting Shipments Billions of square feet 8.8 9.0 9.5 9.4 9.0 8.9 9.9 11.1 10.8 10.7 11.2 11.2 FY16 FY17 FY18
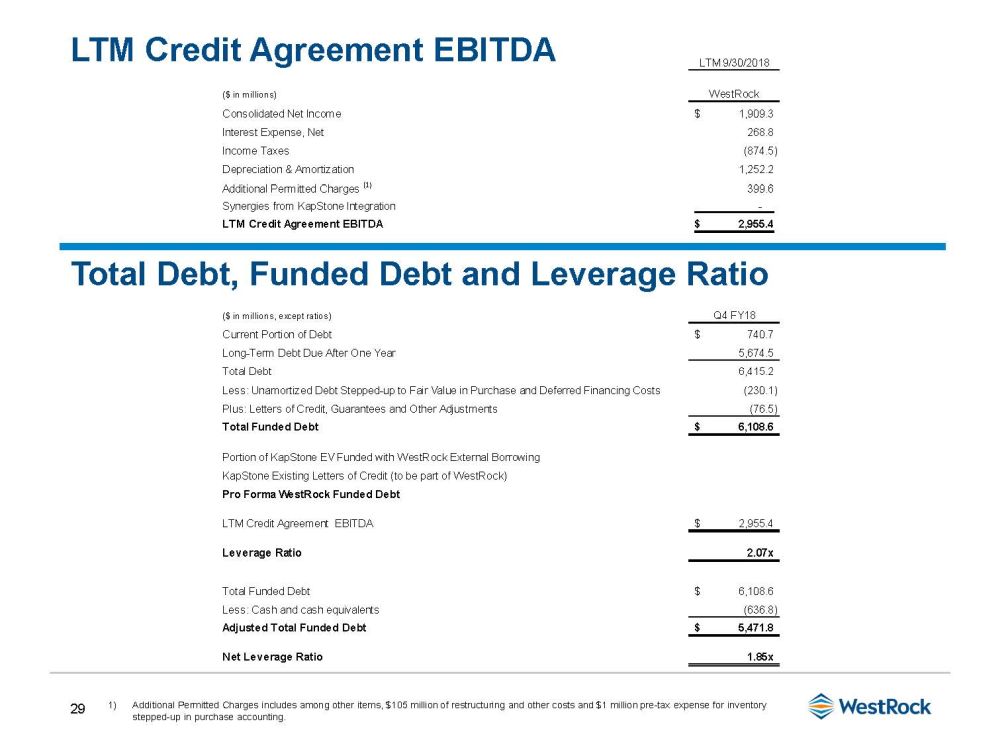
29 LTM Credit Agreement EBITDA 1) Additional Permitted Charges includes among other items, $105 million of restructuring and other costs and $1 million pre - tax ex pense for inventory stepped - up in purchase accounting. Total Debt, Funded Debt and Leverage Ratio LTM 9/30/2018 ($ in millions) WestRock Consolidated Net Income 1,909.3$ Interest Expense, Net 268.8 Income Taxes (874.5) Depreciation & Amortization 1,252.2 Additional Permitted Charges (1) 399.6 Synergies from KapStone Integration - LTM Credit Agreement EBITDA 2,955.4$ ($ in millions, except ratios) Q4 FY18 Current Portion of Debt 740.7$ Long-Term Debt Due After One Year 5,674.5 Total Debt 6,415.2 Less: Unamortized Debt Stepped-up to Fair Value in Purchase and Deferred Financing Costs (230.1) Plus: Letters of Credit, Guarantees and Other Adjustments (76.5) Total Funded Debt 6,108.6$ Portion of KapStone EV Funded with WestRock External Borrowing KapStone Existing Letters of Credit (to be part of WestRock) Pro Forma WestRock Funded Debt LTM Credit Agreement EBITDA 2,955.4$ Leverage Ratio 2.07x Total Funded Debt 6,108.6$ Less: Cash and cash equivalents (636.8) Adjusted Total Funded Debt 5,471.8$ Net Leverage Ratio 1.85x

30 KapStone Adjusted EBITDA (1) ($ in thousands) 9 Mo. Ended 3 Mo. Ended Sep. 30, 2018 Dec. 31, 2017 Net Income 158,435$ 187,709$ 346,144$ Interest expense, net 45,921 14,077 59,998 Provision for income taxes 46,284 (124,532) (78,248) Depreciation and amortization 138,823 47,937 186,760 EBITDA 389,463 125,191 514,654 Adjustments 25,726 10,739 36,465 Adjusted EBITDA (1) 415,189 135,930 551,119 Less: Stock-based compensation expense (7,176) (2,234) (9,410) Conformed Adjusted EBITDA (1) 408,013$ 133,696$ 541,709$ Trailing Twelve Months 1) Non - GAAP Financial Measure.
