Attached files
| file | filename |
|---|---|
| EX-32.2 - EXHIBIT 32.2 - PHILLIPS EDISON GROCERY CENTER REIT II, INC. | reitiiq32018ex-322.htm |
| EX-32.1 - EXHIBIT 32.1 - PHILLIPS EDISON GROCERY CENTER REIT II, INC. | reitiiq32018ex-321.htm |
| EX-31.2 - EXHIBIT 31.2 - PHILLIPS EDISON GROCERY CENTER REIT II, INC. | reitiiq32018ex-312.htm |
| EX-31.1 - EXHIBIT 31.1 - PHILLIPS EDISON GROCERY CENTER REIT II, INC. | reitiiq32018ex-311.htm |
UNITED STATES SECURITIES AND EXCHANGE COMMISSION
Washington, D.C. 20549
FORM 10-Q
(Mark One)
þ QUARTERLY REPORT PURSUANT TO SECTION 13 OR 15(d) OF THE SECURITIES EXCHANGE ACT OF 1934
For the quarterly period ended September 30, 2018
OR
¨ TRANSITION REPORT PURSUANT TO SECTION 13 OR 15(d) OF THE SECURITIES EXCHANGE ACT OF 1934
For the transition period from to
Commission file number 000-55438

PHILLIPS EDISON GROCERY CENTER REIT II, INC.
(Exact Name of Registrant as Specified in Its Charter)
Maryland | 61-1714451 |
(State or Other Jurisdiction of Incorporation or Organization) | (I.R.S. Employer Identification No.) |
11501 Northlake Drive Cincinnati, Ohio | 45249 |
(Address of Principal Executive Offices) | (Zip Code) |
(513) 554-1110
(Registrant’s Telephone Number, Including Area Code)
Indicate by check mark whether the registrant: (1) has filed all reports required to be filed by Section 13 or 15(d) of the Securities Exchange Act of 1934 during the preceding 12 months (or for such shorter period that the registrant was required to file such reports), and (2) has been subject to such filing requirements for the past 90 days. Yes þ No ¨
Indicate by check mark whether the registrant has submitted electronically every Interactive Data File required to be submitted pursuant to Rule 405 of Regulation S-T (§232.405 of this chapter) during the preceding 12 months (or for such shorter period that the registrant was required to submit such files). Yes þ No ¨
Indicate by check mark whether the registrant is a large accelerated filer, an accelerated filer, a non-accelerated filer, a smaller reporting company, or an emerging growth company. See the definitions of “large accelerated filer,” “accelerated filer,” “smaller reporting company,” and “emerging growth company” in Rule 12b-2 of the Exchange Act:
Large Accelerated Filer | ¨ | Accelerated Filer | ¨ |
Non-Accelerated Filer | þ | Smaller reporting company | ¨ |
Emerging growth company | þ | ||
If an emerging growth company, indicate by check mark if the registrant has elected not to use the extended transition period for complying with any new or revised financial accounting standards provided pursuant to Section 13(a) of the Exchange Act. þ
Indicate by check mark whether the registrant is a shell company (as defined in Rule 12b-2 of the Exchange Act). Yes ¨ No þ
As of October 31, 2018, there were 46.7 million outstanding shares of common stock of Phillips Edison Grocery Center REIT II, Inc.
INDEX TO CONSOLIDATED FINANCIAL STATEMENTS
1
w PART I. FINANCIAL INFORMATION |
ITEM 1. FINANCIAL STATEMENTS
PHILLIPS EDISON GROCERY CENTER REIT II, INC.
CONSOLIDATED BALANCE SHEETS
AS OF SEPTEMBER 30, 2018 AND DECEMBER 31, 2017
(Unaudited)
(In thousands, except per share amounts)
September 30, 2018 | December 31, 2017 | ||||||
ASSETS | |||||||
Investment in real estate: | |||||||
Land and improvements | $ | 527,622 | $ | 520,526 | |||
Building and improvements | 1,068,010 | 1,047,758 | |||||
Acquired in-place lease assets | 160,261 | 158,510 | |||||
Acquired above-market lease assets | 15,017 | 14,742 | |||||
Total investment in property | 1,770,910 | 1,741,536 | |||||
Accumulated depreciation and amortization | (214,593 | ) | (157,290 | ) | |||
Net investment in property | 1,556,317 | 1,584,246 | |||||
Investment in unconsolidated joint venture | 10,491 | 16,076 | |||||
Total investment in real estate assets, net | 1,566,808 | 1,600,322 | |||||
Cash and cash equivalents | 3,415 | 1,435 | |||||
Restricted cash | 4,676 | 4,382 | |||||
Other assets, net | 60,319 | 46,178 | |||||
Total assets | $ | 1,635,218 | $ | 1,652,317 | |||
LIABILITIES AND EQUITY | |||||||
Liabilities: | |||||||
Debt obligations, net | $ | 811,336 | $ | 775,275 | |||
Acquired below-market lease liabilities, net of accumulated amortization of $14,451 | |||||||
and $10,959, respectively | 52,065 | 54,994 | |||||
Accounts payable - affiliates | 1,528 | 1,808 | |||||
Accounts payable and other liabilities | 36,740 | 36,961 | |||||
Total liabilities | 901,669 | 869,038 | |||||
Commitments and contingencies (Note 8) | — | — | |||||
Equity: | |||||||
Preferred stock, $0.01 par value per share, 10,000 shares authorized, zero shares issued and | |||||||
outstanding at September 30, 2018 and December 31, 2017, respectively | — | — | |||||
Common stock, $0.01 par value per share, 1,000,000 shares authorized, 46,693 and 46,584 | |||||||
shares issued and outstanding at September 30, 2018 and December 31, 2017, respectively | 469 | 468 | |||||
Additional paid-in capital | 1,034,175 | 1,031,685 | |||||
Accumulated other comprehensive income (“AOCI”) | 15,216 | 6,459 | |||||
Accumulated deficit | (316,311 | ) | (255,333 | ) | |||
Total equity | 733,549 | 783,279 | |||||
Total liabilities and equity | $ | 1,635,218 | $ | 1,652,317 | |||
See notes to consolidated financial statements.
2
PHILLIPS EDISON GROCERY CENTER REIT II, INC.
CONSOLIDATED STATEMENTS OF OPERATIONS AND COMPREHENSIVE (LOSS) INCOME
FOR THE THREE AND NINE MONTHS ENDED SEPTEMBER 30, 2018 AND 2017
(Unaudited)
(In thousands, except per share amounts)
Three Months Ended September 30, | Nine Months Ended September 30, | ||||||||||||||
2018 | 2017 | 2018 | 2017 | ||||||||||||
Revenues: | |||||||||||||||
Rental income | $ | 32,352 | $ | 30,483 | $ | 96,559 | $ | 88,512 | |||||||
Tenant recovery income | 12,012 | 10,227 | 35,106 | 30,566 | |||||||||||
Other property income | 123 | 261 | 688 | 652 | |||||||||||
Total revenues | 44,487 | 40,971 | 132,353 | 119,730 | |||||||||||
Expenses: | |||||||||||||||
Property operating | 6,966 | 6,264 | 21,124 | 19,059 | |||||||||||
Real estate taxes | 7,143 | 5,783 | 21,146 | 18,393 | |||||||||||
General and administrative | 4,811 | 5,110 | 13,842 | 15,190 | |||||||||||
Termination of affiliate arrangements | — | 5,962 | — | 5,962 | |||||||||||
Depreciation and amortization | 19,195 | 18,037 | 57,166 | 52,573 | |||||||||||
Total expenses | 38,115 | 41,156 | 113,278 | 111,177 | |||||||||||
Other: | |||||||||||||||
Interest expense, net | (7,261 | ) | (5,691 | ) | (22,295 | ) | (15,617 | ) | |||||||
Transaction expenses | (1,742 | ) | — | (2,237 | ) | — | |||||||||
Other income (expense), net | 888 | 19 | 842 | (132 | ) | ||||||||||
Net loss | $ | (1,743 | ) | $ | (5,857 | ) | $ | (4,615 | ) | $ | (7,196 | ) | |||
Earnings per common share: | |||||||||||||||
Net loss per share - basic and diluted | $ | (0.04 | ) | $ | (0.13 | ) | $ | (0.10 | ) | $ | (0.15 | ) | |||
Weighted-average common shares outstanding: | |||||||||||||||
Basic and diluted | 46,813 | 46,545 | 46,755 | 46,529 | |||||||||||
Comprehensive (loss) income: | |||||||||||||||
Net loss | $ | (1,743 | ) | $ | (5,857 | ) | $ | (4,615 | ) | $ | (7,196 | ) | |||
Other comprehensive income (loss): | |||||||||||||||
Change in unrealized gain (loss) on interest rate swaps | 879 | (43 | ) | 8,757 | 59 | ||||||||||
Comprehensive (loss) income | $ | (864 | ) | $ | (5,900 | ) | $ | 4,142 | $ | (7,137 | ) | ||||
See notes to consolidated financial statements.
3
PHILLIPS EDISON GROCERY CENTER REIT II, INC.
CONSOLIDATED STATEMENTS OF EQUITY
FOR THE NINE MONTHS ENDED SEPTEMBER 30, 2018 AND 2017
(Unaudited)
(In thousands, except per share amounts)
Common Stock | Additional Paid-In Capital | AOCI | Accumulated Deficit | Total Equity | ||||||||||||||||||||||
Shares | Amount | |||||||||||||||||||||||||
Balance at January 1, 2017, as adjusted | 46,372 | $ | 463 | $ | 1,026,887 | $ | 4,906 | $ | (170,022 | ) | $ | 862,234 | ||||||||||||||
Share repurchases | (1,040 | ) | (9 | ) | (23,501 | ) | — | — | (23,510 | ) | ||||||||||||||||
Distribution reinvestment plan (“DRIP”) | 1,222 | 14 | 27,616 | — | — | 27,630 | ||||||||||||||||||||
Change in unrealized gain on interest rate swaps | — | — | — | 59 | — | 59 | ||||||||||||||||||||
Common distributions declared, $1.22 per share | — | — | — | — | (56,669 | ) | (56,669 | ) | ||||||||||||||||||
Share-based compensation | 1 | — | 24 | — | — | 24 | ||||||||||||||||||||
Net loss | — | — | — | — | (7,196 | ) | (7,196 | ) | ||||||||||||||||||
Balance at September 30, 2017 | 46,555 | $ | 468 | $ | 1,031,026 | $ | 4,965 | $ | (233,887 | ) | $ | 802,572 | ||||||||||||||
Balance at December 31, 2017, as reported | 46,584 | $ | 468 | $ | 1,031,685 | $ | 6,459 | $ | (255,333 | ) | $ | 783,279 | ||||||||||||||
Adoption of ASU 2017-05 (see Note 2) | — | — | — | — | — | — | — | 835 | — | 835 | ||||||||||||||||
Balance at January 1, 2018, as adjusted | 46,584 | 468 | 1,031,685 | 6,459 | (254,498 | ) | 784,114 | |||||||||||||||||||
Share repurchases | (894 | ) | (9 | ) | (20,346 | ) | — | — | (20,355 | ) | ||||||||||||||||
DRIP | 1,002 | 10 | 22,794 | — | — | 22,804 | ||||||||||||||||||||
Change in unrealized gain on interest rate swaps | — | — | — | 8,757 | — | 8,757 | ||||||||||||||||||||
Common distributions declared, $1.22 per share | — | — | — | — | (57,198 | ) | (57,198 | ) | ||||||||||||||||||
Share-based compensation | 1 | — | 42 | — | — | 42 | ||||||||||||||||||||
Net loss | — | — | — | — | (4,615 | ) | (4,615 | ) | ||||||||||||||||||
Balance at September 30, 2018 | 46,693 | $ | 469 | $ | 1,034,175 | $ | 15,216 | $ | (316,311 | ) | $ | 733,549 | ||||||||||||||
See notes to consolidated financial statements.
4
PHILLIPS EDISON GROCERY CENTER REIT II, INC.
CONSOLIDATED STATEMENTS OF CASH FLOWS
FOR THE NINE MONTHS ENDED SEPTEMBER 30, 2018 AND 2017
(Unaudited)
(In thousands)
2018 | 2017 | ||||||
CASH FLOWS FROM OPERATING ACTIVITIES: | |||||||
Net loss | $ | (4,615 | ) | $ | (7,196 | ) | |
Adjustments to reconcile net loss to net cash provided by operating activities: | |||||||
Depreciation and amortization | 56,175 | 51,595 | |||||
Net amortization of above- and below-market leases | (1,808 | ) | (1,782 | ) | |||
Amortization of deferred financing expense | 1,882 | 2,060 | |||||
Change in fair value of derivatives | (255 | ) | (448 | ) | |||
Straight-line rental income | (1,938 | ) | (2,261 | ) | |||
Equity in net (income) loss of unconsolidated joint venture | (665 | ) | 144 | ||||
Other | 373 | 81 | |||||
Changes in operating assets and liabilities: | |||||||
Accounts payable – affiliates | (280 | ) | (162 | ) | |||
Other assets | (5,819 | ) | (10,583 | ) | |||
Accounts payable and other liabilities | 1,268 | 5,700 | |||||
Net cash provided by operating activities | 44,318 | 37,148 | |||||
CASH FLOWS FROM INVESTING ACTIVITIES: | |||||||
Real estate acquisitions | (20,121 | ) | (153,091 | ) | |||
Capital expenditures | (9,366 | ) | (9,934 | ) | |||
Investment in unconsolidated joint venture | — | (2,854 | ) | ||||
Return of investment in unconsolidated joint venture | 6,250 | 400 | |||||
Principal disbursement on notes receivable - affiliate | — | (1,272 | ) | ||||
Principal proceeds on notes receivable - affiliate | — | 1,272 | |||||
Net cash used in investing activities | (23,237 | ) | (165,479 | ) | |||
CASH FLOWS FROM FINANCING ACTIVITIES: | |||||||
Net change in credit facility | 65,000 | (5,644 | ) | ||||
Proceeds from mortgages and loans payable | — | 200,000 | |||||
Payments on mortgages and loans payable | (29,305 | ) | (13,726 | ) | |||
Payments of deferred financing expenses | — | (2,353 | ) | ||||
Distributions paid, net of DRIP | (34,497 | ) | (29,217 | ) | |||
Repurchases of common stock | (20,005 | ) | (23,451 | ) | |||
Net cash (used in) provided by financing activities | (18,807 | ) | 125,609 | ||||
NET INCREASE (DECREASE) IN CASH, CASH EQUIVALENTS, AND RESTRICTED CASH | 2,274 | (2,722 | ) | ||||
CASH, CASH EQUIVALENTS, AND RESTRICTED CASH: | |||||||
Beginning of period | 5,817 | 11,088 | |||||
End of period | $ | 8,091 | $ | 8,366 | |||
RECONCILIATION TO CONSOLIDATED BALANCE SHEET | |||||||
Cash and cash equivalents | $ | 3,415 | $ | 4,509 | |||
Restricted cash | 4,676 | 3,857 | |||||
Cash, cash equivalents, and restricted cash at end of period | $ | 8,091 | $ | 8,366 | |||
SUPPLEMENTAL CASH FLOW DISCLOSURE, INCLUDING NON-CASH INVESTING AND FINANCING ACTIVITIES: | |||||||
Cash paid for interest | $ | 21,768 | $ | 14,297 | |||
Fair value of debt assumed | — | 24,697 | |||||
Accrued capital expenditures and acquisition costs | 1,824 | 4,314 | |||||
Change in distributions payable | (103 | ) | (178 | ) | |||
Change in accrued share repurchase obligation | 350 | 59 | |||||
Distributions reinvested | 22,804 | 27,630 | |||||
See notes to consolidated financial statements.
5
Phillips Edison Grocery Center REIT II, Inc.
Notes to Consolidated Financial Statements
(Unaudited)
1. ORGANIZATION |
Phillips Edison Grocery Center REIT II, Inc. (“we,” the “Company,” “our,” or “us”) was formed as a Maryland corporation in June 2013. Substantially all of our business is conducted through Phillips Edison Grocery Center Operating Partnership II, L.P., (the “Operating Partnership”), a Delaware limited partnership formed in June 2013. We are a limited partner of the Operating Partnership, and our wholly owned subsidiary, PE Grocery Center OP GP II LLC, is the sole general partner of the Operating Partnership.
We invest primarily in well-occupied, grocery-anchored, neighborhood and community shopping centers that have a mix of creditworthy national and regional retailers that sell necessity-based goods and services in strong demographic markets throughout the United States. Our advisor and property managers are owned by Phillips Edison & Company, Inc. and its subsidiaries (“PECO,” “Advisor,” or “Manager”). Under the terms of the Amended and Restated Advisory Agreement (“Advisory Agreement”) and the master property management and master services agreements (“Management Agreements”) between subsidiaries of PECO and us, PECO is responsible for the management of our day-to-day activities and the implementation of our investment strategy.
On July 17, 2018, we entered into an Agreement and Plan of Merger ("Merger Agreement") pursuant to which, subject to the satisfaction or waiver of certain conditions, we will merge with PECO, with PECO continuing as the surviving corporation (“Merger”). As consideration for the Merger, PECO will issue 2.04 shares of PECO common stock in exchange for each share of our common stock and will assume the majority of our outstanding debt, subject to closing adjustments. For a more detailed discussion, see Note 3.
As of September 30, 2018, we wholly-owned fee simple interests in 86 real estate properties acquired from third parties unaffiliated with us or PECO. In addition, we own a 20% equity interest in a joint venture that owned 13 real estate properties as of September 30, 2018 (see Note 5).
2. SUMMARY OF SIGNIFICANT ACCOUNTING POLICIES |
Certain of our accounting estimates are particularly important for an understanding of our financial position and results of operations and require the application of significant judgment by management. For example, significant estimates and assumptions have been made with respect to the useful lives of assets; recoverable amounts of receivables; and other fair value measurement assessments required for the preparation of the consolidated financial statements. As a result, these estimates are subject to a degree of uncertainty.
Other than those noted below, there have been no changes to our significant accounting policies during the nine months ended September 30, 2018. For a full summary of our accounting policies, refer to our 2017 Annual Report on Form 10-K filed with the SEC on March 27, 2018.
Basis of Presentation and Principles of Consolidation—The accompanying consolidated financial statements have been prepared in accordance with accounting principles generally accepted in the United States of America (“GAAP”) for interim financial information and with instructions to Form 10-Q and Article 10 of Regulation S-X. Accordingly, they do not include all of the information and footnotes required by GAAP for complete financial statements. Readers of this Quarterly Report on Form 10-Q should refer to the audited consolidated financial statements of Phillips Edison Grocery Center REIT II, Inc. for the year ended December 31, 2017, which are included in our 2017 Annual Report on Form 10-K. In the opinion of management, all normal and recurring adjustments necessary for the fair presentation of the unaudited consolidated financial statements for the periods presented have been included in this Quarterly Report. Our results of operations for the three and nine months ended September 30, 2018, are not necessarily indicative of the operating results expected for the full year.
The accompanying consolidated financial statements include our accounts and those of our majority-owned subsidiaries. All intercompany balances and transactions are eliminated upon consolidation.
Investment in Unconsolidated Joint Venture—We account for our investment in our unconsolidated joint venture using the equity method of accounting as we exercise significant influence over, but do not control, this entity. This investment was initially recorded at cost and is subsequently adjusted for contributions made to and distributions received from the joint venture. Earnings or losses on our investment are recognized in accordance with the terms of the applicable joint venture agreement, generally through a pro rata allocation. Under a pro rata allocation, net income or loss is allocated between the partners in the joint venture based on their respective stated ownership percentages.
We use the cumulative earnings approach to classify distributions from our unconsolidated joint venture. Distributions received are considered returns on investment and classified as cash inflows from operating activities unless our cumulative distributions received less distributions received in prior periods that were determined to be returns of investment exceed cumulative equity in earnings recognized by us. When such an excess occurs, the current-period distribution up to this excess is considered a return of investment and is classified as cash inflows from investing activities.
On a periodic basis, management assesses whether there are indicators, including the operating performance of the underlying real estate and general market conditions, that the value of our investment in our unconsolidated joint venture may be impaired. An investment’s value is impaired only if management’s estimate of the fair value of the investment is less
6
than its carrying value and such difference is deemed to be other-than-temporary. To the extent impairment has occurred, the loss is measured as the excess of the carrying amount of the investment over its estimated fair value.
Management’s estimates of fair value are based upon a discounted cash flow model for each specific investment that includes all estimated cash inflows and outflows over a specified holding period and, where applicable, any estimated debt premiums, capitalization rates, discount rates and credit spreads used in these models are based upon rates we believe to be within a reasonable range of current market rates.
Newly Adopted and Recently Issued Accounting Pronouncements—The following table provides a brief description of newly adopted accounting pronouncements and their effect on our consolidated financial statements:
Standard | Description | Date of Adoption | Effect on the Financial Statements or Other Significant Matters | |||
ASU 2017-05, Other Income - Gains and Losses from the Derecognition of Nonfinancial Assets (Subtopic 610-20) | This update amends existing guidance in order to provide consistency in accounting for the derecognition of a business or nonprofit activity. | January 1, 2018 | We have evaluated the impact of ASU 2017-05 on $0.8 million of deferred gains relating to the contribution of real estate assets in 2016 to our joint venture. As a result of our evaluation, we determined that this contribution meets all of the requirements under ASC 610-20 as a completed sale. In accordance with the modified retrospective transition method, we recognized the cumulative effect of the change, representing the recognition of $0.8 million of previously deferred gain as of December 31, 2017, in the opening balance of Accumulated Deficit with a corresponding adjustment to the opening balance of Accounts Payable and Other Liabilities as of the beginning of 2018. | |||
ASU 2016-15, Statement of Cash Flows (Topic 230); ASU 2016-18, Statement of Cash Flows (Topic 230) | These updates address the presentation of eight specific cash receipts and cash payments on the statement of cash flows as well as clarify the classification and presentation of restricted cash on the statement of cash flows. | January 1, 2018 | We adopted these ASUs by applying a retrospective transition method which requires a restatement of our consolidated statement of cash flows for all periods presented. | |||
ASU 2014-09, Revenue from Contracts with Customers (Topic 606) | This update outlines a comprehensive model for entities to use in accounting for revenue arising from contracts with customers. ASU 2014-09 states that “an entity recognizes revenue to depict the transfer of promised goods or services to customers in an amount that reflects the consideration to which the entity expects to be entitled in exchange for those goods or services.” While ASU 2014-09 specifically references contracts with customers, it also applies to certain other transactions such as the sale of real estate or equipment. Expanded quantitative and qualitative disclosures are also required for contracts subject to ASU 2014-09. | January 1, 2018 | The majority of our revenue is lease revenue from our wholly-owned properties. We record these amounts as Rental Income and Tenant Recovery Income on the consolidated statements of operations. These revenue amounts are excluded from the scope of ASU 2014-09. As a result, the adoption of ASU 2014-09 did not result in any adjusting entries to prior periods as our revenue recognition related to these revenues aligned with the updated guidance. | |||
7
The following table provides a brief description of recent accounting pronouncements that could have a material effect on our consolidated financial statements:
Standard | Description | Date of Adoption | Effect on the Financial Statements or Other Significant Matters | |||
ASU 2018-13, Fair Value Measurement (Topic 820) | This ASU eliminates, adds and modifies certain disclosure requirements for fair value measurements as part of the FASB’s disclosure framework project. Early adoption is permitted. | January 1, 2019 | We are currently evaluating the impact the adoption of these standards will have on our consolidated financial statements. | |||
ASU 2016-13, Financial Instruments - Credit Losses (Topic 326) | This update amends existing guidance by replacing the incurred loss impairment methodology currently used with a methodology that reflects expected credit losses and requires consideration of a broader range of information to inform credit loss estimates. | January 1, 2020 | We are currently evaluating the impact the adoption of this standard will have on our consolidated financial statements, but do not expect the adoption to have a material impact. | |||
ASU 2016-02, Leases (Topic 842); ASU 2018-01, Leases (Topic 842): Land Easement Practical Expedient for Transition to Topic 842; ASU 2018-10, Codification Improvements to Topic 842, Leases; and ASU 2018-11, Leases (Topic 842): Targeted Improvements | These updates amend existing guidance by recognizing lease assets and lease liabilities on the balance sheet and disclosing key information about leasing arrangements. Early adoption is permitted as of the original effective date. | January 1, 2019 | We are currently evaluating the impact the adoption of these standards will have on our consolidated financial statements. We have identified areas within our accounting policies we believe could be impacted by the new standard. This standard impacts the lessor’s ability to capitalize certain costs related to leasing, which will result in a reduction in the amount of execution costs currently being capitalized in connection with leasing activities and an increase to our Property Operating expenses. The standard will also require new disclosures within the accompanying notes to the consolidated financial statements. We expect to adopt the practical expedients available for implementation under the standard. By adopting these practical expedients, we will not be required to reassess (i) whether an expired or existing contract meets the definition of a lease; (ii) the lease classification at the adoption date for existing leases; and (iii) whether the costs previously capitalized as initial direct costs would continue to be amortized. This allows us to continue to account for our leases where we are the lessee as operating leases, however, any new or renewed leases may be classified as financing leases. We currently have an immaterial number of leases of this type. We also expect to recognize right of use assets and lease liability on our consolidated balance sheets related to certain leases where we are the lessee. In July 2018, the FASB issued ASU 2018-11. The update allows lessors to use a practical expedient to account for non-lease components and related lease components as a single lease component instead of accounting for them separately, if certain conditions are met. We expect to utilize this practical expedient. We will continue to evaluate the effect the adoption of these ASUs will have on our consolidated financial statements. However, we currently believe that the adoption will not have a material impact for operating leases where we are a lessor and will continue to record revenues from rental properties for our operating leases on a straight-line basis. We are still evaluating the impact for leases where we are the lessee. | |||
Reclassifications—The following line item on our consolidated statement of operations and comprehensive income (loss) for the three and nine months ended September 30, 2017, was reclassified:
• | Acquisition Expenses were combined with General and Administrative. |
3. PROPOSED MERGER WITH PECO |
On July 17, 2018, we entered into the Merger Agreement, pursuant to which we will merge with PECO, with PECO continuing as the surviving corporation. The Merger will result in a national portfolio of approximately 320 grocery-anchored shopping centers encompassing approximately 36 million square feet in established trade areas across 33 states.
8
As consideration for the Merger, PECO will issue 2.04 shares of PECO common stock in exchange for each share of our common stock, which, for our stockholders, is equivalent to $22.54 based on PECO’s most recent estimated net asset value per share (“EVPS”) of $11.05. The exchange ratio is based on a thorough review of the relative valuation of each entity, including factoring in PECO’s growing investment management business as well as each company’s transaction costs. We will not pay any internalization or disposition fees in connection with the Merger. Our outstanding debt is expected to be refinanced or assumed by PECO at closing under the terms of the Merger Agreement.
The Merger Agreement provides certain termination rights for us and for PECO. In connection with the termination of the Merger Agreement, under certain specified circumstances, (i) we may be required to pay PECO a termination fee of $31.7 million, and (ii) PECO may be required to pay us a termination fee of $75.6 million in the event that PECO terminates the Merger Agreement. The Merger Agreement provided us with a 30-day go-shop period pursuant to which we could solicit, receive, evaluate, and enter into negotiations with respect to alternative proposals from third-parties. The go-shop period ended during the third quarter.
The parties to the Merger Agreement or their respective affiliates will enter into an agreement to terminate, effective immediately prior to the Merger, the Advisory Agreement and Management Agreements, in each case with no further payment under such agreements other than amounts accrued thereunder and previously unpaid.
Immediately following the closing of the Merger, PECO stockholders are expected to own approximately 71% and our stockholders are expected to own approximately 29% of the combined company.
4. FAIR VALUE MEASUREMENTS |
The following describes the methods we use to estimate the fair value of our financial and nonfinancial assets and liabilities:
Cash and Cash Equivalents, Restricted Cash, Accounts Receivable, and Accounts Payable—We consider the carrying values of these financial instruments to approximate fair value because of the short period of time between origination of the instruments and their expected realization.
Real Estate Investments—The purchase prices of the investment properties, including related lease intangible assets and liabilities, were allocated at estimated fair value based on Level 3 inputs, such as discount rates, capitalization rates, comparable sales, replacement costs, income and expense growth rates, and current market rents and allowances as determined by management.
Debt Obligations—We estimate the fair value of our debt by discounting the future cash flows of each instrument at rates currently offered for similar debt instruments of comparable maturities by our lenders using Level 3 inputs. The discount rates used approximate current lending rates for loans or groups of loans with similar maturities and credit quality, assuming the debt is outstanding through maturity and considering the debt’s collateral (if applicable). We have utilized market information, as available, or present value techniques to estimate the amounts required to be disclosed.
The following is a summary of borrowings as of September 30, 2018 and December 31, 2017 (dollars in thousands):
September 30, 2018 | December 31, 2017 | ||||||
Fair value | $ | 803,602 | $ | 770,537 | |||
Recorded value(1) | 815,249 | 780,545 | |||||
(1) | Recorded value does not include deferred financing costs of $3.9 million and $5.3 million as of September 30, 2018 and December 31, 2017, respectively. |
Derivative Instruments—As of September 30, 2018 and December 31, 2017, we had five interest rate swaps that fixed LIBOR on $570 million of our unsecured term loan facilities (“Term Loans”). All interest rate swap agreements are measured at fair value on a recurring basis. The valuation of these instruments is determined using widely accepted valuation techniques, including discounted cash flow analysis on the expected cash flows of each derivative. This analysis reflects the contractual terms of the derivatives, including the period to maturity, and uses observable market-based inputs, including interest rate curves and implied volatilities. The fair values of interest rate swaps are determined using the market standard methodology of netting the discounted future fixed cash receipts (or payments) and the discounted expected variable cash payments (or receipts). The variable cash payments (or receipts) are based on an expectation of future interest rates (forward curves) derived from observable market interest rate curves.
In accordance with ASC 820 Fair Value Measurement, we incorporate credit valuation adjustments to appropriately reflect both our own nonperformance risk and the respective counterparty’s nonperformance risk in the fair value measurements. In adjusting the fair value of our derivative contracts for the effect of nonperformance risk, we have considered the impact of netting and any applicable credit enhancements, such as collateral postings, thresholds, mutual puts, and guarantees.
Although we determined that the significant inputs used to value our derivatives fell within Level 2 of the fair value hierarchy, the credit valuation adjustments associated with our counterparties and our own credit risk utilize Level 3 inputs, such as estimates of current credit spreads, to evaluate the likelihood of default by us and our counterparties. However, as of September 30, 2018 and December 31, 2017, we have assessed the significance of the impact of the credit valuation adjustments on the overall valuation of our derivative positions and have determined that the credit valuation adjustments are not significant to the overall valuation of our derivatives. As a result, we have determined that our derivative valuations in their entirety are classified in Level 2 of the fair value hierarchy.
9
We record derivative assets in Other Assets, Net and derivative liabilities in Accounts Payable and Other Liabilities on our consolidated balance sheets. The fair value measurements of our derivative assets and liabilities as of September 30, 2018 and December 31, 2017, were as follows (in thousands):
September 30, 2018 | December 31, 2017 | ||||||
Derivative asset: | |||||||
Interest rate swaps designated as hedging instruments - Term Loans | $ | 15,216 | $ | 6,544 | |||
Derivative liability: | |||||||
Interest rate swaps designated as hedging instruments - Term Loans | $ | — | $ | 85 | |||
Interest rate swaps not designated as hedging instruments - mortgage notes | — | 255 | |||||
Total | $ | — | $ | 340 | |||
5. INVESTMENT IN UNCONSOLIDATED JOINT VENTURE |
In March 2016, we entered into a joint venture (“Joint Venture”) where we may contribute up to $50 million in equity. The following table summarizes the cumulative activity related to our unconsolidated Joint Venture as of September 30, 2018 and December 31, 2017 (dollars in thousands):
September 30, 2018 | December 31, 2017 | ||||||
Ownership percentage | 20 | % | 20 | % | |||
Number of shopping centers | 13(1) | 14 | |||||
Cumulative equity contribution | $ | 17,456 | $ | 17,456 | |||
Cumulative distributions | 7,200 | 950 | |||||
(1) | The Joint Venture sold a property in September 2018. |
6. REAL ESTATE ACQUISITIONS |
During the nine months ended September 30, 2018 and 2017, we acquired one and nine grocery-anchored shopping centers, respectively. None of these acquisitions were considered business combinations, but rather were classified as asset acquisitions. As such, most acquisition-related costs were capitalized and are included in the total purchase prices shown below. Our real estate asset acquired during the nine months ended September 30, 2018, was as follows (dollars in thousands):
Property Name | Location | Anchor Tenant | Acquisition Date | Purchase Price | Square Footage | Leased % of Rentable Square Feet at Acquisition | ||||||||
Arlington Station | Arlington, TX | Walmart | 1/19/2018 | $ | 18,483 | 113,742 | 92.4% | |||||||
During the nine months ended September 30, 2017, we acquired the following real estate assets (dollars in thousands):
Property Name | Location | Anchor Tenant | Acquisition Date | Purchase Price | Square Footage | Leased % of Rentable Square Feet at Acquisition | ||||||||||
Herndon Station | Fresno, CA | Save Mart | 2/10/2017 | $ | 16,934 | 95,370 | 96.1 | % | ||||||||
Windmill Station | Clovis, CA | Save Mart(1) | 2/10/2017 | 9,665 | 27,486 | 100.0 | % | |||||||||
Plaza 23 Station | Pompton Plains, NJ | Stop & Shop | 2/27/2017 | 52,375 | 161,035 | 95.5 | % | |||||||||
Bells Fork Station | Greenville, NC | Harris Teeter | 3/1/2017 | 9,609 | 71,666 | 91.7 | % | |||||||||
Evans Towne Centre | Evans, GA | Publix | 5/9/2017 | 12,030 | 75,668 | 92.2 | % | |||||||||
Riverlakes Village | Bakersfield, CA | Vons | 6/16/2017 | 24,337 | (2) | 92,212 | 95.8 | % | ||||||||
Ormond Beach Station | Ormond Beach, FL | Publix | 7/12/2017 | 13,023 | 94,275 | 85.2 | % | |||||||||
Mansfield Station | Mansfield, TX | Sprouts Farmers Market | 9/6/2017 | 18,061 | 55,400 | 90.3 | % | |||||||||
Heritage Plaza Station | Carol Stream, IL | Jewel-Osco | 9/28/2017 | 22,219 | (2) | 128,870 | 91.4 | % | ||||||||
(1) | We do not own the portion of the shopping center that contains the grocery anchor. |
(2) | The purchase price includes the fair value of debt assumed as part of the acquisition. |
10
The fair value at acquisition as well as weighted-average useful life for in-place, above-market, and below-market lease intangibles acquired during the nine months ended September 30, 2018 and 2017, are as follows (dollars in thousands, weighted-average useful life in years):
2018 | 2017 | |||||||||||
Fair Value | Weighted-Average Useful Life | Fair Value | Weighted-Average Useful Life | |||||||||
Acquired in-place leases | $ | 1,751 | 8 | $ | 17,345 | 10 | ||||||
Acquired above-market leases | 275 | 9 | 1,639 | 8 | ||||||||
Acquired below-market leases | (564 | ) | 13 | (5,543 | ) | 18 | ||||||
7. DEBT OBLIGATIONS, NET |
The following is a summary of the outstanding principal balances and interest rates, which include the effect of derivative financial instruments, of our debt obligations as of September 30, 2018 and December 31, 2017 (dollars in thousands):
Interest Rate | September 30, 2018 | December 31, 2017 | |||||||
Revolving credit facility(1) | 3.73% | $ | 122,357 | $ | 57,357 | ||||
Term loans(2) | 2.24% - 4.09% | 570,000 | 570,000 | ||||||
Mortgages payable(3) | 3.45% - 6.00% | 119,777 | 149,081 | ||||||
Assumed below-market debt adjustments, net(4) | 3,115 | 4,107 | |||||||
Deferred financing costs, net(5) | (3,913 | ) | (5,270 | ) | |||||
Total | $ | 811,336 | $ | 775,275 | |||||
(1) | The revolving credit facility matures in January 2019, with an option to extend the maturity date to July 2019. Gross borrowings under our revolving credit facility were $114.0 million and gross payments on our revolving credit facility were $49.0 million during the nine months ended September 30, 2018. The revolving credit facility has a maximum capacity of $350 million. The revolving credit facility is expected to be paid in full at closing of the proposed Merger. |
(2) | Of the outstanding Term Loans balance, $185 million matures in July 2019 with options to extend to 2021, $185 million matures in June 2020 with an option to extend to 2021, and $200 million matures in 2024. A maturity date extension requires the payment of an extension fee of 0.15% of the outstanding principal amount of the corresponding tranche. Our outstanding Term Loans are expected to be refinanced or assumed by PECO at closing of the proposed Merger. |
(3) | Due to the non-recourse nature of our fixed-rate mortgages, the assets and liabilities of the properties securing such mortgages are neither available to pay the debts of the consolidated property-holding limited liability companies, nor do they constitute obligations of such consolidated limited liability companies as of September 30, 2018 and December 31, 2017. |
(4) | Net of accumulated amortization of $2.0 million as of September 30, 2018 and December 31, 2017. |
(5) | Net of accumulated amortization of $3.5 million and $2.6 million as of September 30, 2018 and December 31, 2017, respectively. |
As of September 30, 2018 and December 31, 2017, the weighted-average interest rate, including the effect of derivative financial instruments, for all of our debt obligations was 3.4% and 3.5%, respectively.
The allocation of total debt between fixed and variable-rate and between secured and unsecured, excluding market debt adjustments and deferred financing costs, as of September 30, 2018 and December 31, 2017, is summarized below (in thousands):
September 30, 2018 | December 31, 2017 | ||||||
As to interest rate:(1) | |||||||
Fixed-rate debt | $ | 689,777 | $ | 719,081 | |||
Variable-rate debt | 122,357 | 57,357 | |||||
Total | $ | 812,134 | $ | 776,438 | |||
As to collateralization: | |||||||
Unsecured debt | $ | 692,357 | $ | 627,357 | |||
Secured debt | 119,777 | 149,081 | |||||
Total | $ | 812,134 | $ | 776,438 | |||
(1) | Includes the effects of derivative financial instruments (see Notes 4 and 9). |
11
8. COMMITMENTS AND CONTINGENCIES |
Litigation—We are involved in various claims and litigation matters arising in the ordinary course of business, some of which involve claims for damages. Many of these matters are covered by insurance, although they may nevertheless be subject to deductibles or retentions. Although the ultimate liability for these matters cannot be determined, based upon information currently available, we believe the resolution of such claims and litigation will not have a material adverse effect on our consolidated financial statements.
Environmental Matters—In connection with the ownership and operation of real estate, we may potentially be liable for costs and damages related to environmental matters. In addition, we may own or acquire certain properties that are subject to environmental remediation. Generally, the seller of the property, the tenant of the property, and/or another third party is responsible for environmental remediation costs related to a property. Additionally, in connection with the purchase of certain properties, the respective sellers and/or tenants may agree to indemnify us against future remediation costs. We also carry environmental liability insurance on our properties that provides limited coverage for any remediation liability and/or pollution liability for third-party bodily injury and/or property damage claims for which we may be liable. We are not aware of any environmental matters which we believe are reasonably likely to have a material effect on our consolidated financial statements.
9. DERIVATIVES AND HEDGING ACTIVITIES |
Risk Management Objective of Using Derivatives—We are exposed to certain risks arising from both our business operations and economic conditions. We principally manage our exposure to a wide variety of business and operational risks through management of our core business activities. We manage economic risks, including interest rate, liquidity, and credit risk, primarily by managing the amount, sources, and duration of our debt funding and the use of derivative financial instruments. Specifically, we enter into interest rate swaps to manage exposures that arise from business activities that result in the receipt or payment of future known and uncertain cash amounts, the value of which are determined by interest rates. Our derivative financial instruments are used to manage differences in the amount, timing, and duration of our known or expected cash receipts and our known or expected cash payments principally related to our investments and borrowings.
Cash Flow Hedges of Interest Rate Risk—Interest rate swaps designated as cash flow hedges involve the receipt of variable amounts from a counterparty in exchange for our making fixed-rate payments over the life of the agreements without exchange of the underlying notional amount.
The changes in the fair value of derivatives designated, and that qualify, as cash flow hedges are recorded in AOCI and are subsequently reclassified into earnings in the period that the hedged forecasted transaction affects earnings. During the nine months ended September 30, 2018 and 2017, such derivatives were used to hedge the variable cash flows associated with certain variable-rate debt. The ineffectiveness previously reported in earnings for the period ended September 30, 2017, was adjusted to reflect application of the provisions of ASU 2017-12, Derivatives and Hedging (Topic 815), as of the beginning of 2017. This adjustment was not material.
Amounts reported in AOCI related to these derivatives will be reclassified to Interest Expense, Net as interest payments are made on the variable-rate debt. During the next twelve months, we estimate that an additional $5.9 million will be reclassified from Other Comprehensive Income (“OCI”) as a decrease to Interest Expense, Net.
The following is a summary of our interest rate swaps that were designated as cash flow hedges of interest rate risk as of September 30, 2018 and December 31, 2017 (notional amount in thousands):
2018 | 2017 | ||||||
Count | 5 | 5 | |||||
Notional Amount | $ | 570,000 | $ | 570,000 | |||
Fixed LIBOR | 0.7%-2.2% | 0.7%-2.2% | |||||
Maturity Date | 2019-2024 | 2019-2024 | |||||
The table below details the location of the gain or loss recognized on interest rate derivatives designated as cash flow hedges in the consolidated statements of operations and comprehensive (loss) income for the three and nine months ended September 30, 2018 and 2017 (in thousands):
Three Months Ended September 30, | Nine Months Ended September 30, | ||||||||||||||
2018 | 2017 | 2018 | 2017 | ||||||||||||
Amount of gain recognized in OCI on derivative(1) | $ | 1,836 | $ | 152 | $ | 10,654 | $ | 16 | |||||||
Amount of (gain) loss reclassified from AOCI into interest expense(1) | (957 | ) | (195 | ) | (1,897 | ) | 43 | ||||||||
(1) | Increases in gains are solely driven from changes in the LIBOR rate and LIBOR futures. |
12
10. EQUITY |
On May 9, 2018, our board of directors increased its EVPS of our common stock from $22.75 to $22.80 based substantially on the estimated market value of our portfolio of real estate properties as of March 31, 2018. We engaged a third party valuation firm to provide a calculation of the range in EVPS of our common stock as of March 31, 2018, which reflected certain balance sheet assets and liabilities as of that date. Shares of our common stock are issued under the DRIP and redeemed under the Share Repurchase Program (“SRP”), as discussed below, at the same price as the estimated value per share in effect at the time of issuance or redemption.
Distribution Reinvestment Plan—The DRIP allows stockholders to invest distributions in additional shares of our common stock. Stockholders who elect to participate in the DRIP, and who are subject to U.S. federal income taxation laws, will incur a tax liability on an amount equal to the fair value on the relevant distribution date of the shares of our common stock purchased with reinvested distributions, even though such stockholders have elected not to receive the distributions in cash. In connection with the proposed Merger, the DRIP was temporarily suspended for the month of July 2018; as a result, all DRIP participants received their July 2018 distributions in cash rather than in stock. The DRIP resumed in August 2018, with the distribution paid in September 2018.
Share Repurchase Program—The SRP provides an opportunity for stockholders to have shares of common stock repurchased, subject to certain restrictions and limitations. The cash available for repurchases on any particular date will generally be limited to the proceeds from the DRIP during the preceding four fiscal quarters, less amounts already used for repurchases since the beginning of that period. Our board of directors reserves the right, in its sole discretion, at any time and from time to time, to reject any request for repurchase. In connection with the proposed Merger, we also temporarily suspended the SRP for the month of July 2018 and resumed in August 2018.
During the nine months ended September 30, 2018, repurchase requests surpassed the funding limits under the SRP. When we are unable to fulfill all repurchase requests in a given month, we will honor requests on a pro rata basis to the extent funds are available. We will continue to fulfill repurchases sought upon a stockholder’s death, “qualifying disability,” or “determination of incompetence” in accordance with the terms of the SRP.
Approximately 0.9 million shares of our common stock were repurchased under the SRP during the nine months ended September 30, 2018. In October 2018, approximately 137,000 shares of our common stock were repurchased under the SRP. Repurchase requests in connection with a stockholder’s death, “qualifying disability,” or “determination of incompetence” were completed in full. The remaining repurchase requests that were in good order were fulfilled on a pro rata basis.
In connection with the proposed Merger, the combined company will be required to reset its share repurchase queue. As a result, all SRP requests currently on file will be canceled on the date the Merger closes. All stockholders wishing to participate in the SRP after the Merger must submit a new SRP form to the transfer agent, DST, after the Merger to be included in the next standard repurchase of the combined company. All standard repurchase requests must be on file and in good order to be included for next standard repurchase of the combined company, which is expected to be in July 2019. At that time, should the demand for standard redemptions exceed the funding available for repurchases, the combined company is expected to make pro-rata redemptions. Following that standard repurchase, standard repurchase requests that are on file with the combined company and in good order that have not been fully executed (due to pro rata redemptions), will remain on file for future redemptions.
Class B Units—The Operating Partnership issues limited partnership units that are designated as Class B units for asset management services provided by PECO. The vesting of the Class B units is contingent upon a market condition and service condition. We had 0.5 million and 0.4 million unvested Class B units outstanding as of September 30, 2018 and December 31, 2017, respectively. We anticipate the outstanding Class B units will remain unvested upon completion of the Merger, and are therefore expected to be retired at that time.
11. EARNINGS PER SHARE |
We use the two-class method of computing earnings per share (“EPS”), which is an earnings allocation formula that determines EPS for common stock and any participating securities according to dividends declared (whether paid or unpaid). Under the two-class method, basic EPS is computed by dividing the income available to common stockholders by the weighted-average number of shares of common stock outstanding for the period. Diluted EPS reflects the potential dilution that could occur from share equivalent activity.
Restricted stock is granted under our 2013 Independent Director Stock Plan and is potentially dilutive. There were 6,900 and 5,000 unvested restricted stock awards outstanding as of September 30, 2018 and 2017, respectively. During periods of net loss, these securities are anti-dilutive and, as a result, are excluded from the weighted-average common shares used to calculate diluted EPS.
Class B units are participating securities as they contain non-forfeitable rights to dividends or dividend equivalents, and are potentially dilutive due to their right of conversion to common stock upon vesting. There were 0.5 million and 0.4 million Class B units of the Operating Partnership outstanding as of September 30, 2018 and 2017, respectively. The vesting of the Class B units is contingent upon satisfaction of a market condition and service condition. Since the satisfaction of both conditions was not probable as of September 30, 2018 and 2017, the Class B units remained unvested and thus were not included in the diluted net loss per share computations.
13
12. RELATED PARTY TRANSACTIONS |
Economic Dependency—We are dependent on PECO for certain services that are essential to us, including asset acquisition and disposition decisions, asset management, operating and leasing of our properties, and other general and administrative responsibilities. In the event that PECO is unable to provide such services, we would be required to find alternative service providers, which could result in higher costs and expenses.
Advisor—Our current Advisory Agreement became effective September 1, 2017. Pursuant to the Advisory Agreement, the Advisor is entitled to specified fees for certain services, including managing our day-to-day activities and implementing our investment strategy. The Advisor manages our day-to-day affairs and our portfolio of real estate investments subject to the board of directors’ supervision.
Asset Management Fee and Subordinated Participation
Date | Rate | Payable | Description |
January 1, 2016 through August 31, 2017 | 1.00% | 80% in cash; 20% in Class B units | The cash portion was paid on a monthly basis in arrears at the rate of 0.06667% multiplied by the cost of our assets as of the last day of the preceding monthly period. The Class B unit portion was issued on a quarterly basis at the rate of 0.05% multiplied by the lower of the cost of assets and the applicable quarterly net asset value (“NAV”), divided by the per share NAV. |
Beginning September 1, 2017 | 0.85% | 80% in cash; 20% in Class B units | The cash portion is paid on a monthly basis in arrears at the rate of 0.05667% multiplied by the cost of our assets as of the last day of the preceding monthly period. The Class B unit portion is issued on a quarterly basis at the rate of 0.0425% multiplied by the lower of the cost of assets and the applicable quarterly NAV, divided by the per share NAV. |
The Advisor is entitled to receive distributions on the Class B units at the same rate as distributions are paid to common stockholders. Such distributions are in addition to the incentive compensation that the Advisor and its affiliates may receive from us. During the nine months ended September 30, 2018 and 2017, the Operating Partnership issued 59,182 and 69,341 Class B units, respectively, to the Advisor for asset management services performed. Prior to September 2017, a portion of the asset management fee and subordinated participation, and distributions on Class B units, were paid to a former third-party advisor. Effective September 2017, this relationship was terminated.
Other Advisory Fees and Reimbursements Paid in Cash
Fee Type | Date | Rate | Description |
Acquisition fee | January 1, 2015 though August 31, 2017 | 1.00% | Equal to the product of (x) the rate and (y) the cost of investments we acquired or originated, including any debt attributable to such investments. |
Beginning September 1, 2017 | 0.85% | ||
Acquisition expenses | Beginning January 1, 2015 | N/A | Reimbursements for direct expenses, including certain personnel costs, incurred related to selecting, evaluating, and acquiring assets on our behalf. |
Disposition fee(1) | January 1, 2015 through August 31, 2017 | 2.00% | Equal to the lesser of: (i) the product of the rate and the contract sales price of each property or other investment sold; or (ii) one-half of the total brokerage commissions paid if a non-affiliated broker is also involved in the sale, provided that total real estate commissions paid (to the Advisor and others) in connection with the sale may not exceed the lesser of a competitive real estate commission or 6% of the contract sales price. |
Beginning September 1, 2017 | 1.70% | ||
(1) | We will not pay any disposition fees in connection with the proposed Merger. |
General and Administrative Expenses—As of September 30, 2018 and December 31, 2017, we owed the Advisor and its affiliates approximately $66,000 and $119,000, respectively, for general and administrative expenses paid on our behalf.
14
Summarized below are the fees earned by and the expenses reimbursable to the Advisor and former advisor for the three and nine months ended September 30, 2018 and 2017. As of September 2017, pursuant to the termination of the relationship with our former advisor, they were no longer entitled to these fees and reimbursements. This table includes any related amounts unpaid as of September 30, 2018 and December 31, 2017, except for unpaid general and administrative expenses, which we disclose above (in thousands):
Three Months Ended | Nine Months Ended | Unpaid Amount as of | |||||||||||||||||||||
September 30, | September 30, | September 30, | December 31, | ||||||||||||||||||||
2018 | 2017 | 2018 | 2017 | 2018 | 2017 | ||||||||||||||||||
Acquisition fees and expenses(1) | $ | — | $ | 627 | $ | 200 | $ | 2,093 | $ | — | $ | — | |||||||||||
Asset management fees(2) | 2,889 | 3,056 | 8,650 | 9,192 | 15 | 48 | |||||||||||||||||
Class B units distribution(3) | 195 | 185 | 562 | 536 | 66 | 56 | |||||||||||||||||
Total | $ | 3,084 | $ | 3,868 | $ | 9,412 | $ | 11,821 | $ | 81 | $ | 104 | |||||||||||
(1) | The majority of acquisition fees and expenses are capitalized and allocated to the related investment in real estate assets on the consolidated balance sheet based on the acquisition-date fair values of the respective assets and liability acquired. |
(2) | Asset management fees are presented in General and Administrative on the consolidated statements of operations. |
(3) | Represents the distributions paid to holders of Class B units of the Operating Partnership and is presented in General and Administrative on the consolidated statements of operations. |
Manager—All of our properties are managed and leased by the Manager. The Manager also manages properties owned by PECO affiliates or other third parties. Below is a summary of fees charged by and expenses reimbursable to the Manager as outlined in the Management Agreements.
Manager Fees and Reimbursements Paid in Cash
Fee Type | Rate | Description |
Property Management | 4.00% | Equal to the product of (x) the monthly gross cash receipts from the properties managed and (y) the rate. |
Leasing Commissions | Market Rate | Fees for leasing services rendered with respect to a particular property, including if a tenant exercised an option to extend an existing lease. The fee may be increased by up to 50% if a co-broker is engaged to lease a particular vacancy. |
Construction Management | Market Rate | Paid for construction management services rendered with respect to a particular property. |
Other Expenses and Reimbursements | N/A | Costs and expenses incurred by the Manager on our behalf, including certain employee compensation, legal, travel, and other out-of-pocket expenses that were directly related to the management of specific properties and corporate matters, as well as fees and expenses of third-party accountants. |
Summarized below are the fees earned by and the expenses reimbursable to the Manager for the three and nine months ended September 30, 2018 and 2017, and any related amounts unpaid as of September 30, 2018 and December 31, 2017 (in thousands):
Three Months Ended | Nine Months Ended | Unpaid Amount as of | |||||||||||||||||||||
September 30, | September 30, | September 30, | December 31, | ||||||||||||||||||||
2018 | 2017 | 2018 | 2017 | 2018 | 2017 | ||||||||||||||||||
Property management fees(1) | $ | 1,617 | $ | 1,462 | $ | 5,048 | $ | 4,354 | $ | 474 | $ | 580 | |||||||||||
Leasing commissions(2) | 1,253 | 934 | 3,922 | 2,555 | 353 | 202 | |||||||||||||||||
Construction management fees(2) | 309 | 356 | 511 | 577 | 188 | 260 | |||||||||||||||||
Other fees and reimbursements(3) | 965 | 908 | 2,223 | 2,663 | 366 | 491 | |||||||||||||||||
Total | $ | 4,144 | $ | 3,660 | $ | 11,704 | $ | 10,149 | $ | 1,381 | $ | 1,533 | |||||||||||
(1) | The property management fees are included in Property Operating on the consolidated statements of operations. |
(2) | Leasing commissions paid for leases with terms less than one year are expensed immediately and included in Depreciation and Amortization on the consolidated statements of operations. Leasing commissions paid for leases with terms greater than one year, and construction management fees, are capitalized and amortized over the life of the related leases or assets. |
(3) | Other fees and reimbursements are included in Property Operating and General and Administrative on the consolidated statements of operations based on the nature of the expense. |
Unconsolidated Joint Venture—We had a receivable from the Joint Venture of approximately $14,000 as of September 30, 2018, and a payable to the Joint Venture of approximately $52,000 as of December 31, 2017, all primarily related to activity at the six properties contributed by us to the Joint Venture.
15
13. SUBSEQUENT EVENTS |
Distributions to Stockholders—Distributions were paid subsequent to September 30, 2018, as follows (in thousands, except distribution rate):
Month | Record Date | Distribution Rate | Date Distribution Paid | Gross Amount of Distribution Paid | Distribution Reinvested through the DRIP | Net Cash Distribution | ||||||||||||||
September | 9/17/2018 | $ | 0.13541652 | 10/1/2018 | $ | 6,327 | $ | 2,684 | $ | 3,643 | ||||||||||
October | 10/15/2018 | 0.13541652 | 11/1/2018 | 6,338 | 2,649 | 3,689 | ||||||||||||||
16
ITEM 2. MANAGEMENT’S DISCUSSION AND ANALYSIS OF FINANCIAL CONDITION AND RESULTS OF OPERATIONS
Cautionary Note Regarding Forward-Looking Statements
Certain statements contained in this Quarterly Report on Form 10-Q of Phillips Edison Grocery Center REIT II, Inc. (“we,” the “Company,” “our,” or “us”) other than historical facts may be considered forward-looking statements within the meaning of Section 27A of the Securities Act of 1933, as amended (the “Securities Act”), and Section 21E of the Securities Exchange Act of 1934, as amended (the “Exchange Act”). We intend for all such forward-looking statements to be covered by the applicable safe harbor provisions for forward-looking statements contained in those acts. Such statements include, in particular, statements about our plans, strategies, and prospects and are subject to certain risks and uncertainties, including known and unknown risks, which could cause actual results to differ materially from those projected or anticipated. These risks include, without limitation, (i) risks associated with our ability to consummate the proposed Merger and the timing and closing of the Merger; (ii) changes in national, regional, or local economic climates; (iii) local market conditions, including an oversupply of space in, or a reduction in demand for, properties similar to those in our portfolio; (iv) vacancies, changes in market rental rates, and the need to periodically repair, renovate, and re-let space; (v) changes in interest rates and the availability of permanent mortgage financing; (vi) competition from other available properties and the attractiveness of properties in our portfolio to our tenants; (vii) the financial stability of tenants, including the ability of tenants to pay rent; (viii) changes in tax, real estate, environmental, and zoning laws; (ix) the concentration of our portfolio in a limited number of industries, geographies, or investments; and (x) any of the other risks included in this Quarterly Report on Form 10-Q. Therefore, such statements are not intended to be a guarantee of our performance in future periods. Such forward-looking statements can generally be identified by our use of forward-looking terminology such as “may,” “will,” “expect,” “intend,” “anticipate,” “estimate,” “believe,” “continue,” or other similar words. Readers are cautioned not to place undue reliance on these forward-looking statements, which speak only as of the date this report is filed with the SEC. We make no representations or warranties (express or implied) about the accuracy of any such forward-looking statements contained in this Quarterly Report on Form 10-Q, and we do not intend to publicly update or revise any forward-looking statements, whether as a result of new information, future events, or otherwise.
Any such forward-looking statements are subject to risks, uncertainties, and other factors and are based on a number of assumptions involving judgments with respect to, among other things, future economic, competitive, and market conditions, all of which are difficult or impossible to predict accurately. To the extent that our assumptions differ from actual conditions, our ability to accurately anticipate results expressed in such forward-looking statements, including our ability to generate positive cash flow from operations, make distributions to stockholders, and maintain the value of our real estate properties, may be significantly hindered.
See Part II, Item 1A. Risk Factors of this Form 10-Q and Part I, Item 1A. Risk Factors of our 2017 Annual Report on Form 10-K, filed with the SEC on March 27, 2018, for a discussion of some of the risks and uncertainties, although not all of the risks and uncertainties, that could cause actual results to differ materially from those presented in our forward-looking statements. Except as required by law, we do not undertake any obligation to update or revise any forward-looking statements contained in this Form 10-Q. Important factors that could cause actual results to differ materially from the forward-looking statements are disclosed in Part II, Item 1A. Risk Factors and Part I, Item 2. Management’s Discussion and Analysis of Financial Condition and Results of Operations of this Form 10-Q.
All references to “Notes” throughout this document refer to the footnotes to the consolidated financial statements in Part I, Item 1. Financial Statements.
Overview
We are a public non-traded real estate investment trust (“REIT”) that invests in retail real estate properties. Our primary focus is on grocery-anchored neighborhood and community shopping centers that meet the day-to-day needs of residents in the surrounding trade areas. As of September 30, 2018, we wholly-owned 86 real estate properties acquired from third parties unaffiliated with us or PECO. In addition, we own a 20% equity interest in a joint venture, which owned 13 real estate properties as of September 30, 2018.
In July 2018 we entered into the Merger Agreement with PECO. Pursuant to the Merger Agreement, PECO will issue 2.04 shares of PECO common stock in exchange for each share of our common stock, which is equivalent to $22.54 per share based on PECO’s most recent EVPS of $11.05. The exchange ratio reflects our most recent estimated value per share, adjusted for estimated transaction-related expenses. We will not pay any internalization or disposition fees in connection with the proposed Merger as no value consideration was given for the advisory services that PECO provides to us. Our outstanding debt, excluding the revolving credit facility, is expected to be refinanced or assumed by PECO at closing under the terms of the Merger Agreement. For a more detailed discussion, see Note 3.
17
Below are statistical highlights of our wholly-owned portfolio:
Total Portfolio as of September 30, 2018 | Property Acquisitions During the Nine Months Ended September 30, 2018 | ||||
Number of properties | 86 | 1 | |||
Number of states | 24 | 1 | |||
Total square feet (in thousands) | 10,342 | 114 | |||
Leased % of rentable square feet | 94.7 | % | 92.4 | % | |
Average remaining lease term (in years)(1) | 5.0 | 7.3 | |||
(1) | As of September 30, 2018. The average remaining lease term in years excludes future options to extend the term of the lease. |
Lease Expirations—The following chart shows, on an aggregate basis, all of the scheduled lease expirations after September 30, 2018, for each of the next ten years and thereafter for our 86 wholly-owned shopping centers. The chart shows the leased square feet and annualized base rent (“ABR”) represented by the applicable lease expiration year: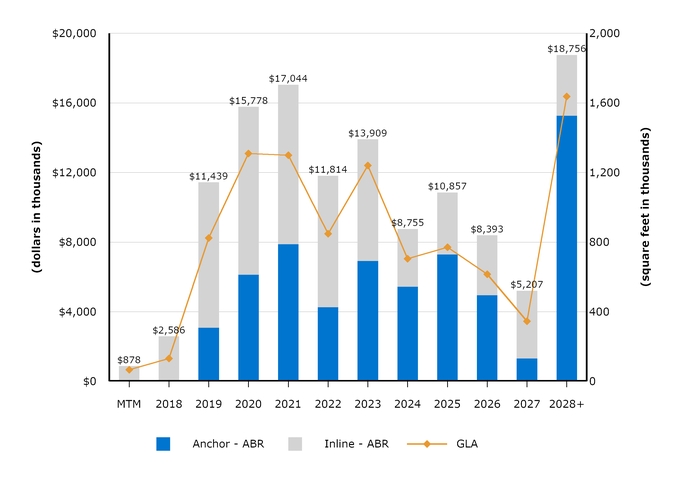 Subsequent to September 30, 2018, we renewed approximately 31,000 total square feet and $0.7 million of total ABR of the leases expiring.
Subsequent to September 30, 2018, we renewed approximately 31,000 total square feet and $0.7 million of total ABR of the leases expiring.18
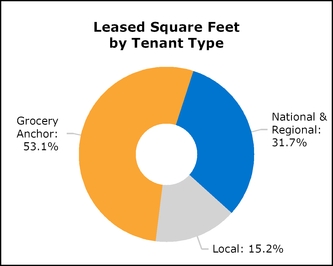
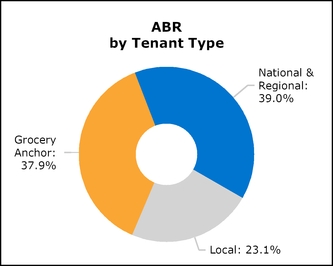
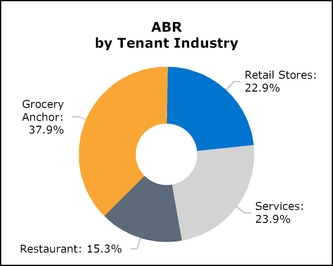
Portfolio Tenancy—We define national tenants as those tenants that operate in at least three states. Regional tenants are defined as those tenants that have at least three locations. The following charts present the composition of our portfolio by tenant type as of September 30, 2018:
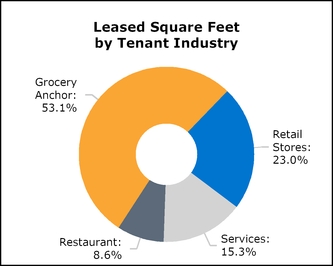
The following charts present the composition of our portfolio by tenant industry as of September 30, 2018 (dollars and square feet in thousands):
The following table presents our top ten tenants, grouped according to parent company, by ABR as of September 30, 2018 (dollars and square feet in thousands):
Tenant | ABR | % of ABR | Leased Square Feet | % of Leased Square Feet | Number of Locations(1) | |||||||||||
Publix Super Markets | $ | 8,157 | 6.5 | % | 843 | 8.6 | % | 18 | ||||||||
Albertsons Companies | 7,208 | 5.7 | % | 716 | 7.3 | % | 12 | |||||||||
Ahold Delhaize | 6,421 | 5.1 | % | 389 | 4.0 | % | 6 | |||||||||
Walmart | 5,820 | 4.6 | % | 903 | 9.2 | % | 7 | |||||||||
Kroger | 5,512 | 4.4 | % | 792 | 8.1 | % | 12 | |||||||||
Giant Eagle | 2,776 | 2.2 | % | 273 | 2.8 | % | 4 | |||||||||
Sprouts Farmers Market | 1,843 | 1.5 | % | 109 | 1.1 | % | 4 | |||||||||
Save Mart Supermarkets | 1,775 | 1.4 | % | 208 | 2.1 | % | 4 | |||||||||
T.J. Maxx | 1,371 | 1.1 | % | 108 | 1.1 | % | 4 | |||||||||
Subway | 1,109 | 0.9 | % | 46 | 0.5 | % | 32 | |||||||||
$ | 41,992 | 33.4 | % | 4,387 | 44.8 | % | 103 | |||||||||
(1) | Number of locations excludes auxiliary leases with grocery anchors such as fuel stations, pharmacies, and liquor stores. |
19
Results of Operations
We wholly-owned 86 properties as of September 30, 2018, and 83 properties as of September 30, 2017. The Same-Center column in the tables below includes the 74 properties that were owned and operational prior to January 1, 2017. The Non-Same-Center column includes properties that were acquired after December 31, 2016, in addition to corporate-level income and expenses. In this section, we primarily explain fluctuations in activity shown in the Same-Center column as well as any notable fluctuations in the Non-Same-Center column related to corporate-level activity. Unless otherwise discussed below, year-over-year comparative differences for the three and nine months ended September 30, 2018 and 2017, are almost entirely attributable to the number of properties owned and the length of ownership of these properties.
Summary of Operating Activities for the Three Months Ended September 30, 2018 and 2017
Favorable (Unfavorable) Change | |||||||||||||||||||
(In thousands, except per share amounts) | 2018 | 2017 | Change | Non-Same-Center | Same-Center | ||||||||||||||
Operating Data: | |||||||||||||||||||
Total revenues | $ | 44,487 | $ | 40,971 | $ | 3,516 | $ | 2,125 | $ | 1,391 | |||||||||
Property operating expenses | (6,966 | ) | (6,264 | ) | (702 | ) | (295 | ) | (407 | ) | |||||||||
Real estate tax expenses | (7,143 | ) | (5,783 | ) | (1,360 | ) | (178 | ) | (1,182 | ) | |||||||||
General and administrative expenses | (4,811 | ) | (5,110 | ) | 299 | 335 | (36 | ) | |||||||||||
Termination of affiliate arrangements | — | (5,962 | ) | 5,962 | 5,962 | — | |||||||||||||
Depreciation and amortization | (19,195 | ) | (18,037 | ) | (1,158 | ) | (983 | ) | (175 | ) | |||||||||
Interest expense, net | (7,261 | ) | (5,691 | ) | (1,570 | ) | (1,570 | ) | — | ||||||||||
Transaction expenses | (1,742 | ) | — | (1,742 | ) | (1,742 | ) | — | |||||||||||
Other income, net | 888 | 19 | 869 | 900 | (31 | ) | |||||||||||||
Net loss | $ | (1,743 | ) | $ | (5,857 | ) | $ | 4,114 | $ | 4,554 | $ | (440 | ) | ||||||
Net loss per share - basic and diluted | $ | (0.04 | ) | $ | (0.13 | ) | $ | 0.09 | |||||||||||
Total revenues—Of the $3.5 million increase in total revenues, $2.1 million was related to our 12 non-same-center properties. The remaining variance was the result of an increase in revenue among same-center properties, primarily due to a $0.5 million increase in minimum rent, which was driven by a $0.17, or 1.4%, increase in same-center minimum rent per square foot since September 30, 2017. The growth in rental income was partially offset by a $0.3 million reduction in straight-line rent adjustments. We also saw an increase of $1.2 million in our tenant recovery income, as a result of improved recovery rates of 1.0% and higher recoverable expenses.
Property operating expenses—Of the $0.7 million increase in property operating expenses, $0.3 million was related to our 12 non-same-center properties. The remaining variance was primarily attributable to a $0.3 million increase in bad debt expense related to tenant bankruptcies and evictions.
Real estate tax expenses—Of our increase in same-center real estate tax expenses, $0.7 million was due to a decrease in favorable tax appeal results in the current quarter. The remaining variance was related to reassessments in several states, which increased for the 2018 tax year, including several properties being reassessed for the first time since they were purchased.
Termination of affiliate arrangements—The $6.0 million termination of affiliate arrangements was related to the termination of our relationship with our former advisor. In exchange for a payment of $6.0 million, our former advisor sold the 77,243 Class B units they owned back to the Operating Partnership at our $22.75 NAV per share at that date, redeemed all of their interests in a special limited partner interest co-owned with the PECO sponsor, and terminated all fee-sharing arrangements with us.
Interest expense, net—Our increase in interest expense was driven by our increase in total debt borrowings and our weighted-average interest rate, which was partially offset by savings from refinancing certain property-level debt through our revolving credit facility in the current year. The weighted-average interest rate and maturity as of September 30, 2018, were 3.4% and 2.7 years, respectively, compared to a weighted-average interest rate and maturity of 3.1% and 3.9 years, respectively, as of September 30, 2017. The decrease in our average debt maturity is due to an increase in borrowings on the revolving credit facility, which is currently set to expire in January 2019. This balance is expected to be paid in full at the closing of the proposed Merger.
Transaction expenses—The $1.7 million of transaction expenses resulted from costs incurred in connection with the proposed Merger, primarily associated with third-party professional fees, such as legal, tax, financial advisor, and consulting fees.
Other income, net—Our $0.9 million increase in other income is primarily from the equity income from our Joint Venture as a result of a gain on a property sale.
20
Summary of Operating Activities for the Nine Months Ended September 30, 2018 and 2017
Favorable (Unfavorable) Change | |||||||||||||||||||
(In thousands, except per share amounts) | 2018 | 2017 | Change | Non-Same-Center | Same-Center | ||||||||||||||
Operating Data: | |||||||||||||||||||
Total revenues | $ | 132,353 | $ | 119,730 | $ | 12,623 | $ | 10,114 | $ | 2,509 | |||||||||
Property operating expenses | (21,124 | ) | (19,059 | ) | (2,065 | ) | (1,412 | ) | (653 | ) | |||||||||
Real estate tax expenses | (21,146 | ) | (18,393 | ) | (2,753 | ) | (1,611 | ) | (1,142 | ) | |||||||||
General and administrative expenses | (13,842 | ) | (15,190 | ) | 1,348 | 1,226 | 122 | ||||||||||||
Termination of affiliate arrangements | — | (5,962 | ) | 5,962 | 5,962 | — | |||||||||||||
Depreciation and amortization | (57,166 | ) | (52,573 | ) | (4,593 | ) | (4,148 | ) | (445 | ) | |||||||||
Interest expense, net | (22,295 | ) | (15,617 | ) | (6,678 | ) | (6,678 | ) | — | ||||||||||
Transaction expenses | (2,237 | ) | — | (2,237 | ) | (2,237 | ) | — | |||||||||||
Other income (expense), net | 842 | (132 | ) | 974 | 758 | 216 | |||||||||||||
Net loss | $ | (4,615 | ) | $ | (7,196 | ) | $ | 2,581 | $ | 1,974 | $ | 607 | |||||||
Net loss per share—basic and diluted | $ | (0.10 | ) | $ | (0.15 | ) | $ | 0.05 | |||||||||||
Total revenues—Of the $12.6 million increase in total revenues, $10.1 million was related to our 12 non-same-center properties. The remaining variance was the result of an increase in revenue among same-center properties, primarily due to a $1.8 million increase in minimum rent, which was driven by a $0.17, or 1.4%, increase in same-center minimum rent per square foot since September 30, 2017. The increase in same-center revenue was also attributed to a $1.7 million increase in tenant recovery income as a result of higher recoverable expenses and a 2.5% increase in our recovery rate. The growth in rental and tenant recovery income was partially offset by a $0.9 million reduction in straight-line rent adjustments.
Property operating expenses—Of the $2.1 million increase in property operating expenses, $1.4 million was related to our 12 non-same-center properties. The remaining variance is primarily attributed to higher recoverable expenses, as well as a $0.3 million increase in bad debt expense related to tenant bankruptcies and evictions.
Real estate tax expenses—Of our increase in same-center real estate tax expenses, $0.6 million was due to a decrease in favorable tax appeal results in the current year. The remaining variance was related to reassessments in several states, which increased expenses for the 2018 tax year, with several properties being reassessed for the first time since they were purchased.
General and administrative expenses—Our decrease in general and administrative expenses was attributable to a $0.5 million reduction in asset management fees as a result of the reduction in the asset management fee rate, a $0.5 million decrease in acquisition expenses on properties not ultimately acquired, and a decrease in legal and consulting fees paid to third parties.
Termination of affiliate arrangements—As discussed above, the $6.0 million termination of affiliate arrangements was related to the termination of our relationship with our former advisor.
Interest expense, net—Our increase in interest expense was driven by our increase in total debt borrowings and our weighted-average interest rate, which was partially offset by savings from refinancing certain property-level debt through our revolving credit facility in the current year. The weighted-average interest rate as of September 30, 2018, was 3.4%, compared to a weighted-average interest rate of 3.1% as of September 30, 2017.
Transaction expenses—The $2.2 million of transaction expenses resulted from costs incurred in connection with the proposed Merger, primarily associated with third-party professional fees, such as legal, tax, financial advisor, and consulting fees.
Other income (expense), net—Of our $1.0 million increase in other income, $0.8 million was primarily from our equity income from our Joint Venture.
21
Leasing Activity—The average rent per square foot and cost of executing leases fluctuates based on the tenant mix, size of the space, and lease term. Leases with national and regional tenants generally require a higher cost per square foot than those with local tenants. However, such tenants will also pay for a longer term. As we continue to attract more of these national and regional tenants, our costs to lease may increase.
Below is a summary of leasing activity for the three months ended September 30, 2018 and 2017:
Total Deals | Inline Deals(1) | |||||||||||||||
2018 | 2017 | 2018 | 2017 | |||||||||||||
New leases: | ||||||||||||||||
Number of leases | 24 | 22 | 24 | 22 | ||||||||||||
Square footage (in thousands) | 53 | 47 | 53 | 47 | ||||||||||||
First-year base rental revenue (in thousands) | $ | 1,051 | $ | 741 | $ | 1,051 | $ | 741 | ||||||||
Average rent per square foot (“PSF”) | $ | 19.98 | $ | 15.64 | $ | 19.98 | $ | 15.64 | ||||||||
Average cost PSF of executing new leases(2) | $ | 38.85 | $ | 21.67 | $ | 38.85 | $ | 21.67 | ||||||||
Number of comparable leases(3) | 8 | 6 | 8 | 6 | ||||||||||||
Comparable rent spread(4) | 9.5 | % | 7.8 | % | 9.5 | % | 7.8 | % | ||||||||
Weighted-average lease term (in years) | 7.6 | 7.4 | 7.6 | 7.4 | ||||||||||||
Renewals and options: | ||||||||||||||||
Number of leases | 50 | 52 | 45 | 51 | ||||||||||||
Square footage (in thousands) | 226 | 132 | 94 | 116 | ||||||||||||
First-year base rental revenue (in thousands) | $ | 3,504 | $ | 2,782 | $ | 2,184 | $ | 2,570 | ||||||||
Average rent PSF | $ | 15.50 | $ | 21.14 | $ | 23.12 | $ | 22.17 | ||||||||
Average rent PSF prior to renewals | $ | 14.14 | $ | 18.87 | $ | 20.98 | $ | 19.80 | ||||||||
Percentage increase in average rent PSF | 9.7 | % | 12.0 | % | 10.2 | % | 12.0 | % | ||||||||
Average cost PSF of executing renewals and options(2) | $ | 2.92 | $ | 4.47 | $ | 4.30 | $ | 4.78 | ||||||||
Number of comparable leases(3) | 38 | 40 | 37 | 40 | ||||||||||||
Comparable rent spread(4) | 14.5 | % | 14.0 | % | 10.8 | % | 14.0 | % | ||||||||
Weighted-average lease term (in years) | 4.9 | 5.1 | 4.8 | 5.1 | ||||||||||||
Portfolio retention rate(5) | 70.7 | % | 81.3 | % | 69.2 | % | 81.3 | % | ||||||||
(1) | We consider an inline deal to be a lease for less than 10,000 square feet of gross leasable area (“GLA”). |
(2) | The cost of executing new leases, renewals, and options includes leasing commissions, tenant improvement costs, and tenant concessions. The costs associated with landlord improvements are excluded for repositioning and redevelopment projects, if any. |
(3) | A comparable lease is a lease that is executed for the exact same space (location and square feet) in which a tenant was previously located. For a lease to be considered comparable, it must have been executed within 365 days from the earlier of legal possession or the day the prior tenant physically vacated the space. |
(4) | The comparable rent spread compares the first year ABR of a new lease over the last year ABR of the prior lease of a unit that was occupied within the past twelve months. |
(5) | The portfolio retention rate is calculated by dividing (a) total square feet of retained tenants with current period lease expirations by (b) the square feet of leases expiring during the period. |
The portfolio retention rate in the current quarter was significantly impacted by several tenants who filed for bankruptcy or were evicted.
22
Below is a summary of leasing activity for the nine months ended September 30, 2018 and 2017(1):
Total Deals | Inline Deals | |||||||||||||||
2018 | 2017 | 2018 | 2017 | |||||||||||||
New leases: | ||||||||||||||||
Number of leases | 88 | 48 | 85 | 47 | ||||||||||||
Square footage (in thousands) | 221 | 115 | 187 | 101 | ||||||||||||
First-year base rental revenue (in thousands) | $ | 3,800 | $ | 1,889 | $ | 3,382 | $ | 1,740 | ||||||||
Average rent PSF | $ | 17.17 | $ | 16.35 | $ | 18.13 | $ | 17.29 | ||||||||
Average cost PSF of executing new leases | $ | 27.76 | $ | 29.17 | $ | 29.18 | $ | 26.11 | ||||||||
Number of comparable leases | 23 | 14 | 22 | 14 | ||||||||||||
Comparable rent spread | 10.5 | % | 8.1 | % | 11.2 | % | 8.1 | % | ||||||||
Weighted-average lease term (in years) | 6.6 | 7.7 | 6.6 | 7.4 | ||||||||||||
Renewals and options: | ||||||||||||||||
Number of leases | 139 | 140 | 125 | 137 | ||||||||||||
Square footage (in thousands) | 806 | 388 | 266 | 296 | ||||||||||||
First-year base rental revenue (in thousands) | $ | 10,865 | $ | 7,393 | $ | 6,083 | $ | 6,413 | ||||||||
Average rent PSF | $ | 13.48 | $ | 19.06 | $ | 22.83 | $ | 21.63 | ||||||||
Average rent PSF prior to renewals | $ | 12.57 | $ | 17.03 | $ | 20.71 | $ | 19.21 | ||||||||
Percentage increase in average rent PSF | 7.2 | % | 12.0 | % | 10.2 | % | 12.6 | % | ||||||||
Average cost PSF of executing renewals and options | $ | 2.44 | $ | 3.88 | $ | 4.37 | $ | 4.58 | ||||||||
Number of comparable leases | 103 | 106 | 100 | 106 | ||||||||||||
Comparable rent spread | 11.2 | % | 13.9 | % | 11.0 | % | 13.9 | % | ||||||||
Weighted-average lease term (in years) | 5.0 | 4.9 | 4.7 | 4.9 | ||||||||||||
Portfolio retention rate | 82.8 | % | 85.5 | % | 77.3 | % | 82.7 | % | ||||||||
(1) | See the footnotes to the summary of leasing activity table for the three months ended September 30, 2018, for more detail regarding certain items throughout this table. |
Non-GAAP Measures
Same-Center Net Operating Income—We present Same-Center Net Operating Income (“Same-Center NOI”) as a supplemental measure of our performance. We define Net Operating Income (“NOI”) as total operating revenues less property operating expenses, real estate taxes, and non-cash revenue items. Same-Center NOI represents the NOI for the 74 properties that were wholly-owned and operational for the entire portion of both comparable reporting periods. We believe NOI and Same-Center NOI provide useful information to our investors about our financial and operating performance because each provides a performance measure of the revenues and expenses directly involved in owning and operating real estate assets and provides a perspective not immediately apparent from net income. Because Same-Center NOI excludes the change in NOI from properties acquired after December 31, 2016, it highlights operating trends such as occupancy levels, rental rates, and operating costs on properties that were operational for both comparable periods. Other REITs may use different methodologies for calculating Same-Center NOI, and accordingly, our Same-Center NOI may not be comparable to other REITs.
Same-Center NOI should not be viewed as an alternative measure of our financial performance since it does not reflect the operations of our entire portfolio, nor does it reflect the impact of general and administrative expenses, acquisition expenses, depreciation and amortization, interest expense, other income, or the level of capital expenditures and leasing costs necessary to maintain the operating performance of our properties that could materially impact our results from operations.
23
The table below is a comparison of the Same-Center NOI for the three and nine months ended September 30, 2018 and 2017 (in thousands):
Three Months Ended September 30, | Nine Months Ended September 30, | ||||||||||||||||||||||||||||
2018 | 2017 | $ Change | % Change | 2018 | 2017 | $ Change | % Change | ||||||||||||||||||||||
Revenues: | |||||||||||||||||||||||||||||
Rental income(1) | $ | 27,271 | $ | 26,794 | $ | 477 | $ | 81,533 | $ | 79,775 | $ | 1,758 | |||||||||||||||||
Tenant recovery income | 10,446 | 9,214 | 1,232 | 30,759 | 29,013 | 1,746 | |||||||||||||||||||||||
Other property income | 111 | 226 | (115 | ) | 515 | 554 | (39 | ) | |||||||||||||||||||||
Total revenues | 37,828 | 36,234 | 1,594 | 4.4 | % | 112,807 | 109,342 | 3,465 | 3.2 | % | |||||||||||||||||||
Operating expenses: | |||||||||||||||||||||||||||||
Property operating expenses | 6,225 | 5,801 | 424 | 18,904 | 17,998 | 906 | |||||||||||||||||||||||
Real estate taxes | 6,197 | 5,015 | 1,182 | 18,407 | 17,266 | 1,141 | |||||||||||||||||||||||
Total operating expenses | 12,422 | 10,816 | 1,606 | 14.8 | % | 37,311 | 35,264 | 2,047 | 5.8 | % | |||||||||||||||||||
Total Same-Center NOI | $ | 25,406 | $ | 25,418 | $ | (12 | ) | — | % | $ | 75,496 | $ | 74,078 | $ | 1,418 | 1.9 | % | ||||||||||||
(1) | Excludes straight-line rental income, net amortization of above- and below-market leases, and lease buyout income. |
Below is a reconciliation of Net Loss to NOI and Same-Center NOI for the three and nine months ended September 30, 2018 and 2017 (in thousands):
Three Months Ended September 30, | Nine Months Ended September 30, | ||||||||||||||
2018 | 2017 | 2018 | 2017 | ||||||||||||
Net loss | $ | (1,743 | ) | $ | (5,857 | ) | $ | (4,615 | ) | $ | (7,196 | ) | |||
Adjusted to exclude: | |||||||||||||||
Straight-line rental income | (619 | ) | (771 | ) | (1,938 | ) | (2,261 | ) | |||||||
Net amortization of above- and below-market leases | (606 | ) | (566 | ) | (1,808 | ) | (1,782 | ) | |||||||
General and administrative expenses | 4,811 | 5,110 | 13,842 | 15,190 | |||||||||||
Termination of affiliate arrangements | — | 5,962 | — | 5,962 | |||||||||||
Transaction expenses | 1,742 | — | 2,237 | — | |||||||||||
Depreciation and amortization | 19,195 | 18,037 | 57,166 | 52,573 | |||||||||||
Interest expense, net | 7,261 | 5,691 | 22,295 | 15,617 | |||||||||||
Other | (896 | ) | (19 | ) | (903 | ) | 7 | ||||||||
NOI | 29,145 | 27,587 | 86,276 | 78,110 | |||||||||||
Less: NOI from centers excluded from Same-Center | (3,739 | ) | (2,169 | ) | (10,780 | ) | (4,032 | ) | |||||||
Total Same-Center NOI | $ | 25,406 | $ | 25,418 | $ | 75,496 | $ | 74,078 | |||||||
Funds from Operations and Modified Funds from Operations—Funds from operations (“FFO”) is a non-GAAP performance financial measure that is widely recognized as a measure of REIT operating performance. We use FFO as defined by the National Association of Real Estate Investment Trusts (“NAREIT”) to be net income (loss) attributable to common stockholders computed in accordance with GAAP, excluding gains (or losses) from sales of property, plus depreciation and amortization, and after adjustments for unconsolidated partnerships and joint ventures. Adjustments for unconsolidated partnerships and joint ventures are calculated to reflect funds from operations on the same basis.
Modified funds from operations (“MFFO”) is an additional performance financial measure used by us as FFO includes certain non-comparable items that affect our performance over time. MFFO excludes the following items:
• | acquisition and transaction expenses; |
• | straight-line rent amounts, both income and expense; |
• | amortization of above- or below-market intangible lease assets and liabilities; |
• | amortization of discounts and premiums on debt investments; |
• | gains or losses from the early extinguishment of debt; |
• | gains or losses on the extinguishment of derivatives, except where the trading of such instruments is a fundamental attribute of our operations; |
• | gains or losses related to fair-value adjustments for derivatives not qualifying for hedge accounting; |
• | gains or losses related to consolidation from, or deconsolidation to, equity accounting; |
• | costs to terminate affiliate arrangements; and |
• | adjustments related to the above items for unconsolidated entities in the application of equity accounting. |
24
We believe that MFFO is helpful in assisting management and investors with the assessment of the sustainability of operating performance in future periods. Neither FFO nor MFFO should be considered as an alternative to net income (loss) or income (loss) from continuing operations under GAAP, nor as an indication of our liquidity, nor is either of these measures indicative of funds available to fund our cash needs, including our ability to fund distributions. MFFO may not be a useful measure of the impact of long-term operating performance on value if we do not continue to operate our business plan in the manner currently contemplated.
Accordingly, FFO and MFFO should be reviewed in connection with other GAAP measurements, and should not be viewed as more prominent measures of performance than net income (loss) or cash flows from operations prepared in accordance with GAAP. Our FFO and MFFO as presented may not be comparable to amounts calculated by other REITs.
The following section presents our calculation of FFO and MFFO and provides additional information related to our operations. As a result of the timing of the commencement of our initial public offering and our active real estate acquisitions, FFO and MFFO are not relevant to a discussion comparing operations for the periods presented. We expect revenues and expenses to increase in future periods as we acquire additional investments.
Three Months Ended September 30, | Nine Months Ended September 30, | ||||||||||||||
2018 | 2017 | 2018 | 2017 | ||||||||||||
Calculation of FFO | |||||||||||||||
Net loss | $ | (1,743 | ) | $ | (5,857 | ) | $ | (4,615 | ) | $ | (7,196 | ) | |||
Adjustments: | |||||||||||||||
Depreciation and amortization of real estate assets | 19,195 | 18,037 | 57,166 | 52,573 | |||||||||||
Adjustments related to unconsolidated joint venture | (453 | ) | 512 | 594 | 1,384 | ||||||||||
Gain on disposition of real estate assets | (7 | ) | — | (7 | ) | — | |||||||||
FFO | $ | 16,992 | $ | 12,692 | $ | 53,138 | $ | 46,761 | |||||||
Calculation of MFFO | |||||||||||||||
FFO | $ | 16,992 | $ | 12,692 | $ | 53,138 | $ | 46,761 | |||||||
Adjustments: | |||||||||||||||
Net amortization of above- and below-market leases | (606 | ) | (569 | ) | (1,808 | ) | (1,782 | ) | |||||||
Straight-line rental income | (619 | ) | (769 | ) | (1,938 | ) | (2,261 | ) | |||||||
Transaction expenses | 1,742 | — | 2,237 | — | |||||||||||
Termination of affiliate arrangements | — | 5,962 | — | 5,962 | |||||||||||
Amortization of market debt adjustment | (253 | ) | (263 | ) | (793 | ) | (797 | ) | |||||||
Gain on extinguishment of debt | (141 | ) | — | (141 | ) | (11 | ) | ||||||||
Change in fair value of derivatives | (16 | ) | (213 | ) | (255 | ) | (448 | ) | |||||||
Adjustments related to unconsolidated joint venture | (41 | ) | (32 | ) | 36 | (9 | ) | ||||||||
Other | 2 | 240 | 5 | 499 | |||||||||||
MFFO | $ | 17,060 | $ | 17,048 | $ | 50,481 | $ | 47,914 | |||||||
FFO and MFFO per share: | |||||||||||||||
Weighted-average common shares outstanding - diluted(1) | 46,815 | 46,548 | 46,758 | 46,533 | |||||||||||
FFO per share - diluted | $ | 0.36 | $ | 0.27 | $ | 1.14 | $ | 1.00 | |||||||
MFFO per share - diluted | $ | 0.36 | $ | 0.37 | $ | 1.08 | $ | 1.03 | |||||||
(1) | Restricted stock awards were dilutive to FFO/MFFO for the three and nine months ended September 30, 2018 and 2017, and accordingly, were included in the weighted-average common shares used to calculate diluted FFO/MFFO per share. |
Liquidity and Capital Resources
General—Aside from standard operating expenses, we expect our principal cash demands to be for:
• | investments in real estate; |
• | capital expenditures and leasing costs; |
• | repurchases of common stock; |
• | cash distributions to stockholders; |
• | principal and interest payments on our outstanding indebtedness; and |
• | transaction expenses incurred in connection with the proposed Merger. |
We expect our primary sources of liquidity to be:
• | proceeds from debt financings, including borrowings under our unsecured credit facility; |
25
• | proceeds from real estate dispositions; |
• | reinvested distributions, which are used for share repurchases; |
• | available, unrestricted cash and cash equivalents; and |
• | operating cash flows. |
We believe our sources of cash will provide adequate liquidity to fund our obligations.
The following table summarizes information about our debt as of September 30, 2018 and December 31, 2017 (dollars in thousands):
September 30, 2018 | December 31, 2017 | ||||||
Total debt obligations, gross | $ | 812,134 | $ | 776,438 | |||
Weighted average interest rate | 3.4 | % | 3.5 | % | |||
Weighted average maturity (in years) | 2.7 | 3.5 | |||||
Revolving credit facility capacity | $ | 350,000 | $ | 350,000 | |||
Revolving credit facility availability | $ | 227,403 | $ | 292,403 | |||
Revolving credit facility maturity(1) | January 2019 | June 2018 | |||||
(1) | We exercised an option to extend the maturity date to January 2019 and have an additional option to extend the maturity date to July 2019. The revolving credit facility is expected to be paid in full at closing of the proposed Merger. |
As of September 30, 2018, we had cash, cash equivalents, and restricted cash of $8.1 million, a net increase of $2.3 million during the nine months ended September 30, 2018.
Below is a summary of our cash flow activity for the nine months ended September 30, 2018 and 2017 (dollars in thousands):
Nine Months Ended September 30, | Favorable (Unfavorable) Change | |||||||||||||
2018 | 2017 | $ | % | |||||||||||
Net cash provided by operating activities | $ | 44,318 | $ | 37,148 | $ | 7,170 | 19.3 | % | ||||||
Net cash used in investing activities | (23,237 | ) | (165,479 | ) | 142,242 | 86.0 | % | |||||||
Net cash (used in) provided by financing activities | (18,807 | ) | 125,609 | (144,416 | ) | (115.0 | )% | |||||||
Operating Activities—Our net cash provided by operating activities was primarily impacted by the following:
• | Property operations—Most of our operating cash comes from rental and tenant recovery income, and is offset by property operating expenses, real estate taxes, and property-specific general and administrative costs. Our change in cash flows from property operations primarily resulted from owning a larger portfolio year-over-year, as well as a 1.9% increase in Same-Center NOI. |
• | Cash paid for transaction costs—During the nine months ended September 30, 2018, we incurred $2.2 million of transaction costs in connection with the proposed Merger. |
• | Cash paid for termination of affiliate arrangements—During the nine months ended September 30, 2017, we incurred $6.0 million of costs related to the termination of our relationship with a former advisor. |
• | Cash paid for interest—During the nine months ended September 30, 2018, we paid $21.8 million in cash for interest, an increase of $7.5 million over the same period in 2017. This was a result of increased borrowings in relation to our 2017 acquisition activity. |
• | Working capital—During the nine months ended September 30, 2018, prepaid expenses increased mainly due to higher prepaid leasing commissions resulting from increased leasing volume in the current year. |
Investing Activities—Our net cash used in investing activities was primarily impacted by the following:
• | Real estate acquisitions—During the nine months ended September 30, 2018, we acquired one shopping center for a total cash outlay of $20.1 million. During the same period in 2017, we acquired nine shopping centers for a total cash outlay of $153.1 million. |
• | Capital expenditures—We invest capital into leasing our properties and maintaining or improving the condition of our properties. During the nine months ended September 30, 2018, cash used for capital expenditures decreased by $0.6 million over the same period in 2017. |
• | Investment and return of investment in Joint Venture—During the nine months ended September 30, 2017, we made a $2.9 million contribution to the Joint Venture to acquire additional assets. We did not make a contribution to the Joint Venture in 2018. Of the $50 million we may contribute to the Joint Venture, as of September 30, 2018, we have contributed $17.5 million. During the nine months ended September 30, 2018, we received $6.3 million of distributions from the Joint Venture due to the sale of a property, a $5.9 million increase over the same period in 2017. |
Financing Activities—Net cash flows from financing activities were primarily impacted by the following:
• | Debt borrowings and payments—Cash from financing activities is primarily affected by inflows from borrowings and outflows from payments on debt. As our debt obligations mature, we intend to refinance the remaining balance, if possible, or pay off the balances at maturity using proceeds from operations and/or corporate-level debt. During the |
26
nine months ended September 30, 2018, our net borrowings decreased by $144.9 million over the same period in 2017. The reduction was primarily due to higher borrowings in 2017 to fund acquisitions.
• | Share repurchases—Our SRP provides an opportunity for stockholders to have shares of common stock repurchased, subject to certain restrictions and limitations (see Note 10). Cash outflows for share repurchases decreased by $3.4 million during the nine months ended September 30, 2018. |
• | Cash distributions paid to stockholders—Cash used for distributions increased by $5.3 million primarily due to the temporary suspension of the DRIP for the month of July 2018 in connection with the proposed Merger; all DRIP participants received their July 2018 distributions in cash rather than stock. The DRIP resumed in August 2018. |
Activity related to distributions to our common stockholders for the nine months ended September 30, 2018 and 2017, was as follows (in thousands):
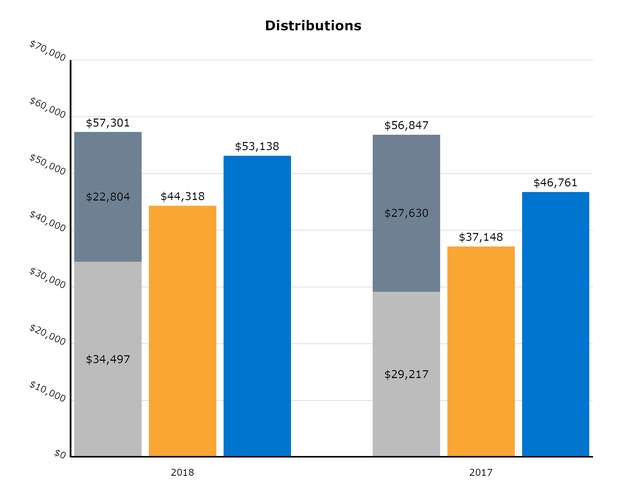
Cash distributions to common stockholders | Net cash provided by operating activities | |||
Distributions reinvested through the DRIP | FFO(1) | |||
(1) | See Item 2. Management’s Discussion and Analysis of Financial Condition and Results of Operations - Non-GAAP Measures - Funds from Operations and Modified Funds from Operations for the definition of FFO, for information regarding why we present FFO, as well as for a reconciliation of this non-GAAP financial measure to Net Loss. |
We paid distributions monthly and expect to continue paying distributions monthly unless our results of operations, our general financial condition, general economic conditions or other factors, as determined by our board of directors, make it imprudent to do so. The timing and amount of distributions is determined by our board of directors and is influenced in part by our intention to comply with REIT requirements of the Internal Revenue Code. As a result of temporarily suspending the DRIP for the month of July 2018, our cash distributions increased significantly for the period compared to the previous months.
To maintain our qualification as a REIT, we must make aggregate annual distributions to our stockholders of at least 90% of our REIT taxable income (which is computed without regard to the dividends paid deduction or net capital gain and which does not necessarily equal net income as calculated in accordance with GAAP). If we meet the REIT qualification requirements, we generally will not be subject to U.S. federal income tax on the income that we distribute to our stockholders each year. However, we may be subject to certain state and local taxes on our income, property, or net worth, respectively, and to federal income and excise taxes on our undistributed income.
27
We have not established a minimum distribution level, and our charter does not require that we make distributions to our stockholders.
Debt—The following table presents our calculation of net debt to total enterprise value as of September 30, 2018 and December 31, 2017 (dollars in thousands):
September 30, 2018 | December 31, 2017 | ||||||
Net debt: | |||||||
Total debt, excluding below-market adjustments and deferred financing costs | $ | 812,134 | $ | 776,438 | |||
Less: Cash and cash equivalents | (3,415 | ) | (1,435 | ) | |||
Total net debt | $ | 808,719 | $ | 775,003 | |||
Enterprise value: | |||||||
Total net debt | $ | 808,719 | $ | 775,003 | |||
Total equity value(1) | 1,064,669 | 1,059,854 | |||||
Total enterprise value | $ | 1,873,388 | $ | 1,834,857 | |||
Net debt to total enterprise value | 43.2 | % | 42.2 | % | |||
(1) Total equity value is calculated as the product of the number of diluted shares outstanding and the estimated value per share at the end of the period. There were 46.7 million and 46.6 million diluted shares outstanding as of September 30, 2018 and December 31, 2017, respectively.
ITEM 3. QUANTITATIVE AND QUALITATIVE DISCLOSURES ABOUT MARKET RISK
There have been no material changes from the quantitative and qualitative disclosures about market risk disclosed in Part II, Item 7A of our 2017 Annual Report on Form 10-K filed with the SEC on March 27, 2018.
ITEM 4. CONTROLS AND PROCEDURES
Evaluation of Disclosure Controls and Procedures
Our management, with the participation of our Principal Executive Officer and Principal Financial Officer, has evaluated the effectiveness of our disclosure controls and procedures (as defined in Rule 13a-15(e) under the Exchange Act) as of September 30, 2018. Based on that evaluation, our Principal Executive Officer and Principal Financial Officer concluded that our disclosure controls and procedures (as defined in Rule 13a-15(e) under the Exchange Act) were effective as of September 30, 2018.
Internal Control Changes
During the quarter ended September 30, 2018, there were no changes in our internal control over financial reporting (as defined in Rule 13a-15(f) under the Exchange Act) that have materially affected, or are reasonably likely to materially affect, our internal control over financial reporting.
28
w PART II. OTHER INFORMATION |
ITEM 1. LEGAL PROCEEDINGS
From time to time, Phillips Edison Grocery Center REIT II, Inc. (“we,” the “Company,” “our,” or “us”) is party to legal proceedings, which arise in the ordinary course of our business. We are not currently involved in any legal proceedings for which we are not covered by liability insurance or the outcome is reasonably likely to have a material impact on our results of operations or financial condition, nor are we aware of any such legal proceedings contemplated by governmental authorities.
ITEM 1A. RISK FACTORS
For a listing of risk factors associated with investing in us, please see Item 1A. Risk Factors in Part I of our 2017 Annual Report on Form 10-K filed with the SEC on March 27, 2018, and in Item 1A. Risk Factors in Part II of our Quarterly Report on Form 10-Q for the quarter ended June 30, 2018 filed with the SEC on August 10, 2018.
ITEM 2. UNREGISTERED SALES OF EQUITY SECURITIES AND USE OF PROCEEDS
During the quarter ended September 30, 2018, we repurchased shares as follows (shares in thousands):
Period | Total Number of Shares Repurchased | Average Price Paid per Share | Total Number of Shares Purchased as Part of a Publicly Announced Plan or Program(1) | Approximate Dollar Value of Shares Available That May Yet Be Repurchased Under the Program | |||||||
July 2018(2) | — | $ | — | — | (3) | ||||||
August 2018 | 259 | 22.80 | 259 | (3) | |||||||
September 2018 | 35 | 22.80 | 35 | (3) | |||||||
(1) | We announced the commencement of the Share Repurchase Program (“SRP”) in November 2013, and it was subsequently amended effective May 2016. All purchases of our equity securities by us in the three months ended September 30, 2018, were made pursuant to the SRP. |
(2) | In connection with the Merger Agreement, the SRP was temporarily suspended for the month of July 2018 and resumed in August 2018. Please see Notes 3 and 10 to the consolidated financial statements for more detail. |
(3) | We currently limit the dollar value and number of shares that may yet be repurchased under the SRP, as described below. |
Our SRP may provide a limited opportunity for stockholders to have shares of common stock repurchased, subject to certain restrictions and limitations that are discussed below:
• | During any calendar year, we may repurchase no more than 5% of the weighted-average number of shares outstanding during the prior calendar year. |
• | We have no obligation to repurchase shares if the repurchase would violate the restrictions on distributions under Maryland law, which prohibits distributions that would cause a corporation to fail to meet statutory tests of solvency. |
• | The cash available for repurchases on any particular date will generally be limited to the proceeds from the distribution reinvestment plan (“DRIP”) during the preceding four fiscal quarters, less any cash already used for repurchases since the beginning of the same period; however, subject to the limitations described above, we may use other sources of cash at the discretion of the board of directors. The limitations described above do not apply to shares repurchased due to a stockholder’s death, “qualifying disability,” or “determination of incompetence.” |
• | Only those stockholders who purchased their shares from us or received their shares from us (directly or indirectly) through one or more non-cash transactions may be able to participate in the SRP. In other words, once our shares are transferred for value by a stockholder, the transferee and all subsequent holders of the shares are not eligible to participate in the SRP. |
• | The board of directors reserves the right, in its sole discretion, at any time and from time to time, to reject any request for repurchase. |
Our board of directors may amend, suspend or terminate the program upon 30 days’ notice. We may provide notice by including such information (a) in a current report on Form 8-K or in our annual or quarterly reports, all publicly filed with the SEC, or (b) in a separate mailing to the stockholders.
During the nine months ended September 30, 2018, repurchase requests surpassed the funding limits under the SRP. When we are unable to fulfill all repurchase requests in a given month, we will honor requests on a pro rata basis to the extent funds are available.
Approximately 0.9 million shares of our common stock were repurchased under the SRP during the nine months ended September 30, 2018. In October 2018, approximately 137,000 shares of our common stock were repurchased under the SRP. Repurchase requests in connection with a stockholder’s death, “qualifying disability,” or “determination of incompetence” were completed in full. The remaining repurchase requests that were in good order were fulfilled on a pro rata basis.
In connection with the proposed Merger, the combined company will be required to reset its share repurchase queue. As a result, all SRP requests currently on file will be canceled on the date the Merger closes. All stockholders wishing to participate in the SRP after the Merger must submit a new SRP form to the transfer agent, DST, after the Merger to be included in the next standard repurchase of the combined company. All standard repurchase requests must be on file and in good order to be
29
included for next standard repurchase of the combined company, which is expected to be in July 2019. At that time, should the demand for standard redemptions exceed the funding available for repurchases, the combined company is expected to make pro-rata redemptions. Following that standard repurchase, standard repurchase requests that are on file with the combined company and in good order that have not been fully executed (due to pro rata redemptions), will remain on file for future redemptions.
ITEM 5. OTHER INFORMATION
Director Resignation
In our joint proxy statement filed with the SEC on August 28, 2018, we disclosed that Mark D. McDade was expected to resign from our board of directors (the “Board”) prior to the effective time of the proposed Merger and that we would redeem all of his vested and unvested shares of restricted stock. On November 2, 2018, Mr. McDade resigned from the Board in connection with the Merger and not as a result of any dispute or disagreement with the Company or any of our subsidiaries. In connection with his resignation, we redeemed all of his shares of common stock, including his vested and unvested restricted stock, for cash in an amount equal to the number of shares of PECO common stock he would have received in the Merger multiplied by $11.05 (the most recent estimated value per share of PECO common stock).
Termination of Distribution Reinvestment Plan and Share Repurchase Program
In connection with the proposed Merger, on November 2, 2018, the Board voted to terminate the DRIP and the SRP, in each case effective as of the expiration of the required notice period thereunder, but no sooner than the effective time of the Merger.
ITEM 6. EXHIBITS
Ex. | Description |
101.1 | The following information from the Company’s quarterly report on Form 10-Q for the quarter ended September 30, 2018, formatted in XBRL (eXtensible Business Reporting Language): (i) Consolidated Balance Sheets; (ii) Consolidated Statements of Operations and Comprehensive (Loss) Income; (iii) Consolidated Statements of Equity; and (iv) Consolidated Statements of Cash Flows* |
*Filed herewith.
30
SIGNATURES
Pursuant to the requirements of the Securities Exchange Act of 1934, the registrant has duly caused this report to be signed on its behalf by the undersigned thereunto duly authorized.
PHILLIPS EDISON GROCERY CENTER REIT II, INC. | ||
Date: November 5, 2018 | By: | /s/ Jeffrey S. Edison |
Jeffrey S. Edison | ||
Chairman of the Board and Chief Executive Officer | ||
(Principal Executive Officer) | ||
Date: November 5, 2018 | By: | /s/ Devin I. Murphy |
Devin I. Murphy | ||
Chief Financial Officer | ||
(Principal Financial Officer) | ||
31