Attached files
| file | filename |
|---|---|
| 8-K - FORM 8-K - MidWestOne Financial Group, Inc. | q32018investorpresentation.htm |

Investor Presentation Q3 2018

Table of Contents Corporate Summary: About MidWestOne page 4 Shareholder Value Strategy page 5 Market Opportunity page 12 MidWestOne Financial Group, Inc. to Acquire ATBancorp page 16 Past and Present Performance page 23 2

Forward-looking Statements This presentation contains forward-looking statements relating to the financial condition, results of operations, and business of MidWestOne Financial Group, Inc. Forward-looking statements generally include words such as believes, expects, anticipates, and other similar expressions. Actual results could differ materially from those indicated. Among the important factors that could cause actual results to differ materially are interest rates, changes in the mix of the company’s business, competitive pressures, general economic conditions and the risk factors detailed in the company’s periodic reports and registration statements filed with the Securities and Exchange Commission. MidWestOne Financial Group, Inc. undertakes no obligation to publicly revise or update these forward-looking statements to reflect events or circumstances after the date of this presentation. 3

About MidWestOne Market Cap • $407.1 million Assets • $3.3B in assets • $2.4B in loans • $2.6B in deposits • $943M in AUM Locations • 23 branches in 13 counties throughout central and east central Iowa • 18 offices in Twin Cities metro area and western Wisconsin • 2 offices in Naples and Ft. Myers, Florida • 1 office in Denver FTEs • 602 Loan Portfolio • 53% commercial real estate • 19% residential real estate, $288M servicing portfolio • 22% C&I • 6% other YTD 2018 2017 2016 2015 ROAA 0.94%* 0.60% 0.68% 0.91% ROATE 12.00% 8.00% 10.13% 14.29% Efficiency Ratio 63.30% 58.64% 66.43% 61.36% *includes $605 thousand of merger related expenses, $585 thousand write-down of a former branch facility, and $274 thousand in early retirement compensation costs 4

Shareholder Value Strategy 5

Shareholder Value Strategy 1. Desired return to shareholders: 1.15% – 1.20% ROA and 13.50% – 15% ROTE 2. Increase commercial and retail market share 3. Focus growth in wealth management 4. Embrace culture to drive brand equity 5. Continued commitment to community 6. Expanded investment in FinTech 6

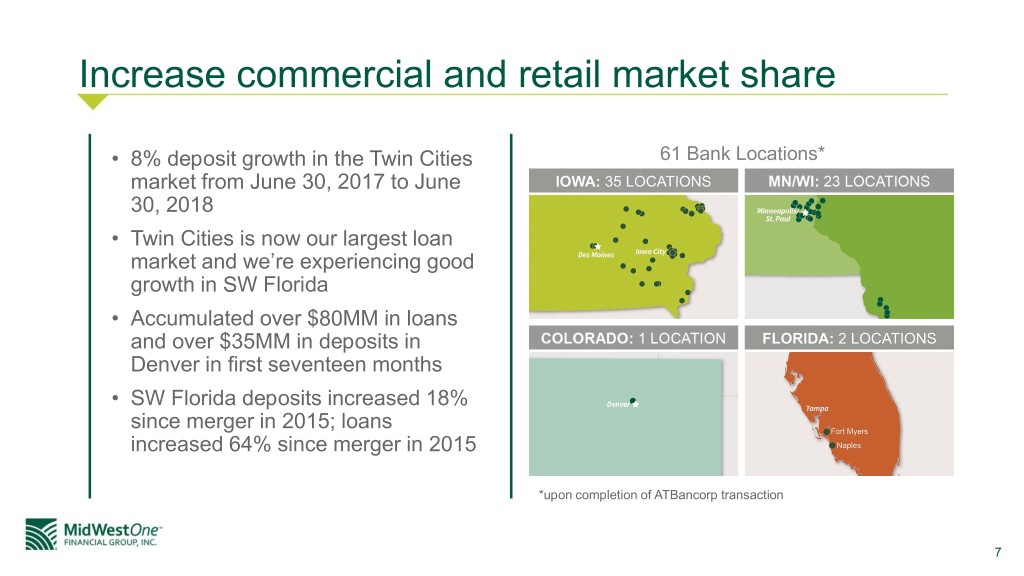
Increase commercial and retail market share • 8% deposit growth in the Twin Cities 61 Bank Locations* market from June 30, 2017 to June 30, 2018 • Twin Cities is now our largest loan market and we’re experiencing good growth in SW Florida • Accumulated over $80MM in loans and over $35MM in deposits in Denver in first seventeen months • SW Florida deposits increased 18% since merger in 2015; loans increased 64% since merger in 2015 *upon completion of ATBancorp transaction 7

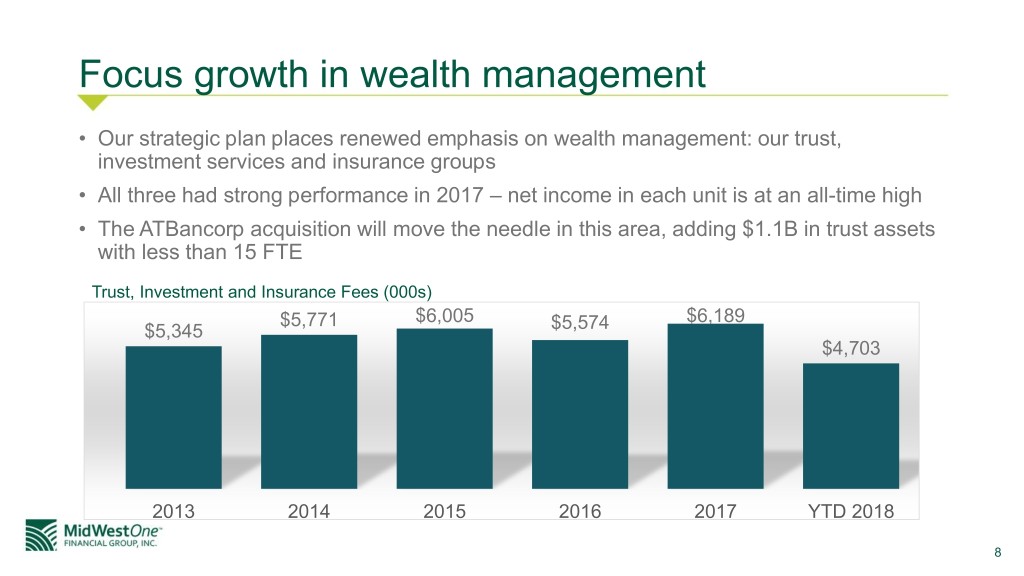
Focus growth in wealth management • Our strategic plan places renewed emphasis on wealth management: our trust, investment services and insurance groups • All three had strong performance in 2017 – net income in each unit is at an all-time high • The ATBancorp acquisition will move the needle in this area, adding $1.1B in trust assets with less than 15 FTE Trust, Investment and Insurance Fees (000s) $5,771 $6,005 $6,189 $5,345 $5,574 $4,703 2013 2014 2015 2016 2017 YTD 2018 8

Embrace culture to drive brand equity Our brand is built on the foundation of our culture, which drives the behaviors and actions of our employees in support of our mission statement: To take good care of our customers and those who should be We do this one relationship at a time – it’s about caring. Source: verbatim comments from 2018 Customer Satisfaction Survey 9

Continued commitment to community We passionately pursue success for our neighbors and we support organizations that create opportunities in our communities. 10

Expanded investment in FinTech Customers expect complete digital accessibility to manage their financial life. We intend to meet these demands with expanded investment in financial technology to improve customer experience. Zelle – banking’s answer to Venmo Mobile loan and deposit application functionality Reimagined, customer-centric, mobile friendly website 11

Market Opportunity 12

Why MidWestOne • Organic growth should come from thriving markets served • Iowa City • Twin Cities region • Southwest Florida • Denver • The ATBancorp transaction is an example of the continued opportunity for acquisitive growth through consolidation of bank charters in adjoining markets • Diversified loan portfolio away from full reliance on Iowa economy and with geographic diversity • Focus on non-interest income growth • Commitment to shareholders through consistent dividend increases and stock buyback program 13

Compelling Metropolitan Markets Minneapolis – Naples & Iowa City Denver Dubuque* Des Moines* St. Paul Fort Myers Gross Metro Product $10.4B $260.1B $46.1B (combined) $208.8B $6.1B $57.1B Median Household Income by $56,819 $73,231 $61,228 (Naples) $71,926 $56,154 $65,704 MSA $52,909 (Fort Myers) Household Income Growth by 1.75% 3.13% -1.45% (Naples) 2.34% 2.84% 5.93% MSA 4.46% (Fort Myers) Major Industries • Bio-Science • Financial Svs • Tourism • Aerospace • Manufacturing • Finance & • Healthcare • Technology • Healthcare • Telecom • Healthcare Insurance • Healthcare Major Employers • University of Iowa • US Bancorp • Lee Health • Comcast • John Deere • Wells Fargo • Lear • Wells Fargo • Publix Super • Lockheed Martin • Mercy Medical • UnityPoint Health • P&G • 3M Market • United Airlines Center • Principal Financial • ACT • Target • NCH Healthcare • Medical • Hy-Vee Corporation • Walmart Associates Clinic • UnityPoint Health Forbes Lists • #4 Best Small • #18 Best Places • #88 Best Places • #4 Best Places for • #45 Best Small • #7 Best Places for Places for for Business and for Business and Business and Places for Business and Business and Careers Careers (Naples) Careers Business and Careers Careers • #21 Education • #7 in Job Growth • #25 in Job Growth Careers • #70 in Job Growth • #61 Job Growth (Naples) • #18 Education • #39 Education • #49 Education • #5 Education • #47 in Education (Naples) *upon completion of ATBancorp transaction 14

Market Position • Twin Cities and Iowa City MSAs comprise 60% of deposits • Footprint population change over last seven years of +5.9% and 2017E median household income of $62k are above national average • Twin Cities economy has performed above national averages during past five years • Denver lift-out expansion is providing strong growth opportunities with office at break-even in just six months; and an expanding sales force to assure continued growth 15

“MidWestOne Financial Group, Inc. to Acquire ATBancorp” – announced on August 22, 2018 16

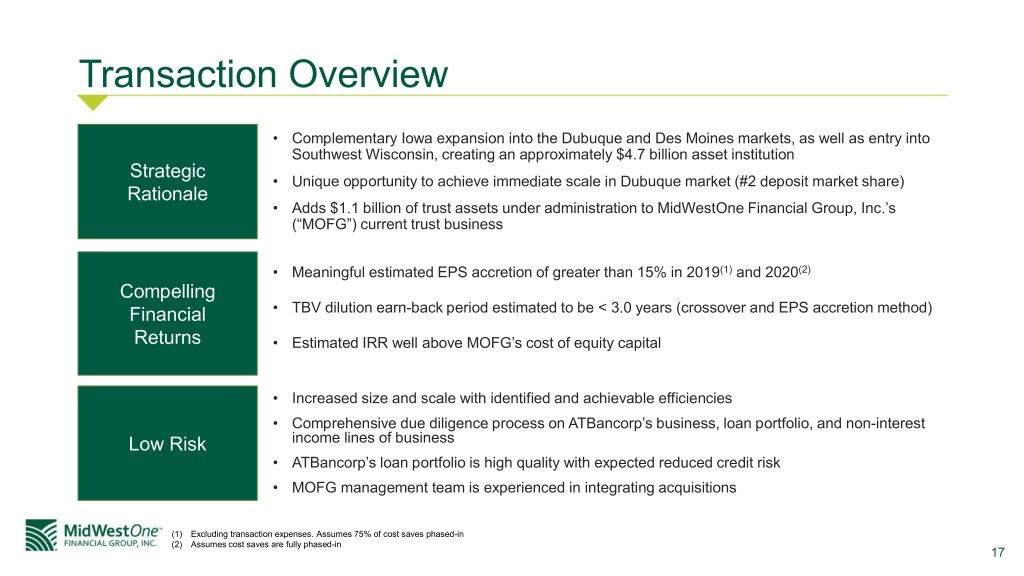
Transaction Overview • Complementary Iowa expansion into the Dubuque and Des Moines markets, as well as entry into Southwest Wisconsin, creating an approximately $4.7 billion asset institution Strategic • Unique opportunity to achieve immediate scale in Dubuque market (#2 deposit market share) Rationale • Adds $1.1 billion of trust assets under administration to MidWestOne Financial Group, Inc.’s (“MOFG”) current trust business • Meaningful estimated EPS accretion of greater than 15% in 2019(1) and 2020(2) Compelling Financial • TBV dilution earn-back period estimated to be < 3.0 years (crossover and EPS accretion method) Returns • Estimated IRR well above MOFG’s cost of equity capital • Increased size and scale with identified and achievable efficiencies • Comprehensive due diligence process on ATBancorp’s business, loan portfolio, and non-interest Low Risk income lines of business • ATBancorp’s loan portfolio is high quality with expected reduced credit risk • MOFG management team is experienced in integrating acquisitions (1) Excluding transaction expenses. Assumes 75% of cost saves phased-in (2) Assumes cost saves are fully phased-in 17

Overview of ATBancorp ATBancorp Headquarters: Dubuque, IA Number of Branches: 17 Total Assets ($mm): $1,369 Gross Loans ($mm): $1,123 Total Deposits ($mm) $1,071 Company Overview • ATBancorp was formed in 1985 to serve as a holding company for American Trust & Savings Bank of Dubuque Iowa (established in 1911) • ATBancorp is now a two-bank holding company, also serving as the holding company for its Wisconsin subsidiary, American Bank & Trust MOFG (45) nd ATBancorp (17) • Strong local reputation showcased by 2 ranked deposit market share(1) in Dubuque, IA MSA (1) Deposit market share data as of 6/30/17 18

Pro Forma Loan / Deposit Composition (6/30/18 YTD) MOFG ATBancorp Pro Forma Other, C&D, 8.9% Cons., 7.9% Farm, 2.0% 5.2% C&I, 1 - 4 YTD Yield on Gross YTD Yield on Gross YTD Yield on 16.5% Gross Fam, Loans Loans Loans 17.4% Loans: 4.74% $2.4bn Loans: 4.16% $1.1bn Loans: 4.56% $3.5bn Ag, 4.8% 5+ Fam, NPLs / Loans (%) 5.5% ATBancorp: 0.76% CRE, (1) MW Peer Median : 0.88% 31.7% MOFG ATBancorp Pro Forma YTD Cost of Total YTD Cost of Total YTD Cost of Total Total Deposits: Deposits Total Deposits: Deposits Total Deposits: Deposits $1.1bn $3.7bn 0.58% $2.6bn 0.69% 0.61% (1) Midwestern peers represents banks headquartered in the Midwest with assets $800mm - $2.0bn Note: Regulatory data used for loan / deposit composition Note: MOFG Yield on Loans and Cost of Deposits is calculated using GAAP data 19 Source: SNL Financial

Review of Key Terms & Assumptions in ATBancorp Transaction Consideration • 117.5500x exchange ratio and $34.8 million of cash consideration Structure • Fixed exchange ratio (i.e., number of MOFG shares issued is fixed) and fixed cash consideration Transaction Value • $170.3 million in aggregate (based on MOFG’s 8/20/18 closing stock price) to be paid by MOFG to ATBancorp shareholders Consideration Mix • 79.6% stock consideration / 20.4% cash consideration (based on MOFG’s 8/20/18 closing stock price) Special Dividend • $31.8 million special dividend to be paid by ATBancorp to its shareholders prior to transaction close Pro Forma Ownership • 74.8% MOFG / 25.2% ATBancorp Estimated Cost Savings • $14.7 million of pre-tax annualized fully-phased-in cost saves (30% of total non-interest expense) • 2019 = 75% phase-in, 2020+ = 100% phase-in • ($19.3) million gross loan mark • ($13.8) million gross credit mark (performing portion of credit mark accreted sum-of-years digits over 5 years) Estimated • ($5.5) million interest rate mark (accreted sum-of-years digits over 5 years) Purchase Accounting & Fair • +$9.6 million PPE write-up Value Marks • ($4.5) million trust preferred securities liability write-down • ($0.8) million OREO mark • Core deposit intangible assumed at 1.5% of non-time deposits Transaction Costs • Estimated pre-tax one-time transaction expenses of approximately $20 million • Completion of the merger is subject to certain closing conditions, including the disposition by ATBancorp of certain identified assets Closing Conditions and liabilities, including assets and liabilities associated with ATBancorp’s retirement division Timing • Expected 1Q19 closing 20

Review of Pro Forma Financial Impact & Transaction Multiples Estimated Pro Forma Impact Transaction Multiples Estimated EPS Accretion Transaction Multiples at Announcement (3) 2019(1) / 2020(2) EPS Accretion (%) ~ 15%+ Deal Value / Adjusted Book Value (%) 149% Deal Value / Adjusted Tangible Book Value (%) 155% Pro Forma Balance Sheet at announcement Deal Value / Adj. 2Q18 YTD Annualized Earnings (x) 18.8x Total Assets ($bn) ~ $4.7bn Adjusted Core Deposit Premium (%) 6.4% Gross Loans ($bn) ~ $3.5bn Total Deposits ($bn) ~ $3.7bn Estimated Capital Ratios (pro forma at close) Tangible Common Equity / Tangible Assets (%) 7.7% Tier 1 Leverage Ratio (%) 8.4% Tier 1 Risk-Based Capital Ratio (%) 9.9% Total Risk-Based Capital Ratio (%) 11.7% Estimated Tangible Book Value Earnback Earnback Period (crossover & EPS accretion method) < 3.0 years (1) Excluding transaction expenses. Assumes 75% of cost saves phased-in (2) Assumes cost saves are fully phased-in (3) See appendix for non-GAAP reconciliations 21

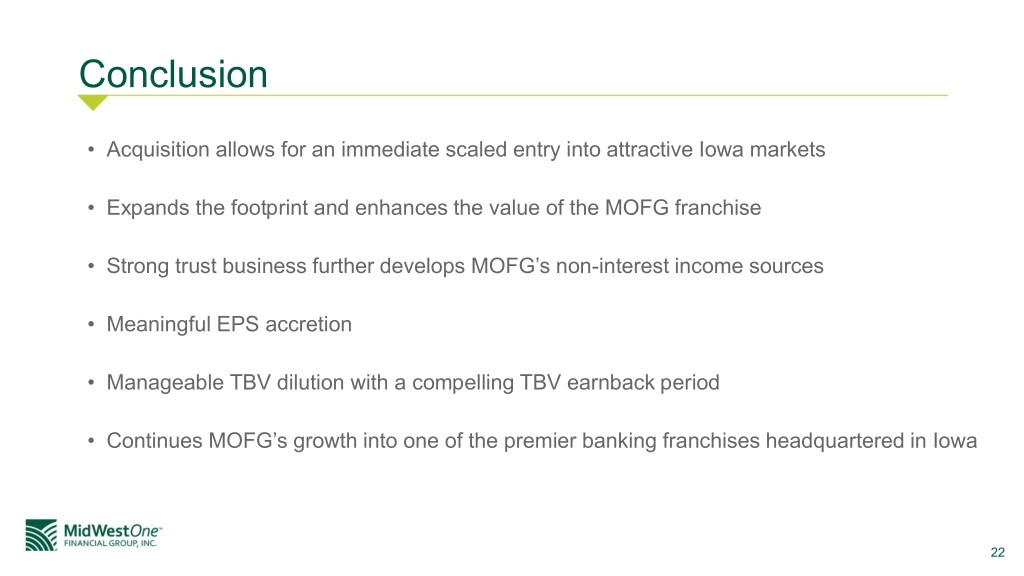
Conclusion • Acquisition allows for an immediate scaled entry into attractive Iowa markets • Expands the footprint and enhances the value of the MOFG franchise • Strong trust business further develops MOFG’s non-interest income sources • Meaningful EPS accretion • Manageable TBV dilution with a compelling TBV earnback period • Continues MOFG’s growth into one of the premier banking franchises headquartered in Iowa 22

Past and Present Performance 23

Diversified Loan Portfolio – By Type Q3 2018 State/Muni IDR, 5% Agricultural 4% CML Construction RRE Ownr Occup 9% 6% RRE Non-Ownr Occup 6% Commercial 17% Land Develop 3% Consumer 2% Improved CRE - OOC 15% CRE Multifamily 5% Farmland 4% Home Equity 5% Improved CRE - NOO 19% 24

Diversified Loan Portfolio by Market ($ millions) SBA LPO 47 COLORADO 82 WESTERN WISCONSIN 99 FLORIDA 147 CEDAR VALLEY 151 MORTGAGE 189 IOWA CITY 383 RURAL IOWA 447 TWIN CITIES 835 $0 $100 $200 $300 $400 $500 $600 $700 $800 $900 25

Asset Quality 2018 Goal: continue to build on improvement in asset quality Nonperforming Assets/Assets NCOs/Average Loans 1.20% 0.60% 1.00% 0.50% 0.99% 0.51% 0.89% 0.89% 0.80% 0.83% 0.40% 0.78% 0.81% 0.60% 0.68% 0.30% 0.26% 0.40% 0.20% 0.21% 0.20% 0.10% 0.11% 0.11% 0.09% 0.05% 0.00% 0.00% 26

Returning to Stable Asset Quality and Improved Reserve Coverage NPLs/Loans(%) Loan Loss Reserve Coverage (1) 1.40% 1.31% LLR/Loans 1.27% 1.20% 1.80% 200.00% 1.20% 1.15% 179.4% 1.60% 168.50% 180.00% 1.04% 1.03% 152% 1.00% 1.40% 160.00% 140.00% 1.20% 147.8% 0.80% 117.60% 120.00% 1.00% 100.00% 0.60% 0.54% 109.92% 0.80% 1.54% 1.49% 1.44% 80.00% 76.80% 1.32% 0.40% 0.60% 1.23% 1.01% 60.00% 0.90% 0.40% 40.00% 0.20% 0.20% 20.00% 0.00% 0.00% 0.00% (1) Assumes purchase discount of $8.6 million in 2015 and 2016 per Company files 10K 27

Legacy MOFG Focus on Fee Income Diversification Non-Interest Income $25.0 $23.4 $22.4 • Wealth Management $21.2 $2.9 $1.7 • Trust Services – Expand non-Iowa to $20.0 $2.8 locations without those services $6.0 $6.0 $17.1 $15.3 • Trust Services has consistently $14.7 $5.2 $1.7 $15.0 $1.0 $2.4 increased contributions to earnings over $2.2 $3.8 $3.4 $4.5 $2.3 $2.8 past 8 years $10.0 $3.2 $1.6 $2.7 • Investment Services – Strong presence $4.4 $5.2 $5.1 $3.3 in 4 markets with a desire to expand $3.0 $3.5 $5.0 • Insurance Services – Currently offering $6.2 $5.3 $5.8 $6.0 $5.6 $4.7 service in selected communities $0.0 • Home Mortgage – Economies of scale 2013 2014 2015 2016 2017 9/30/2018 through utilizing central hub for Real YTD Estate lending Other • Strategic goal to continue to increase Other service charges and fees non-interest income as % of revenues Loan origination and servicing fees Service charges and fees on deposit accounts Trust, investment and insurance fees 28

Commitment to Shareholders $3.00 EPS and Dividends $2.42 $2.19 $2.20 $1.95 $2.00 $1.86 $1.78 $1.55 $1.00 $0.67 $0.58 $0.60 $0.64 $0.59 $0.50 $0.36 $0.00 2012 2013 2014 2015 2016 2017 YTD 2018 Common Dividends Per Share Basic EPS 29

Core Deposit Franchise Deposit Composition Total Deposits ($mm) 100% 12.3% 17.3% 16.0% 17.2% 13.2% 14.5% 14.4% $3,000 1.00% 80% 14.1% 13.1% 12.5% 13.2% 17.9% 16.4% 0.90% 20.9% $2,500 $2,605 $2,632 0.80% $2,464 $2,480 60% 0.66% 0.63% 40.4% $2,000 47.8% 0.51% 0.60% 36.8% 42.8% 43.0% 55.3% 55.0% 40% $1,500 $1,400 $1,375 $1,409 0.40% 0.46% $1,000 0.38% 20% 0.34% 33.2% 0.20% 25.0% 23.4% 23.4% 25.9% $500 17.7% 17.4% 0% $0 0.00% 2012 2013 2014 2015 2016 2017 9/30/2018 Jumbo Time Retail Time Total Deposits Interest-bearing Demand, MMDAs + Savings Cost of Average Total Deposits Non-Interest Bearing Demand Deposits 30

Shareholder Return NASDAQ Composite Index SNL Midwest Banks Index MidWestOne Financial Group, Inc. 350 300 250 200 150 100 50 12/31/2012 12/31/2013 12/31/2014 12/31/2015 12/31/2016 12/31/2017 9/30/2018 31

A Plan to Return to Better Profitability in 2018 Revenue and Net Interest Margin ROAA (%) 1.20% 0.94% $140.0 3.90% 0.90% 3.83% 3.80% 0.60% $120.0 3.80% 0.30% 3.71% $23.4 $22.4 0.00% $100.0 3.64% 3.70% $21.2 $17.1 $80.0 3.60% 3.53% $60.0 $14.7 $15.3 3.50% ROATE (%) 16.0% 3.46% 12.00 % $40.0 3.40% 12.0% 8.0% $20.0 3.30% 4.0% 0.0% $54.0 $54.9 $90.1 $99.6 $104.2 $79.3 $0.0 3.20% 2013 2014 2015 2016 2017 9/30/18 YTD Net Interest Income Non-Interest Income 32

Strong Capital Structure MidWestOne Bank 9/30/18 Regulatory Guidelines* Risk Based Capital/Risk Weighted Assets 11.97% 10.00% Tier 1 Capital/Risk Weighted Assets 10.84% 8.00% Leverage Ratio 9.45% 5.00% MidWestOne Financial Group 9/30/18 Internal Guidelines Tangible Common Equity/Tangible Assets† 8.61% 8.48% - 9.00% Total Shareholders’ Equity 10.69% *Regulatory guidelines for a well capitalized bank. †Both net of associated deferred tax liability on intangibles 33

Continued Market Opportunity BANKS W I TH >$ 2 B I N AS S E TS 7 • Given size and public currency, uniquely 8 positioned to participate in consolidation 6 5 5 within our markets 4 2 • We expect to be involved in the continued 0 consolidation in our footprint Iowa Minnesota National Average BANKS W I TH <$ 1 B I N AS S E TS 283 Iowa MN WI 300 267 Rank in population 30th 21st 20th 200 92 100 Rank in number of 4th 3rd 7th bank charters 0 Iowa Minnesota National Average NUMBE R O F BANK CHARTE RS 400 303 313 300 228 187 200 88 100 17 0 IA MN WI GA NJ AZ 34

NASDAQ: MOFG
