Attached files
| file | filename |
|---|---|
| EX-99.1 - EX-99.1 - Matson, Inc. | ex-99d1.htm |
| 8-K - 8-K - Matson, Inc. | f8-k.htm |
Exhibit 99.2
| 1 Third Quarter 2018 Earnings Conference Call Third Quarter 2018 Earnings Conference Call November 5, 2018 |
| 2 Third Quarter 2018 Earnings Conference Call Forward-Looking Statements Statements made during this call and presentation that set forth expectations, predictions, projections or are about future events are based on facts and situations that are known to us as of today, November 5, 2018. We believe that our expectations and assumptions are reasonable. Actual results may differ materially, due to risks and uncertainties, such as those described on pages 13-21 of our 2017 Form 10-K filed on February 23, 2018, and other subsequent filings by Matson with the SEC. Statements made during this call and presentation are not guarantees of future performance. We do not undertake any obligation to update our forward-looking statements. |
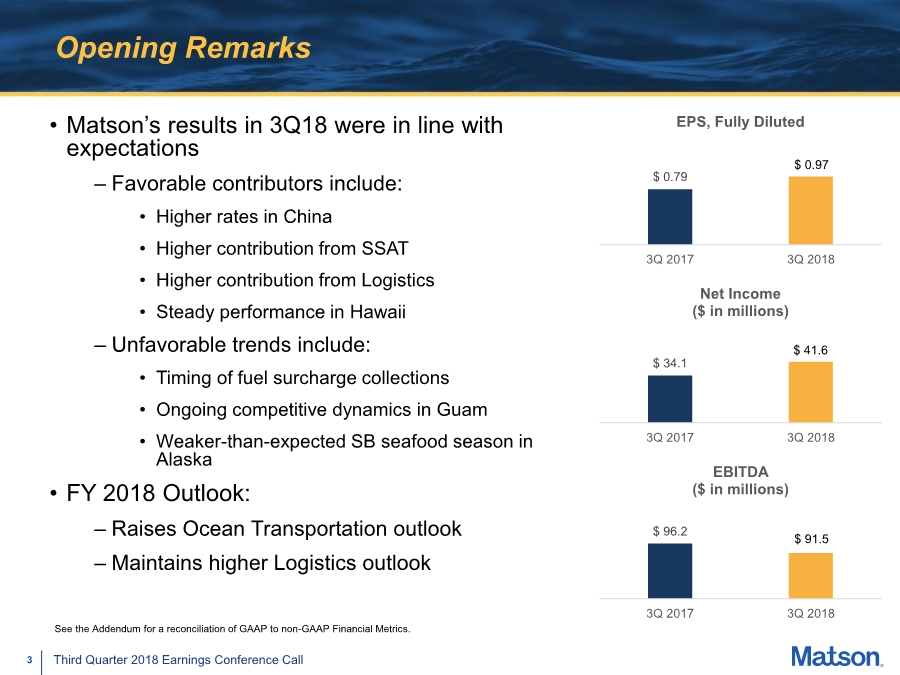
| 3 Third Quarter 2018 Earnings Conference Call Opening Remarks $ 0.79 3Q 2017 3Q 2018 EPS, Fully Diluted $ 0.97 $ 34.1 3Q 2017 3Q 2018 Net Income ($ in millions) $ 41.6 • Matson’s results in 3Q18 were in line with expectations – Favorable contributors include: • Higher rates in China • Higher contribution from SSAT • Higher contribution from Logistics • Steady performance in Hawaii – Unfavorable trends include: • Timing of fuel surcharge collections • Ongoing competitive dynamics in Guam • Weaker-than-expected SB seafood season in Alaska • FY 2018 Outlook: – Raises Ocean Transportation outlook – Maintains higher Logistics outlook See the Addendum for a reconciliation of GAAP to non-GAAP Financial Metrics. $ 96.2 3Q 2017 3Q 2018 EBITDA ($ in millions) $ 91.5 |
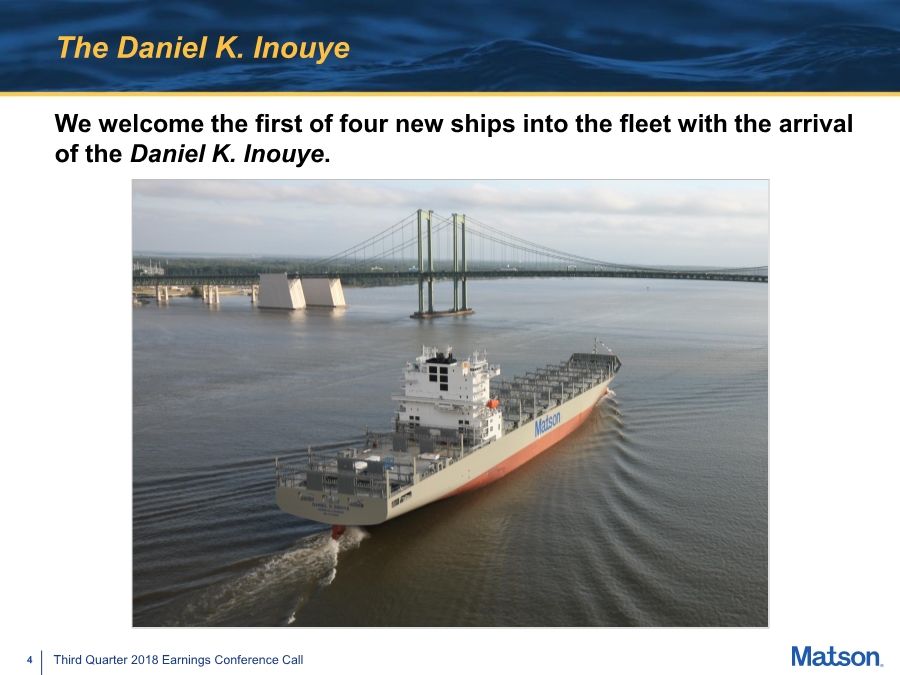
| 4 Third Quarter 2018 Earnings Conference Call The Daniel K. Inouye We welcome the first of four new ships into the fleet with the arrival of the Daniel K. Inouye. |
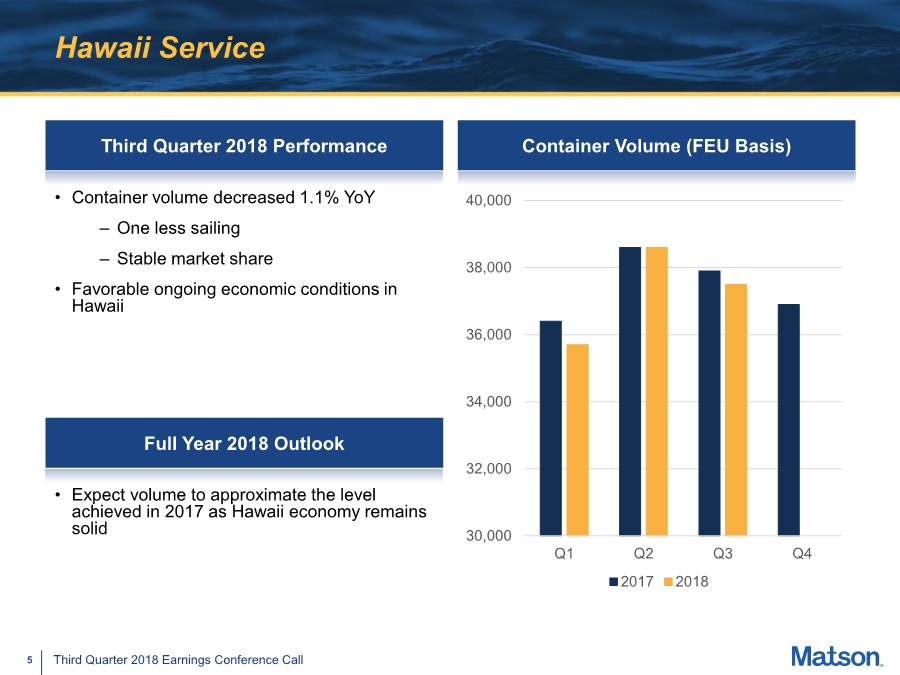
| 5 Third Quarter 2018 Earnings Conference Call Hawaii Service Third Quarter 2018 Performance • Container volume decreased 1.1% YoY – One less sailing – Stable market share • Favorable ongoing economic conditions in Hawaii Container Volume (FEU Basis) Full Year 2018 Outlook • Expect volume to approximate the level achieved in 2017 as Hawaii economy remains solid 30,000 32,000 34,000 36,000 38,000 40,000 Q1 Q2 Q3 Q4 2017 2018 |
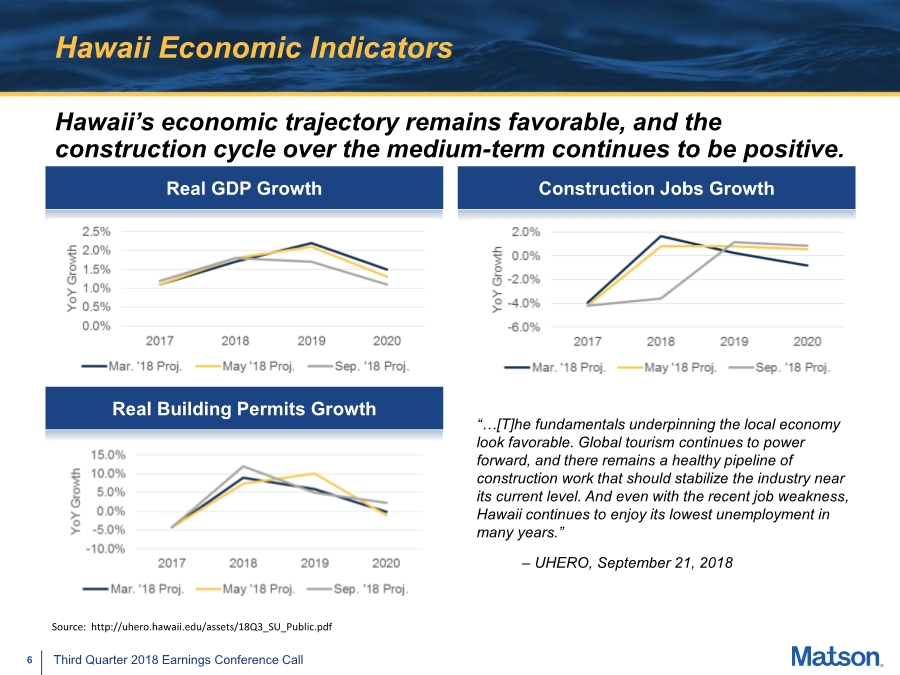
| 6 Third Quarter 2018 Earnings Conference Call Hawaii Economic Indicators Real GDP Growth Construction Jobs Growth Real Building Permits Growth “…[T]he fundamentals underpinning the local economy look favorable. Global tourism continues to power forward, and there remains a healthy pipeline of construction work that should stabilize the industry near its current level. And even with the recent job weakness, Hawaii continues to enjoy its lowest unemployment in many years.” – UHERO, September 21, 2018 Hawaii’s economic trajectory remains favorable, and the construction cycle over the medium-term continues to be positive. Source: http://uhero.hawaii.edu/assets/18Q3_SU_Public.pdf |
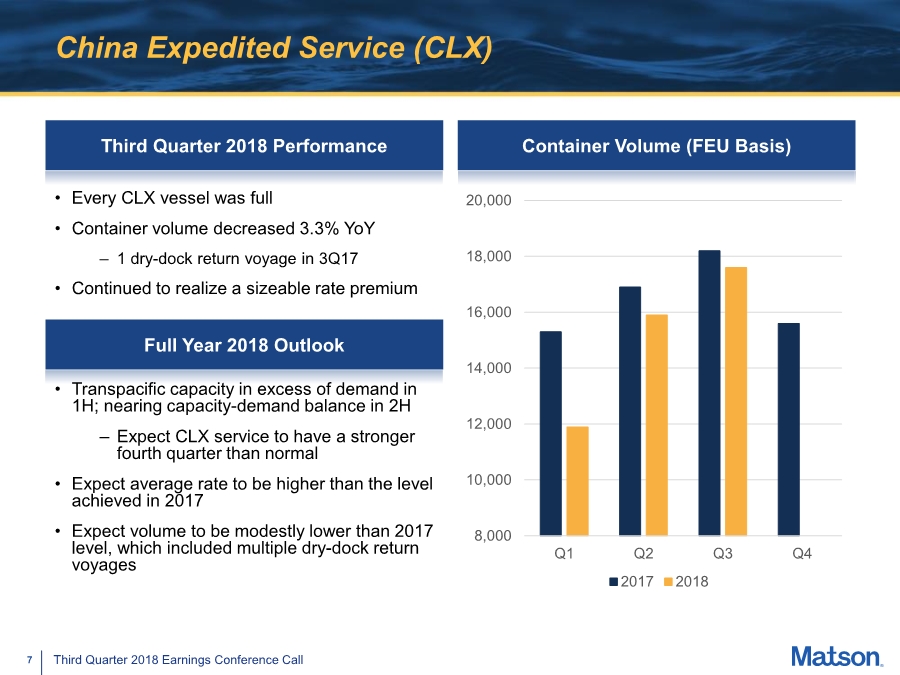
| 7 Third Quarter 2018 Earnings Conference Call China Expedited Service (CLX) Third Quarter 2018 Performance • Every CLX vessel was full • Container volume decreased 3.3% YoY – 1 dry-dock return voyage in 3Q17 • Continued to realize a sizeable rate premium Container Volume (FEU Basis) Full Year 2018 Outlook • Transpacific capacity in excess of demand in 1H; nearing capacity-demand balance in 2H – Expect CLX service to have a stronger fourth quarter than normal • Expect average rate to be higher than the level achieved in 2017 • Expect volume to be modestly lower than 2017 level, which included multiple dry-dock return voyages 8,000 10,000 12,000 14,000 16,000 18,000 20,000 Q1 Q2 Q3 Q4 2017 2018 |
| 8 Third Quarter 2018 Earnings Conference Call China – U.S. Tariffs • In July/August, U.S. implemented 25% tariff on $50 billion worth of products • In September, U.S. implemented initial 10% tariff on additional $200 billion worth of products; tariff moves to 25% on January 1 – Finished garments and footwear not part of proposed tariffs • What our customers are saying: – Believe the 25% tariff on January 1 will proceed – Have advanced some cargo ahead of tariff step-up – Exploring manufacturing location alternatives for the long-term • Will take time to adjust supply chains • Majority of cargo likely to be sourced from other Asia origins • Transpacific vessel supply-demand is single biggest factor to weigh – Potential risk related to pull-forward of volume • Significant uncertainty remains |
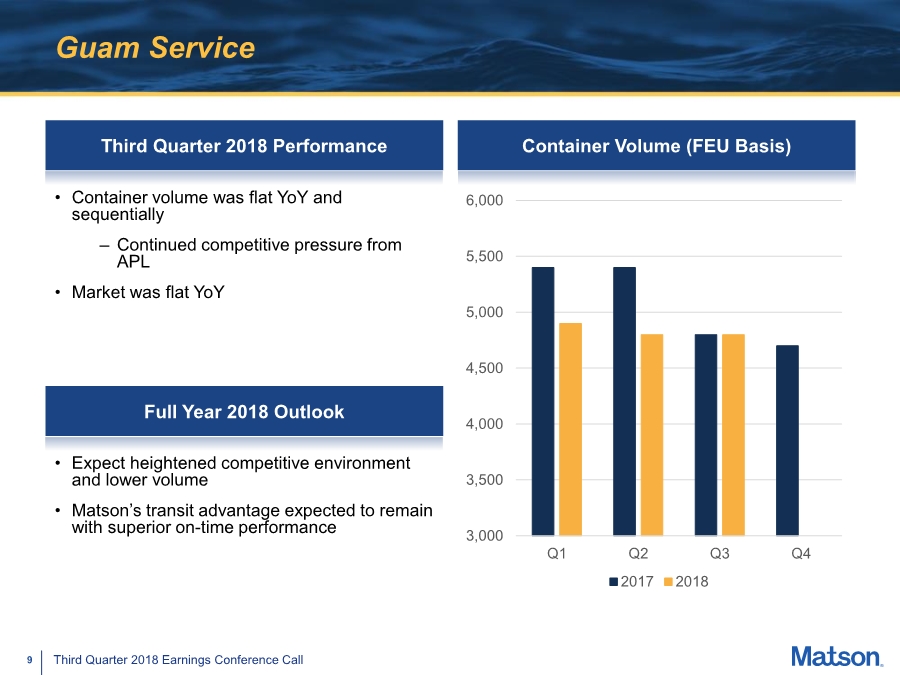
| 9 Third Quarter 2018 Earnings Conference Call Guam Service Third Quarter 2018 Performance • Container volume was flat YoY and sequentially – Continued competitive pressure from APL • Market was flat YoY Container Volume (FEU Basis) Full Year 2018 Outlook • Expect heightened competitive environment and lower volume • Matson’s transit advantage expected to remain with superior on-time performance 3,000 3,500 4,000 4,500 5,000 5,500 6,000 Q1 Q2 Q3 Q4 2017 2018 |
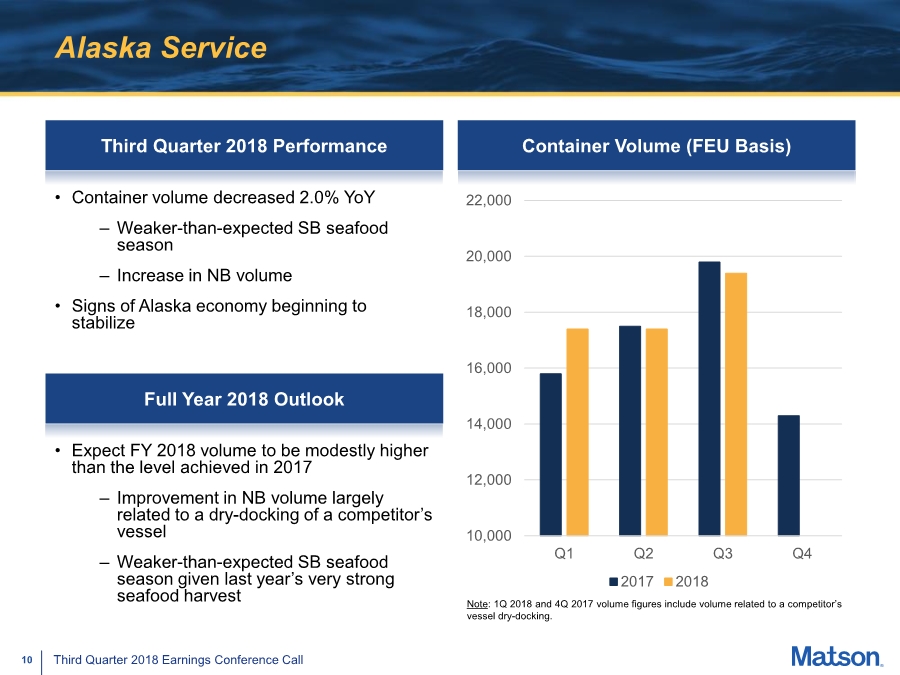
| 10 Third Quarter 2018 Earnings Conference Call Alaska Service Third Quarter 2018 Performance • Container volume decreased 2.0% YoY – Weaker-than-expected SB seafood season – Increase in NB volume • Signs of Alaska economy beginning to stabilize Container Volume (FEU Basis) 10,000 12,000 14,000 16,000 18,000 20,000 22,000 Q1 Q2 Q3 Q4 2017 2018 Full Year 2018 Outlook • Expect FY 2018 volume to be modestly higher than the level achieved in 2017 – Improvement in NB volume largely related to a dry-docking of a competitor’s vessel – Weaker-than-expected SB seafood season given last year’s very strong seafood harvest Note: 1Q 2018 and 4Q 2017 volume figures include volume related to a competitor’s vessel dry-docking. |
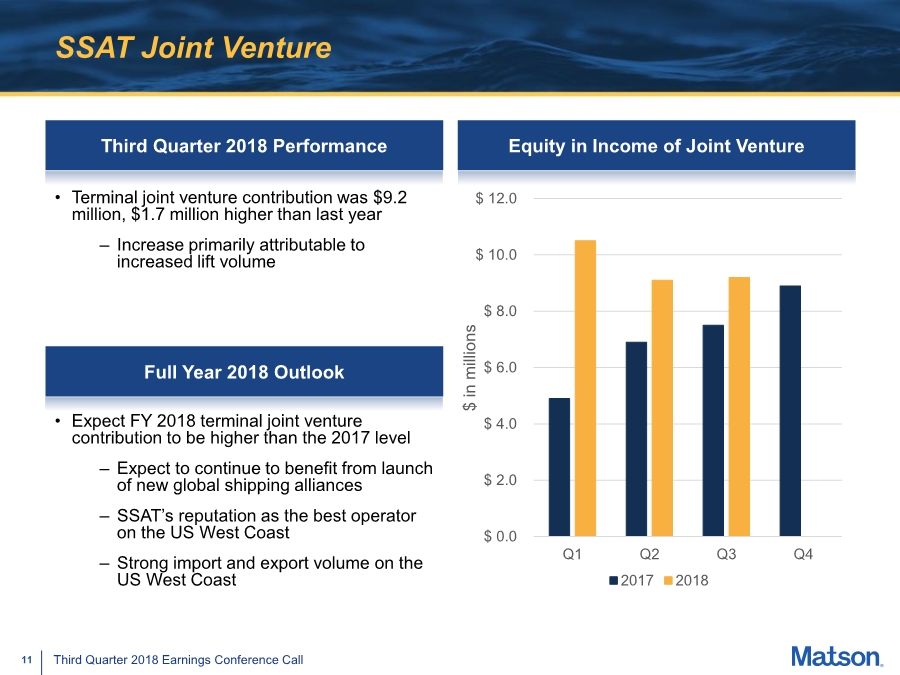
| 11 Third Quarter 2018 Earnings Conference Call SSAT Joint Venture Third Quarter 2018 Performance • Terminal joint venture contribution was $9.2 million, $1.7 million higher than last year – Increase primarily attributable to increased lift volume Equity in Income of Joint Venture $ 0.0 $ 2.0 $ 4.0 $ 6.0 $ 8.0 $ 10.0 $ 12.0 Q1 Q2 Q3 Q4 $ in millions 2017 2018 Full Year 2018 Outlook • Expect FY 2018 terminal joint venture contribution to be higher than the 2017 level – Expect to continue to benefit from launch of new global shipping alliances – SSAT’s reputation as the best operator on the US West Coast – Strong import and export volume on the US West Coast |
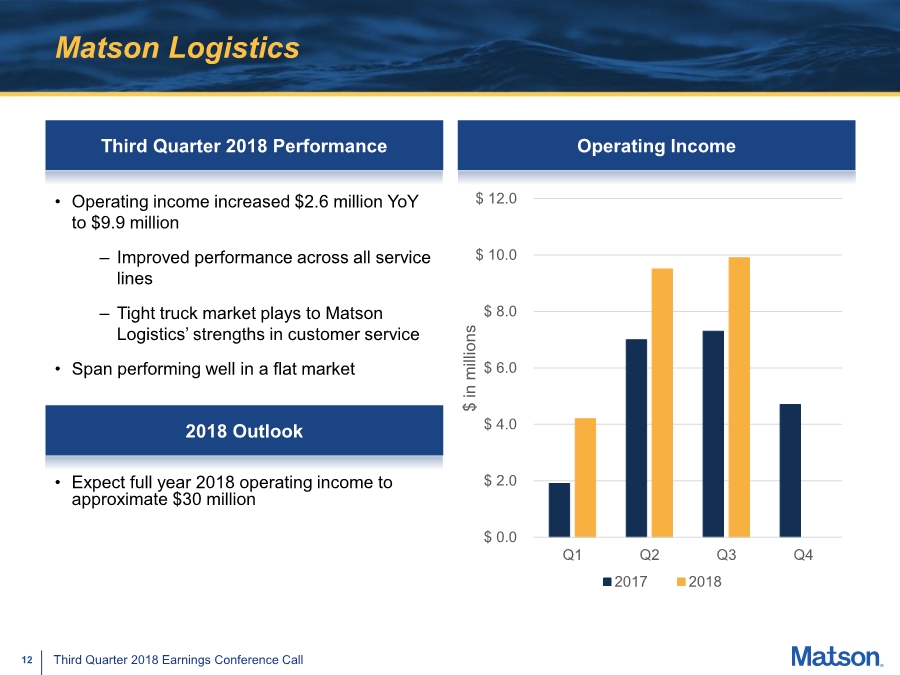
| 12 Third Quarter 2018 Earnings Conference Call Matson Logistics Third Quarter 2018 Performance • Operating income increased $2.6 million YoY to $9.9 million – Improved performance across all service lines – Tight truck market plays to Matson Logistics’ strengths in customer service • Span performing well in a flat market Operating Income 2018 Outlook • Expect full year 2018 operating income to approximate $30 million $ 0.0 $ 2.0 $ 4.0 $ 6.0 $ 8.0 $ 10.0 $ 12.0 Q1 Q2 Q3 Q4 $ in millions 2017 2018 |
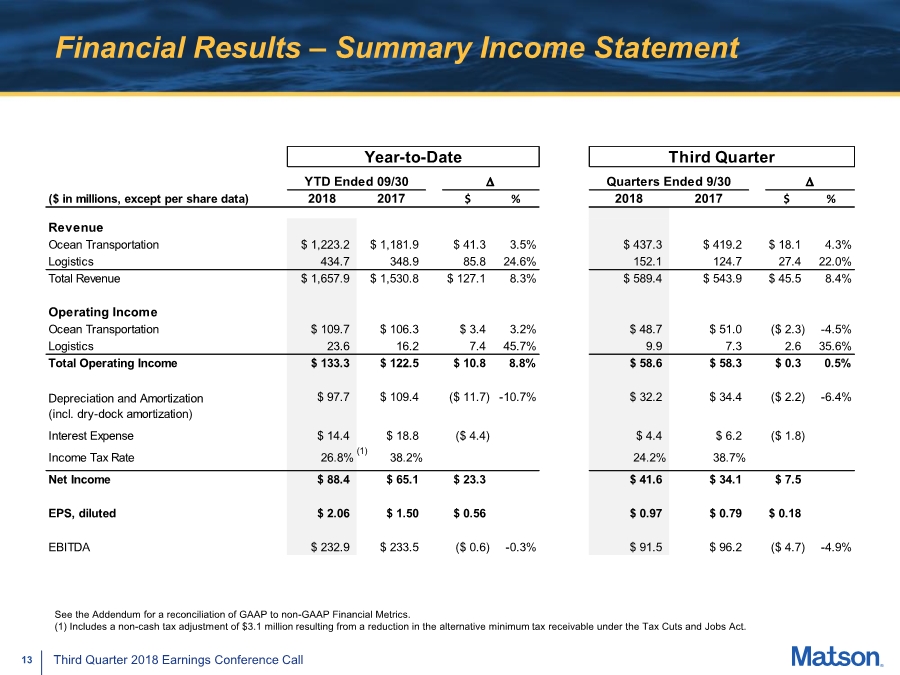
| 13 Third Quarter 2018 Earnings Conference Call Financial Results – Summary Income Statement See the Addendum for a reconciliation of GAAP to non-GAAP Financial Metrics. (1) Includes a non-cash tax adjustment of $3.1 million resulting from a reduction in the alternative minimum tax receivable under the Tax Cuts and Jobs Act. Year-to-Date Third Quarter YTD Ended 09/30 Quarters Ended 9/30 ($ in millions, except per share data) 2018 2017 $ % 2018 2017 $ % Revenue Ocean Transportation $ 1,223.2 $ 1,181.9 $ 41.3 3.5% $ 437.3 $ 419.2 $ 18.1 4.3% Logistics 434.7 348.9 85.8 24.6% 152.1 124.7 27.4 22.0% Total Revenue $ 1,657.9 $ 1,530.8 $ 127.1 8.3% $ 589.4 $ 543.9 $ 45.5 8.4% Operating Income Ocean Transportation $ 109.7 $ 106.3 $ 3.4 3.2% $ 48.7 $ 51.0 ($ 2.3) -4.5% Logistics 23.6 16.2 7.4 45.7% 9.9 7.3 2.6 35.6% Total Operating Income $ 133.3 $ 122.5 $ 10.8 8.8% $ 58.6 $ 58.3 $ 0.3 0.5% $ 97.7 $ 109.4 ($ 11.7) -10.7% $ 32.2 $ 34.4 ($ 2.2) -6.4% Interest Expense $ 14.4 $ 18.8 ($ 4.4) $ 4.4 $ 6.2 ($ 1.8) Income Tax Rate 26.8% 38.2% 24.2% 38.7% Net Income $ 88.4 $ 65.1 $ 23.3 $ 41.6 $ 34.1 $ 7.5 EPS, diluted $ 2.06 $ 1.50 $ 0.56 $ 0.97 $ 0.79 $ 0.18 EBITDA $ 232.9 $ 233.5 ($ 0.6) -0.3% $ 91.5 $ 96.2 ($ 4.7) -4.9% Depreciation and Amortization (incl. dry-dock amortization) (1) |
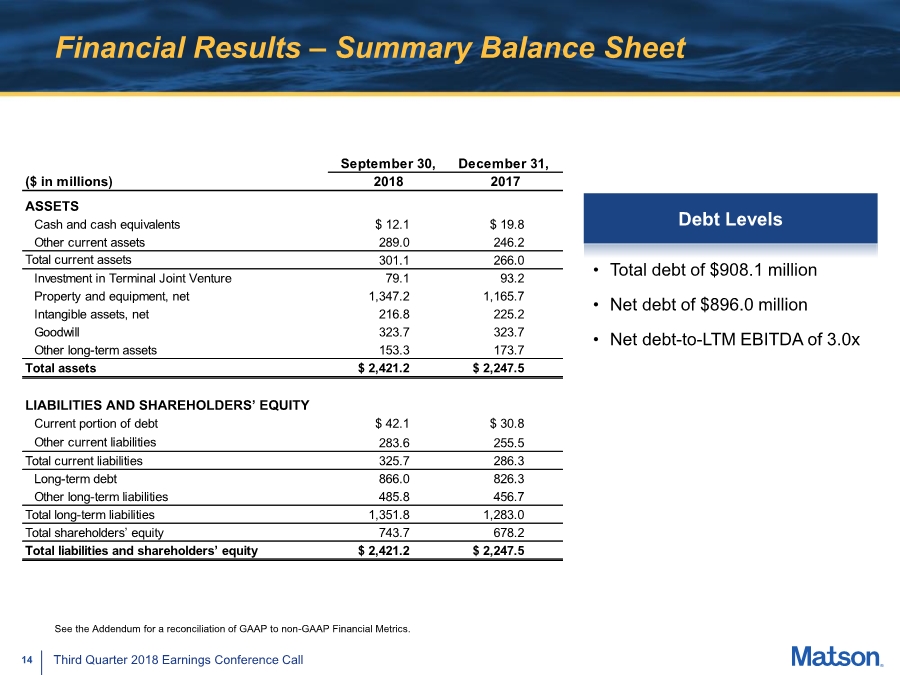
| 14 Third Quarter 2018 Earnings Conference Call Financial Results – Summary Balance Sheet • Total debt of $908.1 million • Net debt of $896.0 million • Net debt-to-LTM EBITDA of 3.0x See the Addendum for a reconciliation of GAAP to non-GAAP Financial Metrics. Debt Levels ($ in millions) ASSETS Cash and cash equivalents $ 12.1 $ 19.8 Other current assets 289.0 246.2 Total current assets 301.1 266.0 Investment in Terminal Joint Venture 79.1 93.2 Property and equipment, net 1,347.2 1,165.7 Intangible assets, net 216.8 225.2 Goodwill 323.7 323.7 Other long-term assets 153.3 173.7 Total assets $ 2,421.2 $ 2,247.5 LIABILITIES AND SHAREHOLDERS’ EQUITY Current portion of debt $ 42.1 $ 30.8 Other current liabilities 283.6 255.5 Total current liabilities 325.7 286.3 Long-term debt 866.0 826.3 Other long-term liabilities 485.8 456.7 Total long-term liabilities 1,351.8 1,283.0 Total shareholders’ equity 743.7 678.2 Total liabilities and shareholders’ equity $ 2,421.2 $ 2,247.5 September 30, December 31, 2018 2017 |
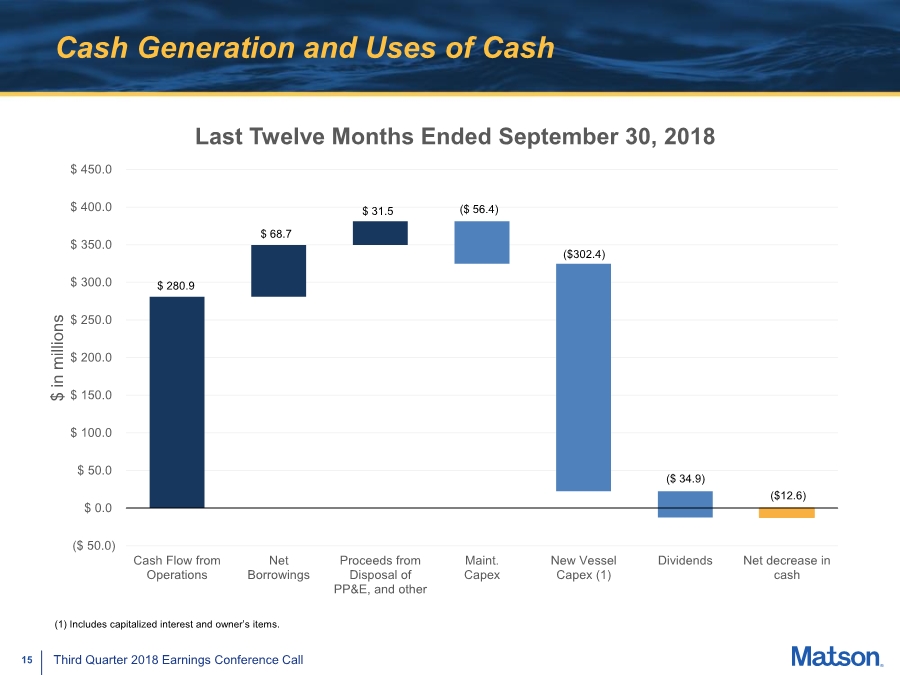
| 15 Third Quarter 2018 Earnings Conference Call Cash Generation and Uses of Cash ($ 50.0) $ 0.0 $ 50.0 $ 100.0 $ 150.0 $ 200.0 $ 250.0 $ 300.0 $ 350.0 $ 400.0 $ 450.0 Cash Flow from Operations Net Borrowings Proceeds from Disposal of PP&E, and other Maint. Capex New Vessel Capex (1) Dividends Net decrease in cash $ in millions Last Twelve Months Ended September 30, 2018 $ 280.9 $ 68.7 $ 31.5 ($ 56.4) ($302.4) ($ 34.9) ($12.6) (1) Includes capitalized interest and owner’s items. |
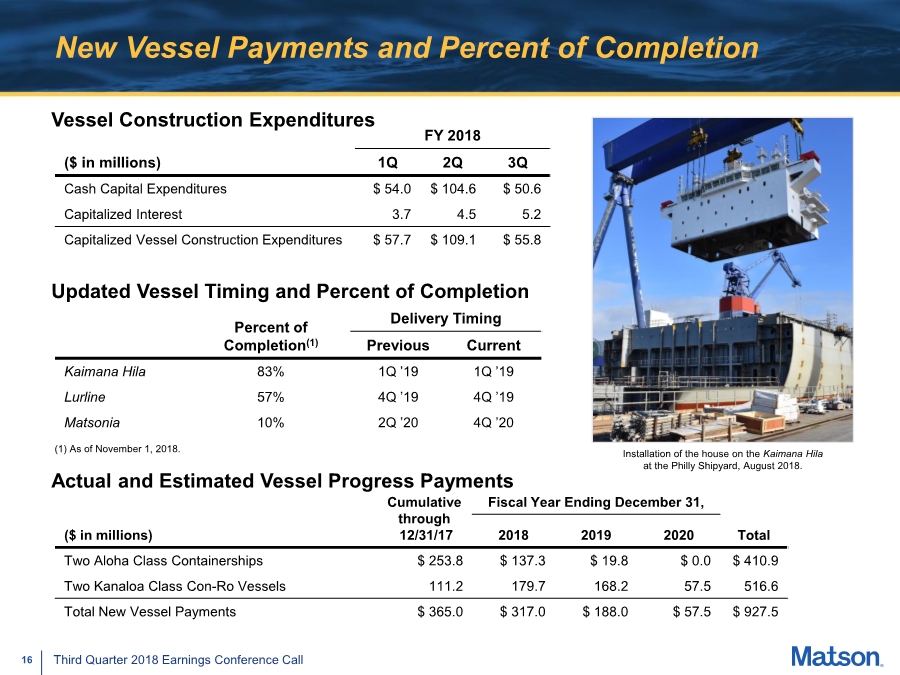
| 16 Third Quarter 2018 Earnings Conference Call New Vessel Payments and Percent of Completion Actual and Estimated Vessel Progress Payments FY 2018 ($ in millions) 1Q 2Q 3Q Cash Capital Expenditures $ 54.0 $ 104.6 $ 50.6 Capitalized Interest 3.7 4.5 5.2 Capitalized Vessel Construction Expenditures $ 57.7 $ 109.1 $ 55.8 Cumulative through 12/31/17 Fiscal Year Ending December 31, ($ in millions) 2018 2019 2020 Total Two Aloha Class Containerships $ 253.8 $ 137.3 $ 19.8 $ 0.0 $ 410.9 Two Kanaloa Class Con-Ro Vessels 111.2 179.7 168.2 57.5 516.6 Total New Vessel Payments $ 365.0 $ 317.0 $ 188.0 $ 57.5 $ 927.5 Installation of the house on the Kaimana Hila at the Philly Shipyard, August 2018. Updated Vessel Timing and Percent of Completion Vessel Construction Expenditures Percent of Completion(1) Delivery Timing Previous Current Kaimana Hila 83% 1Q ’19 1Q ’19 Lurline 57% 4Q ’19 4Q ’19 Matsonia 10% 2Q ’20 4Q ’20 (1) As of November 1, 2018. |
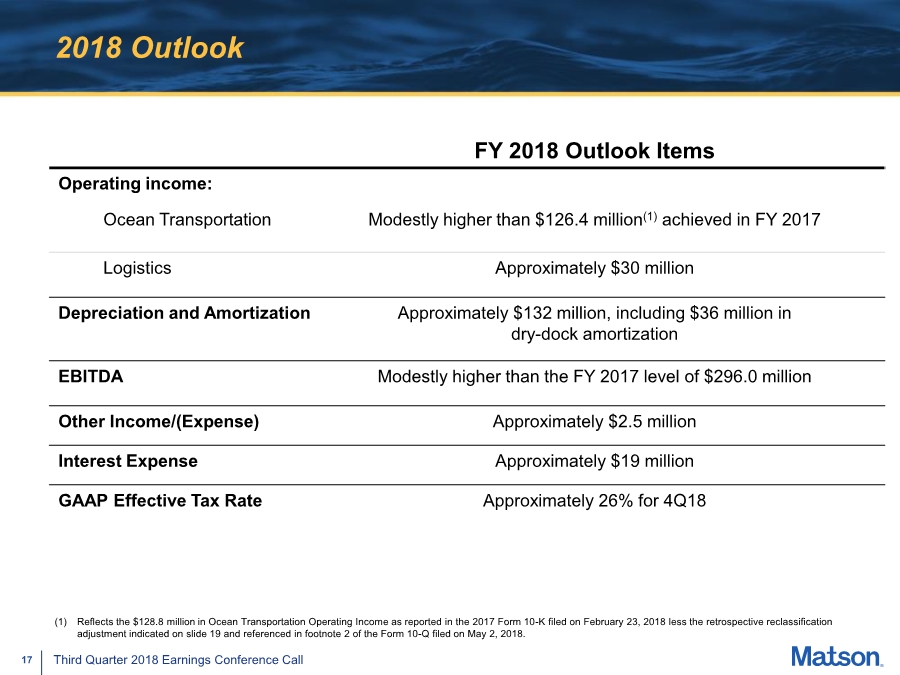
| 17 Third Quarter 2018 Earnings Conference Call 2018 Outlook FY 2018 Outlook Items Operating income: Ocean Transportation Modestly higher than $126.4 million(1) achieved in FY 2017 Logistics Approximately $30 million Depreciation and Amortization Approximately $132 million, including $36 million in dry-dock amortization EBITDA Modestly higher than the FY 2017 level of $296.0 million Other Income/(Expense) Approximately $2.5 million Interest Expense Approximately $19 million GAAP Effective Tax Rate Approximately 26% for 4Q18 (1) Reflects the $128.8 million in Ocean Transportation Operating Income as reported in the 2017 Form 10-K filed on February 23, 2018 less the retrospective reclassification adjustment indicated on slide 19 and referenced in footnote 2 of the Form 10-Q filed on May 2, 2018. |
| 18 Third Quarter 2018 Earnings Conference Call Addendum |
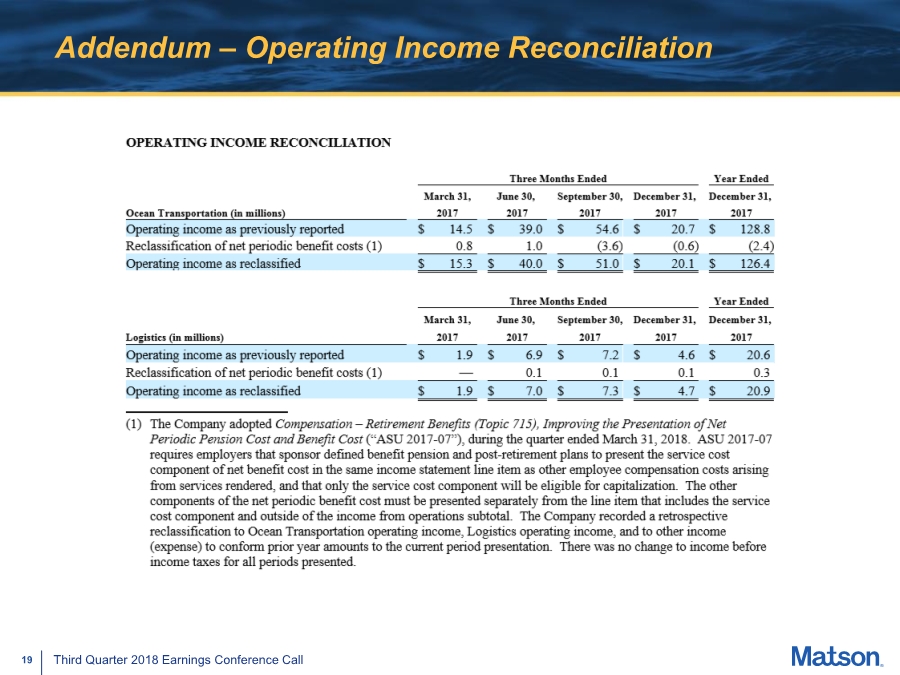
| 19 Third Quarter 2018 Earnings Conference Call Addendum – Operating Income Reconciliation |
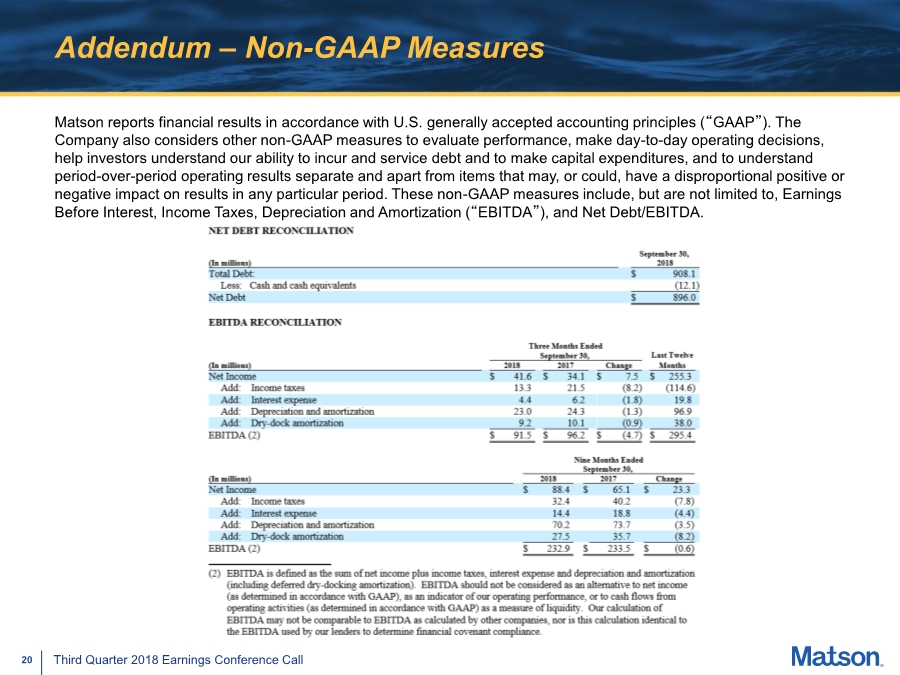
| 20 Third Quarter 2018 Earnings Conference Call Addendum – Non-GAAP Measures Matson reports financial results in accordance with U.S. generally accepted accounting principles (“GAAP”). The Company also considers other non-GAAP measures to evaluate performance, make day-to-day operating decisions, help investors understand our ability to incur and service debt and to make capital expenditures, and to understand period-over-period operating results separate and apart from items that may, or could, have a disproportional positive or negative impact on results in any particular period. These non-GAAP measures include, but are not limited to, Earnings Before Interest, Income Taxes, Depreciation and Amortization (“EBITDA”), and Net Debt/EBITDA. |