Attached files
| file | filename |
|---|---|
| EX-99.1 - EX-99.1 - ESSENTIAL PROPERTIES REALTY TRUST, INC. | eprt-ex991_6.htm |
| 8-K - 8-K - ESSENTIAL PROPERTIES REALTY TRUST, INC. | eprt-8k_20181105.htm |
Supplemental Operating & Financial Data Third Quarter Ended September 30, 2018 Exhibit 99.2
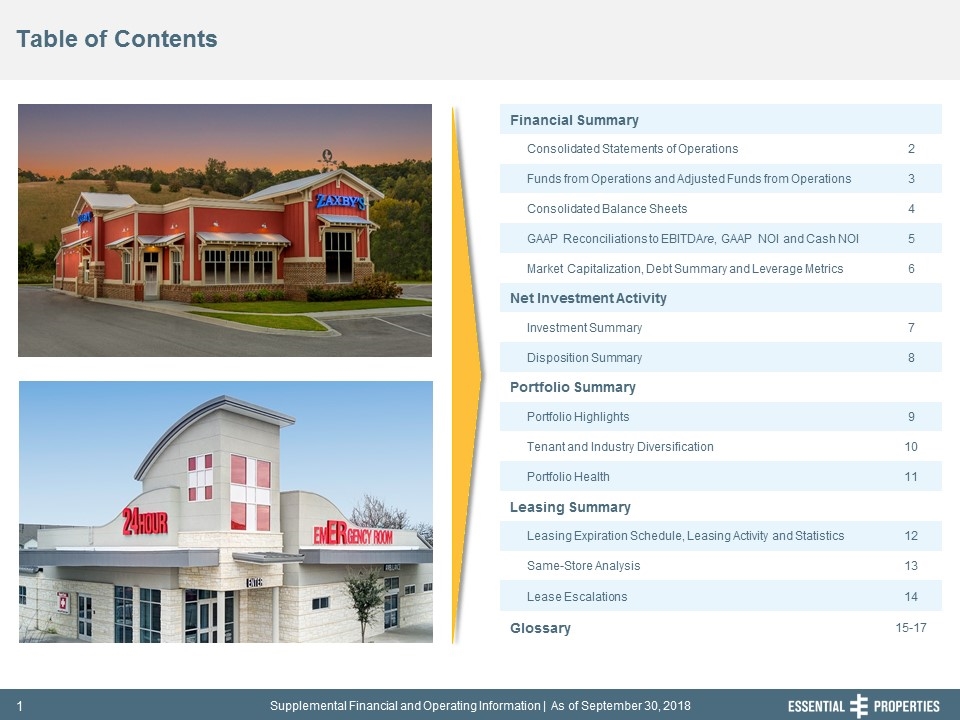
Table of Contents 242, 242, 242 Financial Summary Consolidated Statements of Operations 2 Funds from Operations and Adjusted Funds from Operations 3 Consolidated Balance Sheets 4 GAAP Reconciliations to EBITDAre, GAAP NOI and Cash NOI 5 Market Capitalization, Debt Summary and Leverage Metrics 6 Net Investment Activity Investment Summary 7 Disposition Summary 8 Portfolio Summary Portfolio Highlights 9 Tenant and Industry Diversification 10 Portfolio Health 11 Leasing Summary Leasing Expiration Schedule, Leasing Activity and Statistics 12 Same-Store Analysis 13 Lease Escalations 14 Glossary 15-17
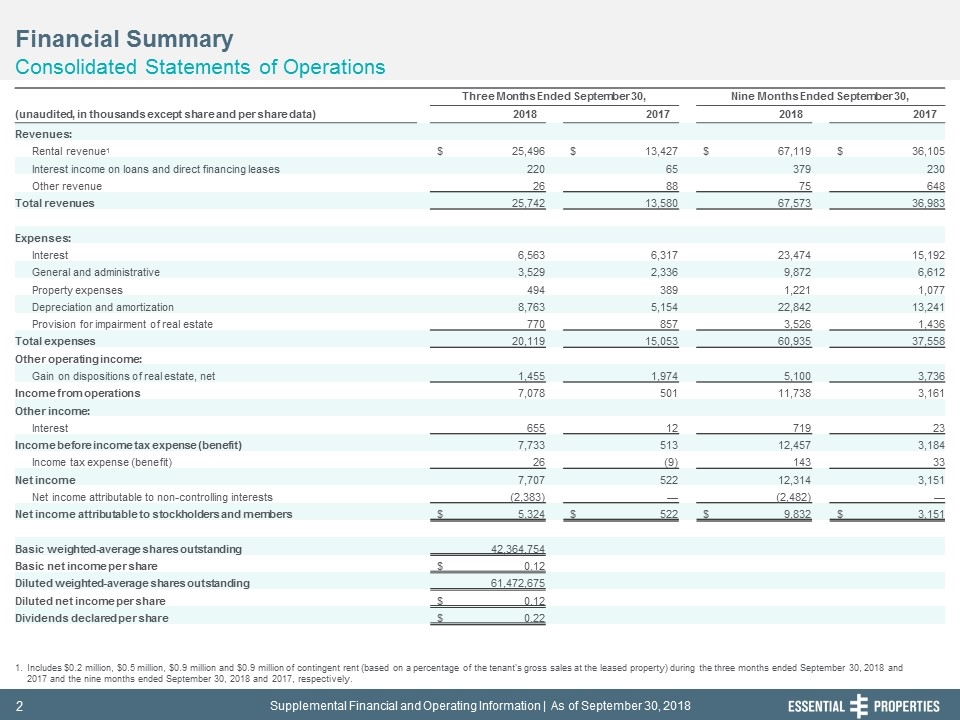
Financial Summary Consolidated Statements of Operations 242, 242, 242 Includes $0.2 million, $0.5 million, $0.9 million and $0.9 million of contingent rent (based on a percentage of the tenant's gross sales at the leased property) during the three months ended September 30, 2018 and 2017 and the nine months ended September 30, 2018 and 2017, respectively. Three Months Ended September 30, Nine Months Ended September 30, (unaudited, in thousands except share and per share data) 2018 2017 2018 2017 Revenues: Rental revenue1 $ 25,496 $ 13,427 $ 67,119 $ 36,105 Interest income on loans and direct financing leases 220 65 379 230 Other revenue 26 88 75 648 Total revenues 25,742 13,580 67,573 36,983 Expenses: Interest 6,563 6,317 23,474 15,192 General and administrative 3,529 2,336 9,872 6,612 Property expenses 494 389 1,221 1,077 Depreciation and amortization 8,763 5,154 22,842 13,241 Provision for impairment of real estate 770 857 3,526 1,436 Total expenses 20,119 15,053 60,935 37,558 Other operating income: Gain on dispositions of real estate, net 1,455 1,974 5,100 3,736 Income from operations 7,078 501 11,738 3,161 Other income: Interest 655 12 719 23 Income before income tax expense (benefit) 7,733 513 12,457 3,184 Income tax expense (benefit) 26 (9) 143 33 Net income 7,707 522 12,314 3,151 Net income attributable to non-controlling interests (2,383) — (2,482) — Net income attributable to stockholders and members $ 5,324 $ 522 $ 9,832 $ 3,151 Basic weighted-average shares outstanding 42,364,754 Basic net income per share $ 0.12 Diluted weighted-average shares outstanding 61,472,675 Diluted net income per share $ 0.12 Dividends declared per share $ 0.22
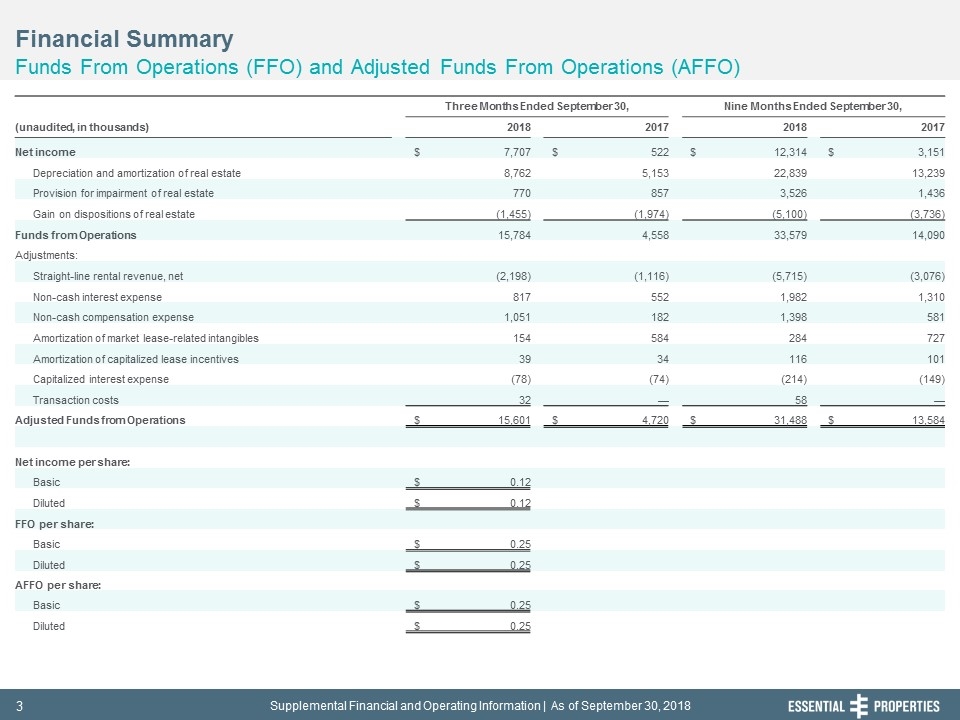
Financial Summary Funds From Operations (FFO) and Adjusted Funds From Operations (AFFO) 242, 242, 242 Three Months Ended September 30, Nine Months Ended September 30, (unaudited, in thousands) 2018 2017 2018 2017 Net income $ 7,707 $ 522 $ 12,314 $ 3,151 Depreciation and amortization of real estate 8,762 5,153 22,839 13,239 Provision for impairment of real estate 770 857 3,526 1,436 Gain on dispositions of real estate (1,455) (1,974) (5,100) (3,736) Funds from Operations 15,784 4,558 33,579 14,090 Adjustments: Straight-line rental revenue, net (2,198) (1,116) (5,715) (3,076) Non-cash interest expense 817 552 1,982 1,310 Non-cash compensation expense 1,051 182 1,398 581 Amortization of market lease-related intangibles 154 584 284 727 Amortization of capitalized lease incentives 39 34 116 101 Capitalized interest expense (78) (74) (214) (149) Transaction costs 32 — 58 — Adjusted Funds from Operations $ 15,601 $ 4,720 $ 31,488 $ 13,584 Net income per share: Basic $ 0.12 Diluted $ 0.12 FFO per share: Basic $ 0.25 Diluted $ 0.25 AFFO per share: Basic $ 0.25 Diluted $ 0.25
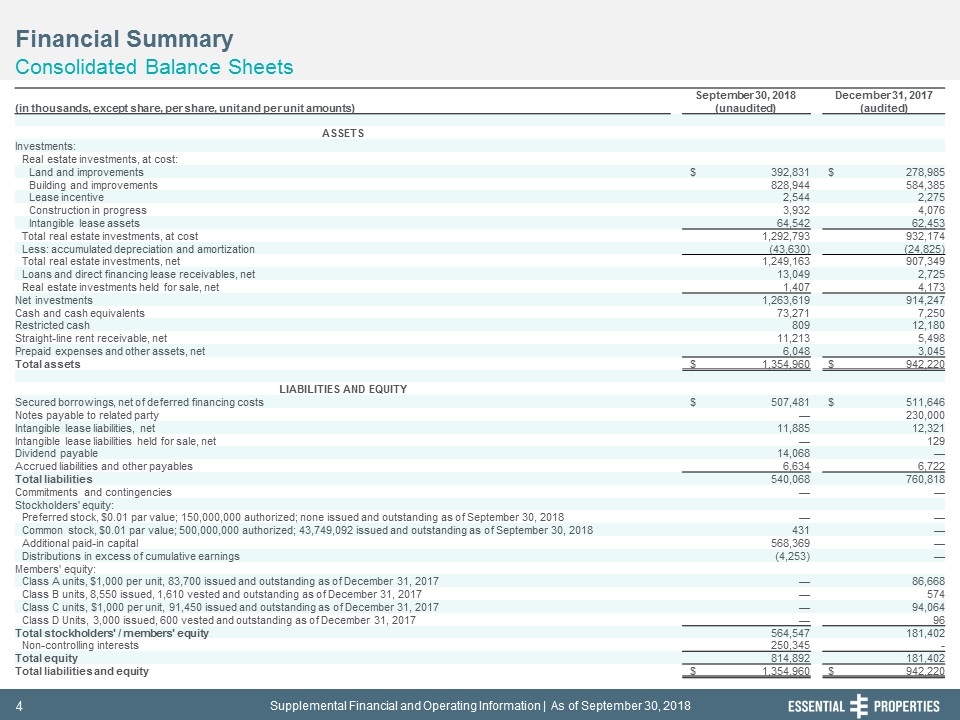
Financial Summary Consolidated Balance Sheets 242, 242, 242 September 30, 2018 December 31, 2017 (in thousands, except share, per share, unit and per unit amounts) (unaudited) (audited) ASSETS Investments: Real estate investments, at cost: Land and improvements $ 392,831 $ 278,985 Building and improvements 828,944 584,385 Lease incentive 2,544 2,275 Construction in progress 3,932 4,076 Intangible lease assets 64,542 62,453 Total real estate investments, at cost 1,292,793 932,174 Less: accumulated depreciation and amortization (43,630) (24,825) Total real estate investments, net 1,249,163 907,349 Loans and direct financing lease receivables, net 13,049 2,725 Real estate investments held for sale, net 1,407 4,173 Net investments 1,263,619 914,247 Cash and cash equivalents 73,271 7,250 Restricted cash 809 12,180 Straight-line rent receivable, net 11,213 5,498 Prepaid expenses and other assets, net 6,048 3,045 Total assets $ 1,354,960 $ 942,220 LIABILITIES AND EQUITY Secured borrowings, net of deferred financing costs $ 507,481 $ 511,646 Notes payable to related party — 230,000 Intangible lease liabilities, net 11,885 12,321 Intangible lease liabilities held for sale, net — 129 Dividend payable 14,068 — Accrued liabilities and other payables 6,634 6,722 Total liabilities 540,068 760,818 Commitments and contingencies — — Stockholders' equity: Preferred stock, $0.01 par value; 150,000,000 authorized; none issued and outstanding as of September 30, 2018 — — Common stock, $0.01 par value; 500,000,000 authorized; 43,749,092 issued and outstanding as of September 30, 2018 431 — Additional paid-in capital 568,369 — Distributions in excess of cumulative earnings (4,253) — Members' equity: Class A units, $1,000 per unit, 83,700 issued and outstanding as of December 31, 2017 — 86,668 Class B units, 8,550 issued, 1,610 vested and outstanding as of December 31, 2017 — 574 Class C units, $1,000 per unit, 91,450 issued and outstanding as of December 31, 2017 — 94,064 Class D Units, 3,000 issued, 600 vested and outstanding as of December 31, 2017 — 96 Total stockholders' / members' equity 564,547 181,402 Non-controlling interests 250,345 - Total equity 814,892 181,402 Total liabilities and equity $ 1,354,960 $ 942,220
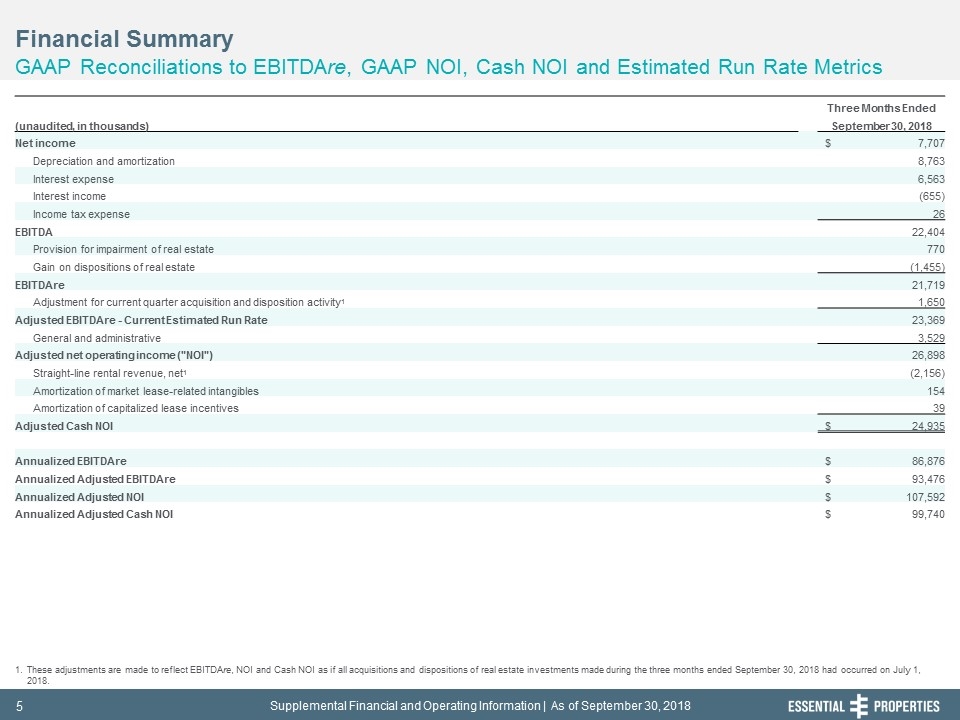
Financial Summary GAAP Reconciliations to EBITDAre, GAAP NOI, Cash NOI and Estimated Run Rate Metrics 242, 242, 242 These adjustments are made to reflect EBITDAre, NOI and Cash NOI as if all acquisitions and dispositions of real estate investments made during the three months ended September 30, 2018 had occurred on July 1, 2018. Three Months Ended (unaudited, in thousands) September 30, 2018 Net income $ 7,707 Depreciation and amortization 8,763 Interest expense 6,563 Interest income (655) Income tax expense 26 EBITDA 22,404 Provision for impairment of real estate 770 Gain on dispositions of real estate (1,455) EBITDAre 21,719 Adjustment for current quarter acquisition and disposition activity1 1,650 Adjusted EBITDAre - Current Estimated Run Rate 23,369 General and administrative 3,529 Adjusted net operating income ("NOI") 26,898 Straight-line rental revenue, net1 (2,156) Amortization of market lease-related intangibles 154 Amortization of capitalized lease incentives 39 Adjusted Cash NOI $ 24,935 Annualized EBITDAre $ 86,876 Annualized Adjusted EBITDAre $ 93,476 Annualized Adjusted NOI $ 107,592 Annualized Adjusted Cash NOI $ 99,740
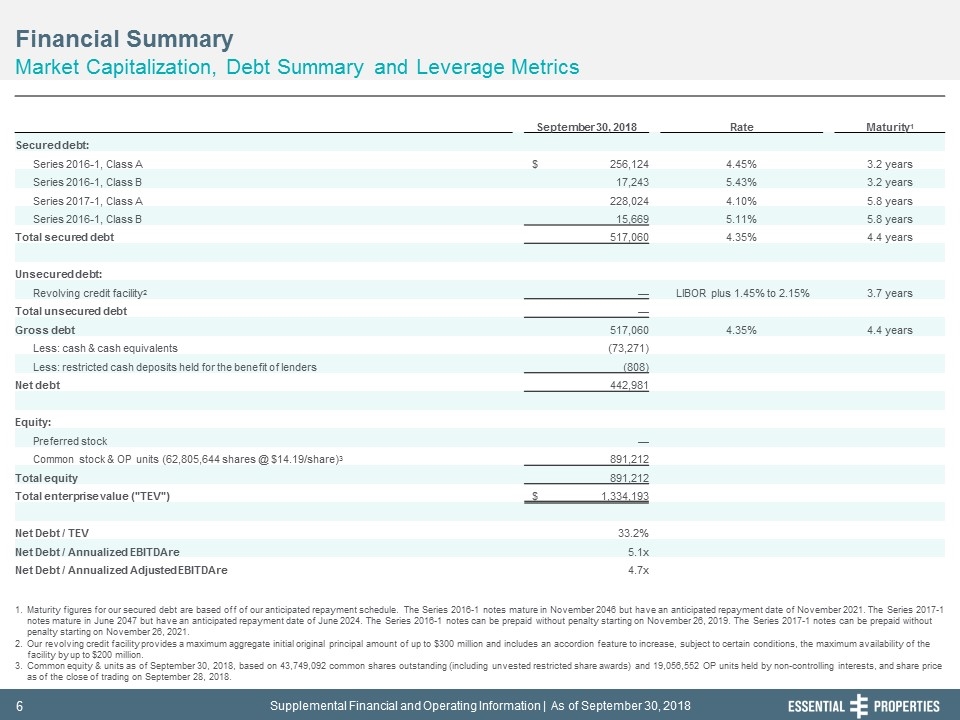
Financial Summary Market Capitalization, Debt Summary and Leverage Metrics 242, 242, 242 Maturity figures for our secured debt are based off of our anticipated repayment schedule. The Series 2016-1 notes mature in November 2046 but have an anticipated repayment date of November 2021. The Series 2017-1 notes mature in June 2047 but have an anticipated repayment date of June 2024. The Series 2016-1 notes can be prepaid without penalty starting on November 26, 2019. The Series 2017-1 notes can be prepaid without penalty starting on November 26, 2021. Our revolving credit facility provides a maximum aggregate initial original principal amount of up to $300 million and includes an accordion feature to increase, subject to certain conditions, the maximum availability of the facility by up to $200 million. Common equity & units as of September 30, 2018, based on 43,749,092 common shares outstanding (including unvested restricted share awards) and 19,056,552 OP units held by non-controlling interests, and share price as of the close of trading on September 28, 2018. September 30, 2018 Rate Maturity1 Secured debt: Series 2016-1, Class A $ 256,124 4.45% 3.2 years Series 2016-1, Class B 17,243 5.43% 3.2 years Series 2017-1, Class A 228,024 4.10% 5.8 years Series 2016-1, Class B 15,669 5.11% 5.8 years Total secured debt 517,060 4.35% 4.4 years Unsecured debt: Revolving credit facility2 — LIBOR plus 1.45% to 2.15% 3.7 years Total unsecured debt — Gross debt 517,060 4.35% 4.4 years Less: cash & cash equivalents (73,271) Less: restricted cash deposits held for the benefit of lenders (808) Net debt 442,981 Equity: Preferred stock — Common stock & OP units (62,805,644 shares @ $14.19/share)3 891,212 Total equity 891,212 Total enterprise value ("TEV") $ 1,334,193 Net Debt / TEV 33.2% Net Debt / Annualized EBITDAre 5.1x Net Debt / Annualized Adjusted EBITDAre 4.7x
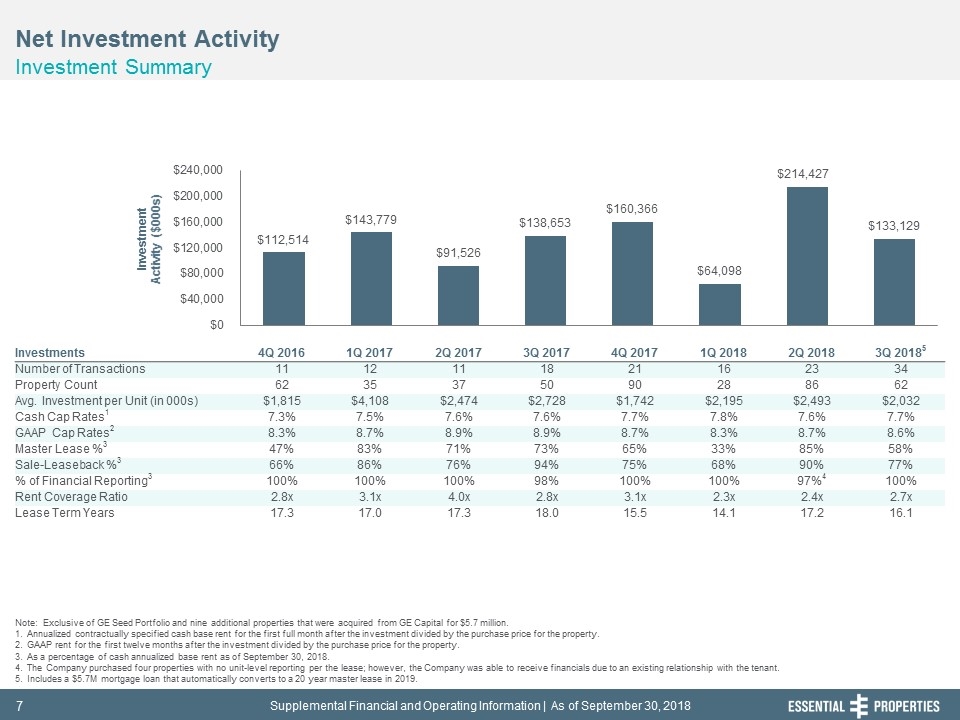
Net Investment Activity Investment Summary 242, 242, 242 Note: Exclusive of GE Seed Portfolio and nine additional properties that were acquired from GE Capital for $5.7 million. Annualized contractually specified cash base rent for the first full month after the investment divided by the purchase price for the property. GAAP rent for the first twelve months after the investment divided by the purchase price for the property. As a percentage of cash annualized base rent as of September 30, 2018. The Company purchased four properties with no unit-level reporting per the lease; however, the Company was able to receive financials due to an existing relationship with the tenant. Includes a $5.7M mortgage loan that automatically converts to a 20 year master lease in 2019. Investments 4Q 2016 1Q 2017 2Q 2017 3Q 2017 4Q 2017 1Q 2018 2Q 2018 3Q 20185 Number of Transactions 11 12 11 18 21 16 23 34 Property Count 62 35 37 50 90 28 86 62 Avg. Investment per Unit (in 000s) $1,815 $4,108 $2,474 $2,728 $1,742 $2,195 $2,493 $2,032 Cash Cap Rates1 7.3% 7.5% 7.6% 7.6% 7.7% 7.8% 7.6% 7.7% GAAP Cap Rates2 8.3% 8.7% 8.9% 8.9% 8.7% 8.3% 8.7% 8.6% Master Lease %3 47% 83% 71% 73% 65% 33% 85% 58% Sale-Leaseback %3 66% 86% 76% 94% 75% 68% 90% 77% % of Financial Reporting3 100% 100% 100% 98% 100% 100% 97%4 100% Rent Coverage Ratio 2.8x 3.1x 4.0x 2.8x 3.1x 2.3x 2.4x 2.7x Lease Term Years 17.3 17.0 17.3 18.0 15.5 14.1 17.2 16.1
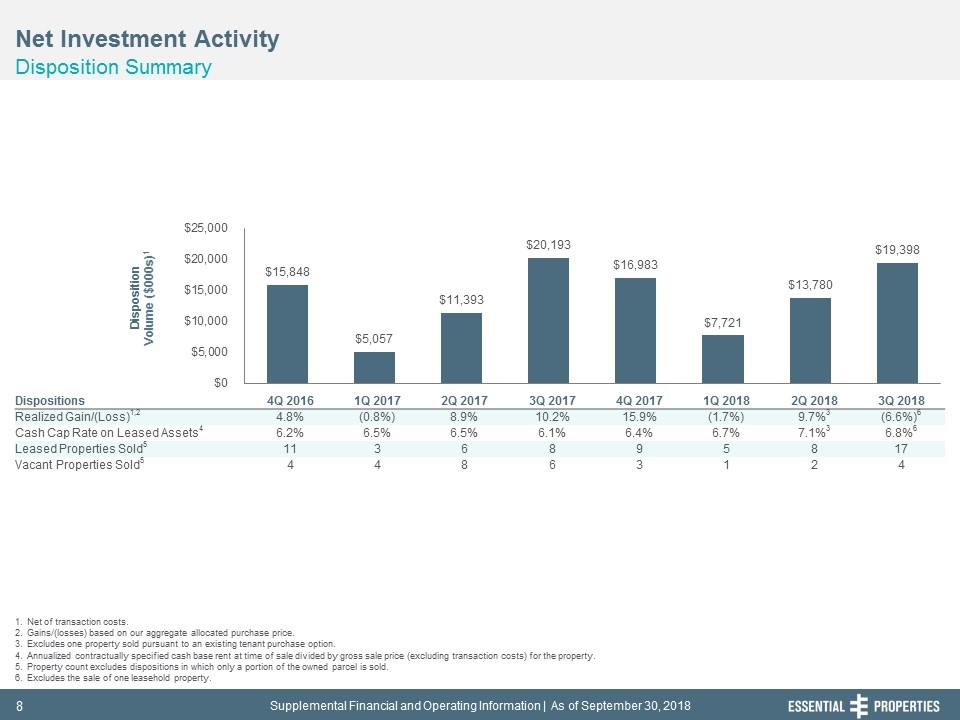
Net Investment Activity Disposition Summary 242, 242, 242 Net of transaction costs. Gains/(losses) based on our aggregate allocated purchase price. Excludes one property sold pursuant to an existing tenant purchase option. Annualized contractually specified cash base rent at time of sale divided by gross sale price (excluding transaction costs) for the property. Property count excludes dispositions in which only a portion of the owned parcel is sold. Excludes the sale of one leasehold property. Dispositions 4Q 2016 1Q 2017 2Q 2017 3Q 2017 4Q 2017 1Q 2018 2Q 2018 3Q 2018 Realized Gain/(Loss)1,2 4.8% (0.8%) 8.9% 10.2% 15.9% (1.7%) 9.7%3 (6.6%)6 Cash Cap Rate on Leased Assets4 6.2% 6.5% 6.5% 6.1% 6.4% 6.7% 7.1%3 6.8%6 Leased Properties Sold5 11 3 6 8 9 5 8 17 Vacant Properties Sold5 4 4 8 6 3 1 2 4
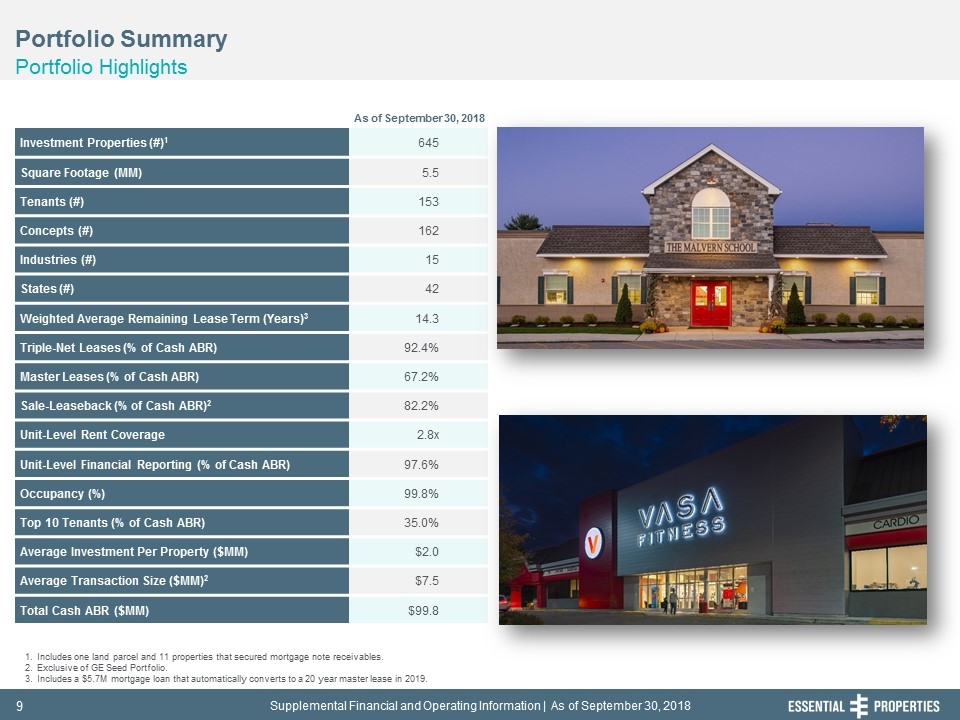
Portfolio Summary Portfolio Highlights 242, 242, 242 Investment Properties (#)1 645 Square Footage (MM) 5.5 Tenants (#) 153 Concepts (#) 162 Industries (#) 15 States (#) 42 Weighted Average Remaining Lease Term (Years)3 14.3 Triple-Net Leases (% of Cash ABR) 92.4% Master Leases (% of Cash ABR) 67.2% Sale-Leaseback (% of Cash ABR)2 82.2% Unit-Level Rent Coverage 2.8x Unit-Level Financial Reporting (% of Cash ABR) 97.6% Occupancy (%) 99.8% Top 10 Tenants (% of Cash ABR) 35.0% Average Investment Per Property ($MM) $2.0 Average Transaction Size ($MM)2 $7.5 Total Cash ABR ($MM) $99.8 Includes one land parcel and 11 properties that secured mortgage note receivables. Exclusive of GE Seed Portfolio. Includes a $5.7M mortgage loan that automatically converts to a 20 year master lease in 2019. As of September 30, 2018
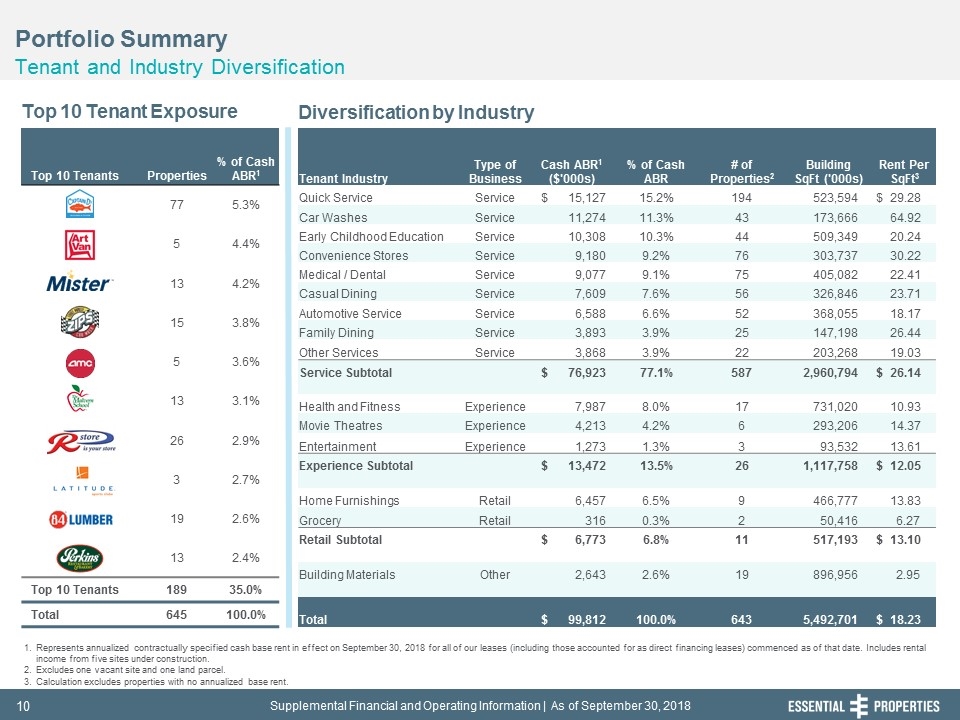
Portfolio Summary Tenant and Industry Diversification 242, 242, 242 Top 10 Tenants Properties % of Cash ABR1 77 5.3% 5 4.4% 13 4.2% 15 3.8% 5 3.6% 13 3.1% 26 2.9% 3 2.7% 19 2.6% 13 2.4% Top 10 Tenants 189 35.0% Total 645 100.0% Top 10 Tenant Exposure Diversification by Industry Represents annualized contractually specified cash base rent in effect on September 30, 2018 for all of our leases (including those accounted for as direct financing leases) commenced as of that date. Includes rental income from five sites under construction. Excludes one vacant site and one land parcel. Calculation excludes properties with no annualized base rent. Tenant Industry Type of Business Cash ABR1 ($'000s) % of Cash ABR # of Properties2 Building SqFt ('000s) Rent Per SqFt3 Quick Service Service $ 15,127 15.2% 194 523,594 $ 29.28 Car Washes Service 11,274 11.3% 43 173,666 64.92 Early Childhood Education Service 10,308 10.3% 44 509,349 20.24 Convenience Stores Service 9,180 9.2% 76 303,737 30.22 Medical / Dental Service 9,077 9.1% 75 405,082 22.41 Casual Dining Service 7,609 7.6% 56 326,846 23.71 Automotive Service Service 6,588 6.6% 52 368,055 18.17 Family Dining Service 3,893 3.9% 25 147,198 26.44 Other Services Service 3,868 3.9% 22 203,268 19.03 Service Subtotal $ 76,923 77.1% 587 2,960,794 $ 26.14 Health and Fitness Experience 7,987 8.0% 17 731,020 10.93 Movie Theatres Experience 4,213 4.2% 6 293,206 14.37 Entertainment Experience 1,273 1.3% 3 93,532 13.61 Experience Subtotal $ 13,472 13.5% 26 1,117,758 $ 12.05 Home Furnishings Retail 6,457 6.5% 9 466,777 13.83 Grocery Retail 316 0.3% 2 50,416 6.27 Retail Subtotal $ 6,773 6.8% 11 517,193 $ 13.10 Building Materials Other 2,643 2.6% 19 896,956 2.95 Total $ 99,812 100.0% 643 5,492,701 $ 18.23
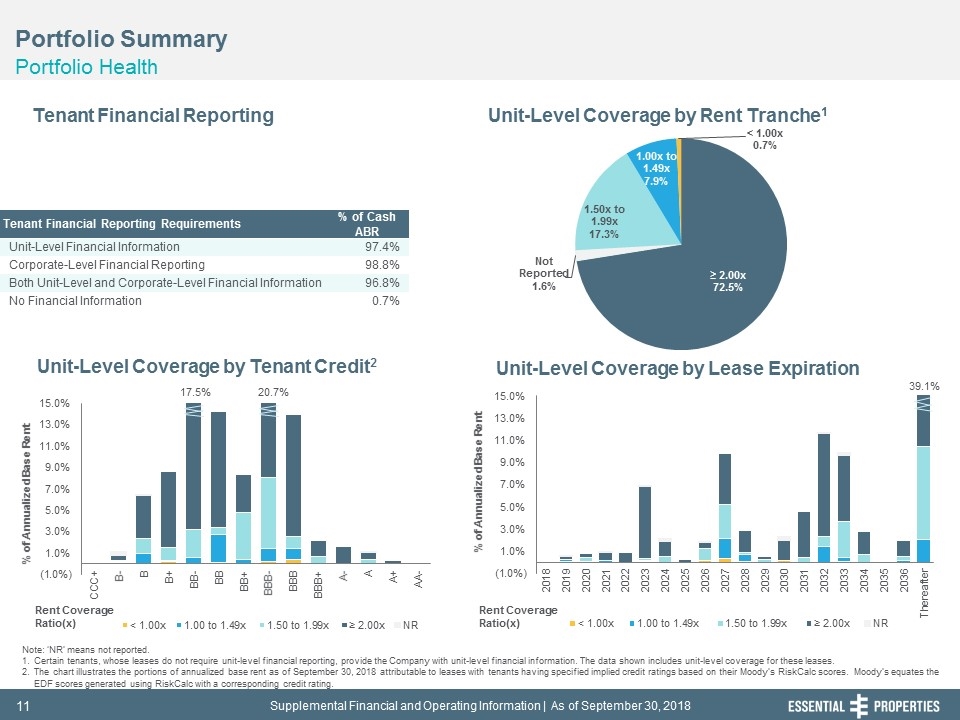
Portfolio Summary Portfolio Health 242, 242, 242 Tenant Financial Reporting Unit-Level Coverage by Rent Tranche1 Unit-Level Coverage by Lease Expiration Unit-Level Coverage by Tenant Credit2 Note: ‘NR’ means not reported. Certain tenants, whose leases do not require unit-level financial reporting, provide the Company with unit-level financial information. The data shown includes unit-level coverage for these leases. The chart illustrates the portions of annualized base rent as of September 30, 2018 attributable to leases with tenants having specified implied credit ratings based on their Moody’s RiskCalc scores. Moody’s equates the EDF scores generated using RiskCalc with a corresponding credit rating. Tenant Financial Reporting Requirements % of Cash ABR Unit-Level Financial Information 97.4% Corporate-Level Financial Reporting 98.8% Both Unit-Level and Corporate-Level Financial Information 96.8% No Financial Information 0.7% 17.5% 20.7% 39.1%
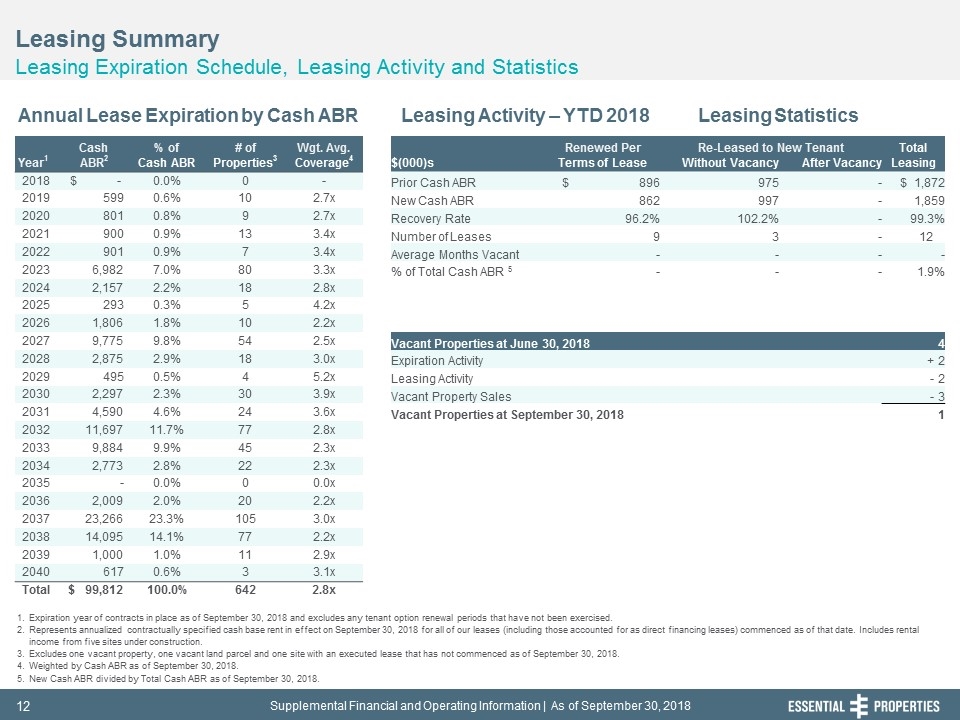
Leasing Summary Leasing Expiration Schedule, Leasing Activity and Statistics 242, 242, 242 Expiration year of contracts in place as of September 30, 2018 and excludes any tenant option renewal periods that have not been exercised. Represents annualized contractually specified cash base rent in effect on September 30, 2018 for all of our leases (including those accounted for as direct financing leases) commenced as of that date. Includes rental income from five sites under construction. Excludes one vacant property, one vacant land parcel and one site with an executed lease that has not commenced as of September 30, 2018. Weighted by Cash ABR as of September 30, 2018. New Cash ABR divided by Total Cash ABR as of September 30, 2018. Annual Lease Expiration by Cash ABR Leasing Activity – YTD 2018 Leasing Statistics Cash % of # of Wgt. Avg. Renewed Per Re-Leased to New Tenant Total Year1 ABR2 Cash ABR Properties3 Coverage4 $(000)s Terms of Lease Without Vacancy After Vacancy Leasing 2018 $ - 0.0% 0 - Prior Cash ABR $ 896 975 - $ 1,872 2019 599 0.6% 10 2.7x New Cash ABR 862 997 - 1,859 2020 801 0.8% 9 2.7x Recovery Rate 96.2% 102.2% - 99.3% 2021 900 0.9% 13 3.4x Number of Leases 9 3 - 12 2022 901 0.9% 7 3.4x Average Months Vacant - - - - 2023 6,982 7.0% 80 3.3x % of Total Cash ABR 5 - - - 1.9% 2024 2,157 2.2% 18 2.8x 2025 293 0.3% 5 4.2x 2026 1,806 1.8% 10 2.2x 2027 9,775 9.8% 54 2.5x Vacant Properties at June 30, 2018 4 2028 2,875 2.9% 18 3.0x Expiration Activity + 2 2029 495 0.5% 4 5.2x Leasing Activity - 2 2030 2,297 2.3% 30 3.9x Vacant Property Sales - 3 2031 4,590 4.6% 24 3.6x Vacant Properties at September 30, 2018 1 2032 11,697 11.7% 77 2.8x 2033 9,884 9.9% 45 2.3x 2034 2,773 2.8% 22 2.3x 2035 - 0.0% 0 0.0x 2036 2,009 2.0% 20 2.2x 2037 23,266 23.3% 105 3.0x 2038 14,095 14.1% 77 2.2x 2039 1,000 1.0% 11 2.9x 2040 617 0.6% 3 3.1x Total $ 99,812 100.0% 642 2.8x
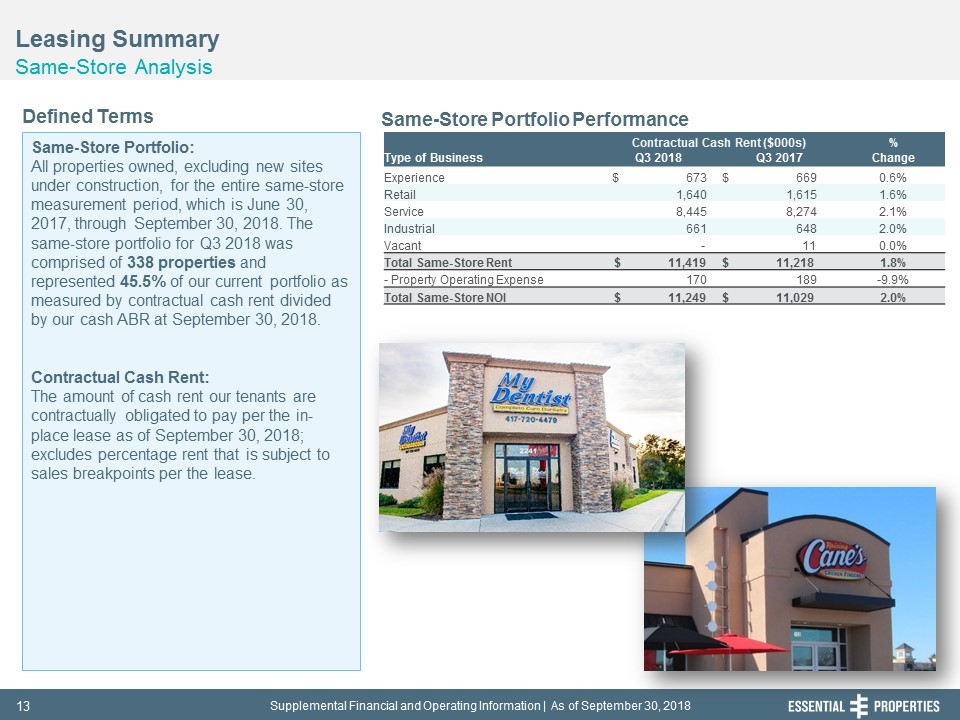
Leasing Summary Same-Store Analysis 242, 242, 242 Same-Store Portfolio: All properties owned, excluding new sites under construction, for the entire same-store measurement period, which is June 30, 2017, through September 30, 2018. The same-store portfolio for Q3 2018 was comprised of 338 properties and represented 45.5% of our current portfolio as measured by contractual cash rent divided by our cash ABR at September 30, 2018. Contractual Cash Rent: The amount of cash rent our tenants are contractually obligated to pay per the in-place lease as of September 30, 2018; excludes percentage rent that is subject to sales breakpoints per the lease. Defined Terms Same-Store Portfolio Performance Contractual Cash Rent ($000s) % Type of Business Q3 2018 Q3 2017 Change Experience $ 673 $ 669 0.6% Retail 1,640 1,615 1.6% Service 8,445 8,274 2.1% Industrial 661 648 2.0% Vacant - 11 0.0% Total Same-Store Rent $ 11,419 $ 11,218 1.8% - Property Operating Expense 170 189 -9.9% Total Same-Store NOI $ 11,249 $ 11,029 2.0%
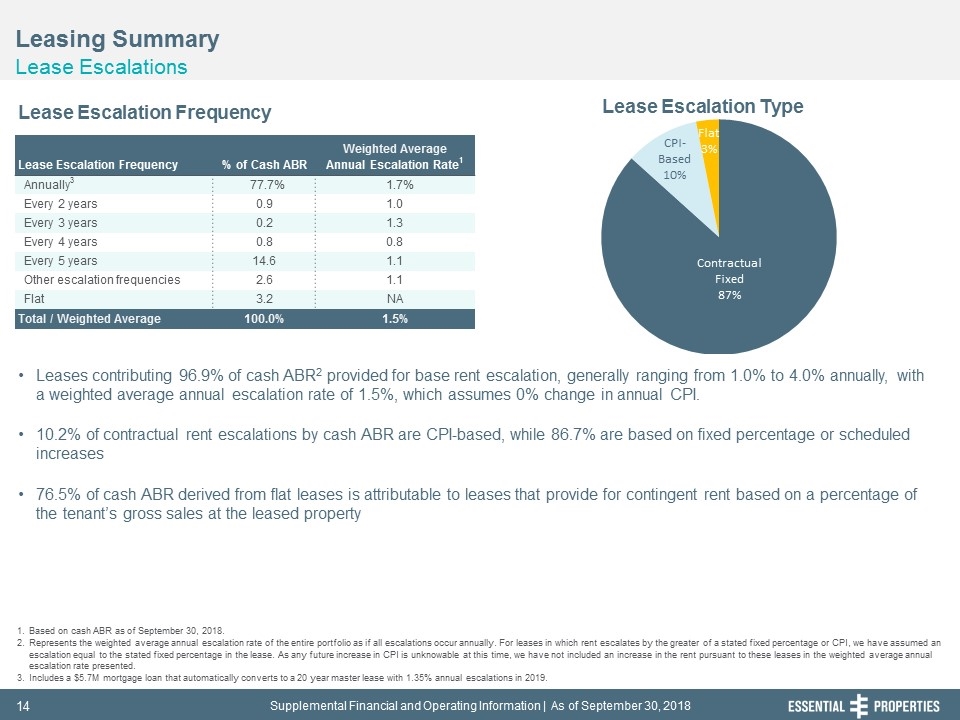
Leasing Summary Lease Escalations 242, 242, 242 Leases contributing 96.9% of cash ABR2 provided for base rent escalation, generally ranging from 1.0% to 4.0% annually, with a weighted average annual escalation rate of 1.5%, which assumes 0% change in annual CPI. 10.2% of contractual rent escalations by cash ABR are CPI-based, while 86.7% are based on fixed percentage or scheduled increases 76.5% of cash ABR derived from flat leases is attributable to leases that provide for contingent rent based on a percentage of the tenant’s gross sales at the leased property Based on cash ABR as of September 30, 2018. Represents the weighted average annual escalation rate of the entire portfolio as if all escalations occur annually. For leases in which rent escalates by the greater of a stated fixed percentage or CPI, we have assumed an escalation equal to the stated fixed percentage in the lease. As any future increase in CPI is unknowable at this time, we have not included an increase in the rent pursuant to these leases in the weighted average annual escalation rate presented. Includes a $5.7M mortgage loan that automatically converts to a 20 year master lease with 1.35% annual escalations in 2019. Lease Escalation Frequency Lease Escalation Type Weighted Average Lease Escalation Frequency % of Cash ABR Annual Escalation Rate1 Annually3 77.7% 1.7% Every 2 years 0.9 1.0 Every 3 years 0.2 1.3 Every 4 years 0.8 0.8 Every 5 years 14.6 1.1 Other escalation frequencies 2.6 1.1 Flat 3.2 NA Total / Weighted Average 100.0% 1.5%
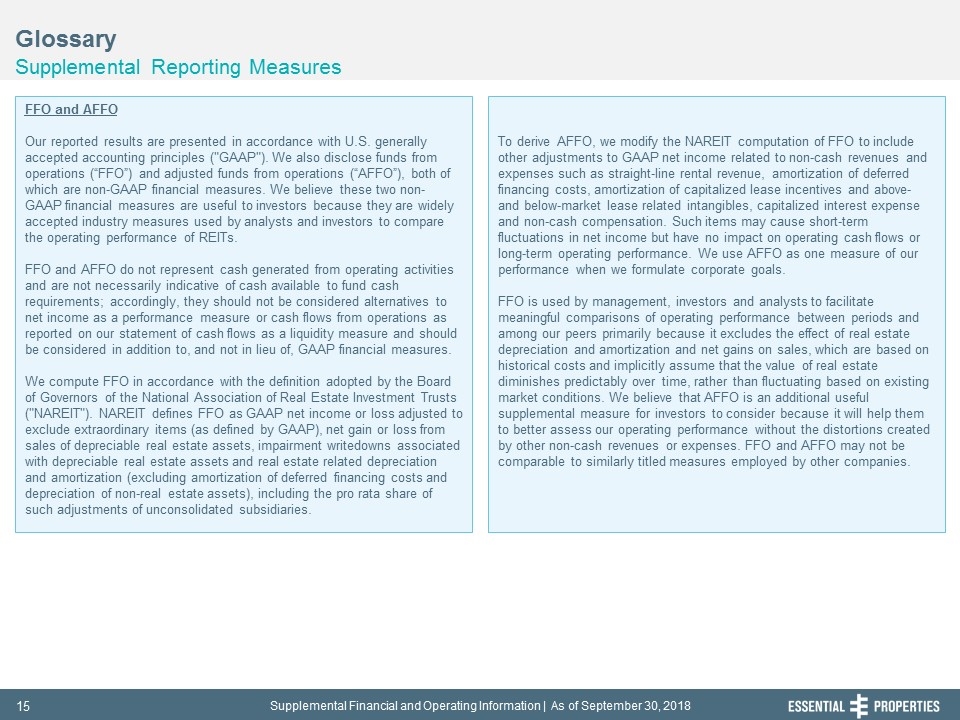
Glossary Supplemental Reporting Measures 242, 242, 242 FFO and AFFO Our reported results are presented in accordance with U.S. generally accepted accounting principles ("GAAP"). We also disclose funds from operations (“FFO”) and adjusted funds from operations (“AFFO”), both of which are non-GAAP financial measures. We believe these two non-GAAP financial measures are useful to investors because they are widely accepted industry measures used by analysts and investors to compare the operating performance of REITs. FFO and AFFO do not represent cash generated from operating activities and are not necessarily indicative of cash available to fund cash requirements; accordingly, they should not be considered alternatives to net income as a performance measure or cash flows from operations as reported on our statement of cash flows as a liquidity measure and should be considered in addition to, and not in lieu of, GAAP financial measures. We compute FFO in accordance with the definition adopted by the Board of Governors of the National Association of Real Estate Investment Trusts ("NAREIT"). NAREIT defines FFO as GAAP net income or loss adjusted to exclude extraordinary items (as defined by GAAP), net gain or loss from sales of depreciable real estate assets, impairment writedowns associated with depreciable real estate assets and real estate related depreciation and amortization (excluding amortization of deferred financing costs and depreciation of non-real estate assets), including the pro rata share of such adjustments of unconsolidated subsidiaries. To derive AFFO, we modify the NAREIT computation of FFO to include other adjustments to GAAP net income related to non-cash revenues and expenses such as straight-line rental revenue, amortization of deferred financing costs, amortization of capitalized lease incentives and above- and below-market lease related intangibles, capitalized interest expense and non-cash compensation. Such items may cause short-term fluctuations in net income but have no impact on operating cash flows or long-term operating performance. We use AFFO as one measure of our performance when we formulate corporate goals. FFO is used by management, investors and analysts to facilitate meaningful comparisons of operating performance between periods and among our peers primarily because it excludes the effect of real estate depreciation and amortization and net gains on sales, which are based on historical costs and implicitly assume that the value of real estate diminishes predictably over time, rather than fluctuating based on existing market conditions. We believe that AFFO is an additional useful supplemental measure for investors to consider because it will help them to better assess our operating performance without the distortions created by other non-cash revenues or expenses. FFO and AFFO may not be comparable to similarly titled measures employed by other companies.
Glossary Supplemental Reporting Measures 242, 242, 242 We also present our earnings before interest, taxes and depreciation and amortization for real estate (“EBITDA”), EBITDA further adjusted to exclude gains (or losses) on sales of depreciable property and real estate impairment losses (“EBITDAre”), net debt, net operating income (“NOI”) and cash NOI (“Cash NOI”), all of which are non-GAAP financial measures. We believe these measures are useful to investors in assessing our operating performance and borrowing levels. EBITDA and EBITDAre We calculate EBITDA as earnings (GAAP net income) before interest, income taxes, and depreciation and amortization. In 2017, NAREIT issued a white paper recommending that companies that report EBITDA also report EBITDAre in all financial reports for periods beginning after December 31, 2017. We compute EBITDAre in accordance with the definition adopted by NAREIT. NAREIT defines EBITDAre as EBITDA (as defined above) excluding gains (or losses) from the sales of depreciable property and real estate impairment losses. We present EBITDA and EBITDAre as they are measures commonly used in our industry and we believe that these measures are useful to investors and analysts because they provide important supplemental information concerning our operating performance exclusive of certain non-cash and other costs. EBITDA and EBITDAre are not measurements of financial performance under GAAP, and our EBITDA and EBITDAre may not be comparable to similarly titled measures of other companies. You should not consider our EBITDA and EBITDAre as alternatives to net income or cash flows from operating activities determined in accordance with GAAP. Net Debt Net debt represents our gross debt (defined as total debt plus deferred financing costs, net) less cash and cash equivalents and restricted cash deposits held for the benefit of lenders. We believe excluding cash and cash equivalents and restricted cash deposits held for the benefit of lenders from gross debt, both of which could be used to repay debt, provides an estimate of the net contractual amount of borrowed capital to be repaid, which we believe is a beneficial disclosure to investors and analysts. NOI and Cash NOI NOI and Cash NOI are non-GAAP financial measures used by us to evaluate the operating performance of our real estate. NOI is equal to total revenues less property expenses. NOI excludes all other items of expense and income included in the financial statements in calculating net income or loss. Cash NOI further excludes non-cash items included in total revenues and property expenses, such as straight-line rental revenue and amortization of capitalized lease incentives and above- and below-market lease-related intangibles. We believe NOI and Cash NOI provide useful and relevant information because they reflect only those income and expense items that are incurred at the property level and present such items on an unlevered basis. NOI and Cash NOI are not measurements of financial performance under GAAP, and our NOI and Cash NOI may not be comparable to similarly titled measures of other companies. You should not consider our NOI and Cash NOI as alternatives to net income or cash flows from operating activities determined in accordance with GAAP. Adjusted EBITDAre / Adjusted NOI / Adjusted Cash NOI We adjust EBITDAre, NOI and Cash NOI based on an estimate calculated as if all acquisition and disposition activity that took place during the current quarter had been made on the first day of the quarter. We then annualize these estimates for the current quarter by multiplying them by four, which we believe provides a meaningful estimate of our current run rate for all properties owned as of the end of the current quarter. You should not unduly rely on these metrics as they are based on assumptions and estimates that may prove to be inaccurate. Our actual reported EBITDAre, NOI and Cash NOI for future periods may be significantly less than these estimates of current run rates for a variety of reasons.
Glossary of Supplemental Reporting Measures Other Terms 242, 242, 242 Cash ABR Cash ABR means annualized contractually specified cash base rent in effect as of the end of the current quarter for all of our leases (including those accounted for as direct financing leases) commenced as of that date, as well as interest on our mortgage loans receivable. Rent Coverage Ratio Rent coverage ratio means the ratio of tenant-reported or, when unavailable, management’s estimate based on tenant-reported financial information, annual EBITDA and cash rent attributable to the leased property (or properties, in the case of a master lease) to the annualized base rental obligation as of a specified date. GE Seed Portfolio GE seed portfolio means our acquisition of a portfolio of 262 net leased properties on June 16, 2016, consisting primarily of restaurants, that were being sold as part of the liquidation of General Electric Capital Corporation for an aggregate purchase price of $279.8 million (including transaction costs).
