Attached files
| file | filename |
|---|---|
| 8-K - MERCADOLIBRE INC | mercado8k-1102.htm |
| EX-99.1 - MERCADOLIBRE INC | earnings-call.htm |

INVESTOR PRESENTATION Third Quarter 2018 Results November 01, 2018
This presentation may make forward - looking statements relating to such matters as continued growth prospects for the company, industry trends and product and technology initiatives . These statements are based on currently available information and our current assumptions, expectations and projections about future events . While we believe that our assumptions, expectations and projections are reasonable in view of currently available information, you are cautioned not to place undue reliance on these forward - looking statements . Our actual results may differ materially from those included in this presentation, for a variety of reasons, including those described in the forward - looking statements and risk factor sections of our 10 - Q and other filings with the Securities and Exchange Commission, which are available on our investor relations website . (http : //investor . mercadolibre . com) A reconciliation of Non - GAAP measures to the nearest comparable GAAP measures can be found in our third quarter 2018 earnings press release available on our investor relations website . All of the information included in this presentation is updated as of September 30 th, 2018 . Except as may be required by applicable law, we assume no obligation to publicly update or revise our statements . Percentages have been calculated using whole amounts rather than rounded amounts . This may cause some figures not to total due to rounding . Safe Harbor
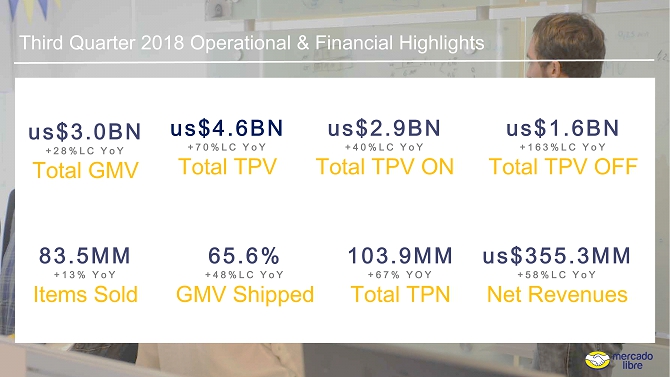
Third Quarter 2018 Operational & Financial Highlights us$3.0BN +28%LC YoY Total GMV us$4.6BN +70%LC YoY Total TPV 65.6% + 48%LC YoY GMV Shipped us$2.9BN +40%LC YoY Total TPV ON us$1.6BN +163%LC YoY Total TPV OFF 103.9MM +67% YOY Total TPN 83.5MM + 13% YoY Items Sold us$355.3MM +58%LC YoY Net Revenues

Third Quarter 2018 Overview 1. Quarterly Highlights 2. KPIs 3. Financial Metrics 4. Margin Structures
Third Quarter 2018 Overview 1. Quarterly Highlights 2. KPIs 3. Financial Metrics 4. Margin Structures

Financial Results • Gross Billings came in at $ 462 . 8 million dollars, growing 24 . 9 % YoY in USD and 48 . 1 % YoY on an FX Neutral basis, marking 18 th consecutive quarter of FX Neutral gross billings growth above 45 % YoY . • Gross billings was solid across main countries on an FX Neutral basis YoY : Brazil 68 . 6 % , Argentina 82 . 6 % , Mexico 83 . 7 % • In addition to the solid growth in Gross Billings, increased efficiencies in shipping subsidies also drove strong net revenue growth on an FX Neutral basis . Consolidated net revenues came in at $ 355 . 3 million dollars, accelerating on an FX Neutral basis 14 pp to 58 . 3 % YoY . • On a by country basis, net revenue growth was also strong in main countries YoY : Brazil 56 . 4 % , Argentina 67 . 8 % , Mexico 168 . 2 % • Gross Profit ascended to $ 169 . 7 million dollars, representing 47 . 8 % of revenues vs . 57 . 7 % LY . Most of the year on year margin compression is explained by hosting fees, mPos write - offs, & warehousing costs . • As reported operating expenses totaled $ 180 . 7 million dollars, or 50 . 9 % of revenues vs . 48 . 6 % LY . The YoY contraction is attributed to buyer protection payouts, increased loan loss provisions on our credit portfolio, and incremental marketing costs . • From a bottom line perspective operating losses showed a 61 . 0 % reduction versus last quarter to $ 11 . 0 million dollars or negative 3 . 1 % of revenues against negative $ 28 . 2 million in 2 Q . Additionally we have delivered positive EBITDA as we continue to optimize our financial model . • Consequently, net loss as reported for the third quarter was also lower versus last quarter, ascending to $ 10 . 1 million, resulting in basic net loss per share of $ 0 . 23 cents . Third Quarter 2018 Quarterly Highlights
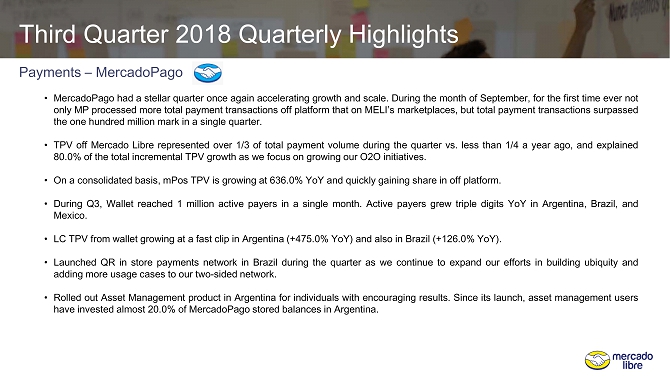
Payments – MercadoPago • MercadoPago had a stellar quarter once again accelerating growth and scale . During the month of September, for the first time ever not only MP processed more total payment transactions off platform that on MELI’s marketplaces, but total payment transactions surpassed the one hundred million mark in a single quarter . • TPV off Mercado Libre represented over 1 / 3 of total payment volume during the quarter vs . less than 1 / 4 a year ago, and explained 80 . 0 % of the total incremental TPV growth as we focus on growing our O 2 O initiatives . • On a consolidated basis, mPos TPV is growing at 636 . 0 % YoY and quickly gaining share in off platform . • During Q 3 , Wallet reached 1 million active payers in a single month . Active payers grew triple digits YoY in Argentina, Brazil, and Mexico . • LC TPV from wallet growing at a fast clip in Argentina (+ 475 . 0 % YoY) and also in Brazil (+ 126 . 0 % YoY) . • Launched QR in store payments network in Brazil during the quarter as we continue to expand our efforts in building ubiquity and adding more usage cases to our two - sided network . • Rolled out Asset Management product in Argentina for individuals with encouraging results . Since its launch, asset management users have invested almost 20 . 0 % of MercadoPago stored balances in Argentina . Third Quarter 2018 Quarterly Highlights
Marketplace • Marketplace business continues to show great resiliency in spite of increasingly difficult comps . On a consolidated basis FX Neutral GMV grew 27 . 9 % YoY, while if we exclude Venezuela from last year FX Neutral GMV grew at a solid 37 . 7 % YoY . • Mexico is consolidating as an engine of growth for the business, delivering 7 and 5 consecutive quarters of items growth and FX Neutral GMV above 65 . 0 % YoY respectively . Additionally, since early 2017 the size of the business has grown by a factor of 2 . 5 x as we leverage our depth and breath of selection, fast and free shipping value proposition and aggressive customer acquisition investments . • Brazil sustained 12 consecutive quarters of GMV growth above 30 . 0 % YoY in Brazil on an FX Neutral basis despite tougher two - year stack comparisons, shipping subsidy reductions and the launch of R $ 5 flat fee in July for items below R $ 120 free shipping threshold . • As a result of launching R $ 5 flat fee rollout in July for items below R $ 120 and removal of all listings under R $ 6 , successful items growth in Brazil decelerated to 1 . 5 % YoY . However, ASP in Brazil growing sequentially & YoY as we shift incentives and subsidies to purchase higher ticket items, and improve monetization and overall unit economics . • Despite challenging macro and currency trends during the quarter, Argentina maintained momentum both in successful items and FX Neutral GMV growing 49 . 4 % YoY and 48 . 9 % respectively as our free shipping program continues to gain traction and reached almost 50 . 0 % of sales . Third Quarter 2018 Quarterly Highlights
Logistics - MercadoEnvíos • The adoption of our proprietary logistics network is making strides with over 15 % of the shipments through MercadoEnvios was sent through it during the quarter . • Shortened lead times by almost 20 % on a consolidated basis over the last year . Brazil is the geography where we observed the greatest improvement as we shortened lead times by 1 . 9 days versus last year . • Improving lead times in Mexico and Argentina as well, by approximately 0 . 5 days in both countries . • On our dropship network we have seen important advances during the quarter as we launched our MELI Flex solution in Argentina . This application will allow our sellers to leverage our technology and use their existing logistics relationships to deliver goods within hours in large metropolitan areas through our MercadoEnvíos proprietary logistics network . • During the quarter, on a consolidated basis ~ 40 . 0 % of items sold were being delivered in 48 hours or less . Mexico leads the way with almost 80 . 0 % of the volume being delivered in two days or less, while Argentina and Brazil continued to improve their share of shipments in that time window . Third Quarter 2018 Quarterly Highlights
Third Quarter 2018 Overview 1. Quarterly Highlights 2. KPIs 3. Financial Metrics 4. Margin Structures
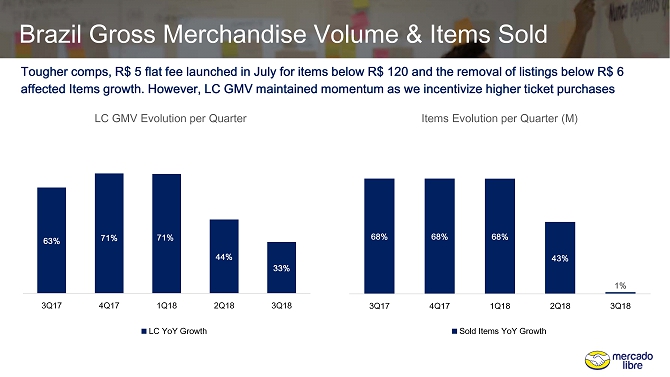
Brazil Gross Merchandise Volume & Items Sold Tougher comps, R$ 5 flat fee launched in July for items below R$ 120 and the removal of listings below R$ 6 affected Items growth. However, LC GMV maintained momentum as we incentivize higher ticket purchases LC GMV Evolution per Quarter Items Evolution per Quarter (M) 63% 71% 71% 44% 33% 0 0.1 0.2 0.3 0.4 0.5 0.6 0.7 0.8 0.9 1 3Q17 4Q17 1Q18 2Q18 3Q18 LC YoY Growth 68% 68% 68% 43% 1% 0 0.1 0.2 0.3 0.4 0.5 0.6 0.7 0.8 0.9 1 3Q17 4Q17 1Q18 2Q18 3Q18 Sold Items YoY Growth
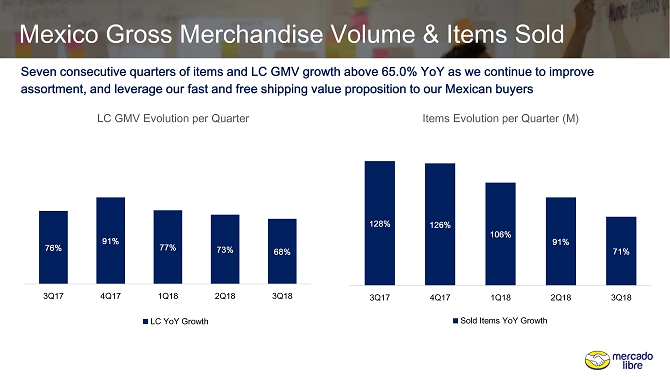
Seven consecutive quarters of items and LC GMV growth above 65.0% YoY as we continue to improve assortment, and leverage our fast and free shipping value proposition to our Mexican buyers LC GMV Evolution per Quarter Items Evolution per Quarter (M) 76% 91% 77% 73% 68% -0.1 0.1 0.3 0.5 0.7 0.9 1.1 1.3 1.5 3Q17 4Q17 1Q18 2Q18 3Q18 LC YoY Growth 128% 126% 106% 91% 71% -0.1 0.1 0.3 0.5 0.7 0.9 1.1 1.3 1.5 3Q17 4Q17 1Q18 2Q18 3Q18 Sold Items YoY Growth Mexico Gross Merchandise Volume & Items Sold
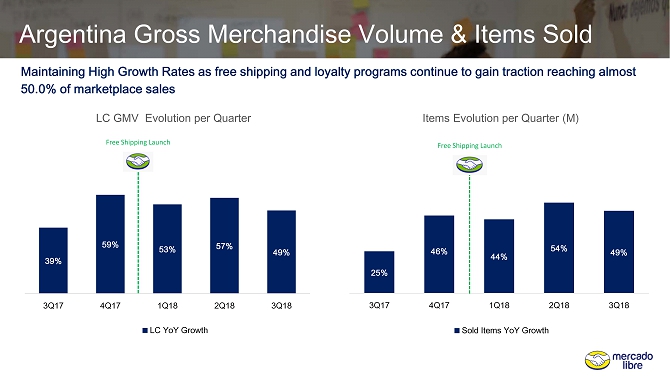
LC GMV Evolution per Quarter Items Evolution per Quarter (M) 39% 59% 53% 57% 49% 0 0.1 0.2 0.3 0.4 0.5 0.6 0.7 0.8 0.9 1 3Q17 4Q17 1Q18 2Q18 3Q18 LC YoY Growth Free Shipping Launch 25% 46% 44% 54% 49% 0 0.1 0.2 0.3 0.4 0.5 0.6 0.7 0.8 0.9 1 3Q17 4Q17 1Q18 2Q18 3Q18 Sold Items YoY Growth Free Shipping Launch Argentina Gross Merchandise Volume & Items Sold Maintaining High Growth Rates as free shipping and loyalty programs continue to gain traction reaching almost 50.0% of marketplace sales
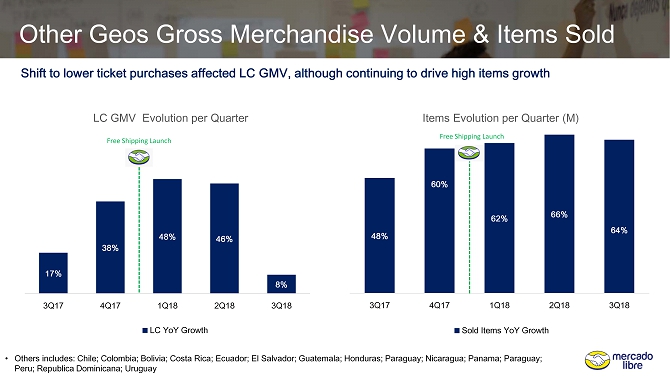
Shift to lower ticket purchases affected LC GMV, although continuing to drive high items growth LC GMV Evolution per Quarter Items Evolution per Quarter (M) • Others includes : Chile ; Colombia; Bolivia; Costa Rica; Ecuador; El Salvador; Guatemala; Honduras; Paraguay; Nicaragua; Panama; Paraguay; Peru; Republica Dominicana ; Uruguay 17% 38% 48% 46% 8% 0% 10% 20% 30% 40% 50% 60% 70% 3Q17 4Q17 1Q18 2Q18 3Q18 LC YoY Growth Free Shipping Launch 48% 60% 62% 66% 64% 0% 10% 20% 30% 40% 50% 60% 70% 3Q17 4Q17 1Q18 2Q18 3Q18 Sold Items YoY Growth Free Shipping Launch Other Geos Gross Merchandise Volume & Items Sold
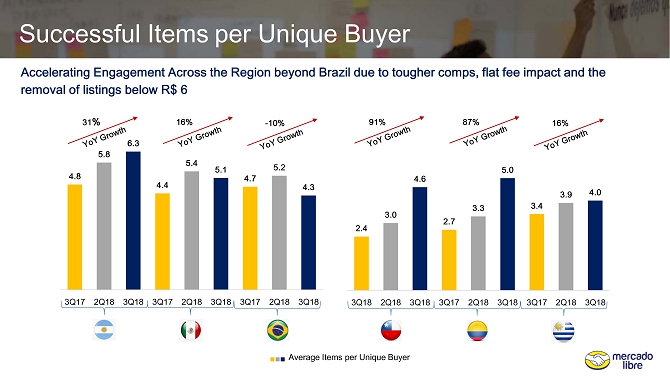
Successful Items per Unique Buyer Accelerating Engagement Across the Region beyond Brazil due to t ougher comps, flat fee impact and the removal of listings below R$ 6 4.8 5.8 6.3 4.4 5.4 5.1 4.7 5.2 4.3 0 1 2 3 4 5 6 7 3Q17 2Q18 3Q18 3Q17 2Q18 3Q18 3Q17 2Q18 3Q18 31 % - 10% 16% 2.4 3.0 4.6 2.7 3.3 5.0 3.4 3.9 4.0 0 1 2 3 4 5 6 7 3Q18 2Q18 3Q18 3Q17 2Q18 3Q18 3Q17 2Q18 3Q18 91% 16% 87% Average Items per Unique Buyer
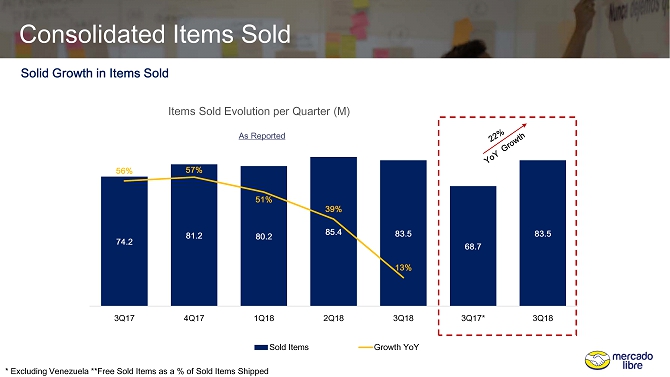
Consolidated Items Sold Solid Growth in Items Sold * Excluding Venezuela **Free Sold Items as a % of Sold Items Shipped Items Sold Evolution per Quarter (M) 74.2 81.2 80.2 85.4 83.5 68.7 83.5 56% 57% 51% 39% 13% 0.00 0.10 0.20 0.30 0.40 0.50 0.60 0.70 0.0 10.0 20.0 30.0 40.0 50.0 60.0 70.0 80.0 90.0 3Q17 4Q17 1Q18 2Q18 3Q18 3Q17* 3Q18 Sold Items Growth YoY As Reported
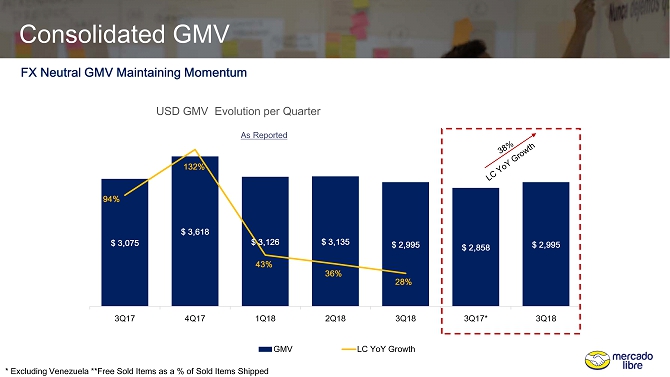
Consolidated GMV FX Neutral GMV Maintaining Momentum * Excluding Venezuela **Free Sold Items as a % of Sold Items Shipped USD GMV Evolution per Quarter $ 3,075 $ 3,618 $ 3,126 $ 3,135 $ 2,995 $ 2,858 $ 2,995 94% 132% 43% 36% 28% 0 0.2 0.4 0.6 0.8 1 1.2 1.4 0 500 1000 1500 2000 2500 3000 3500 4000 3Q17 4Q17 1Q18 2Q18 3Q18 3Q17* 3Q18 GMV LC YoY Growth As Reported
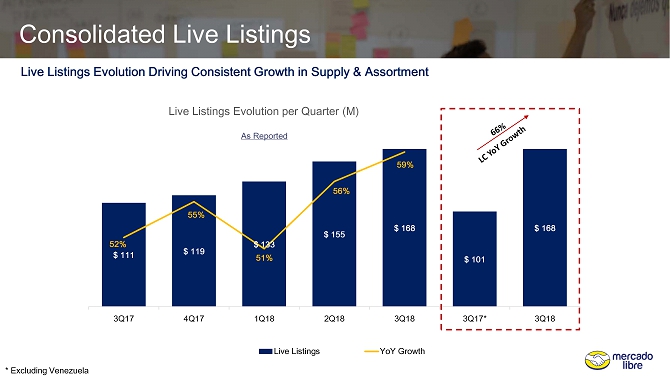
Consolidated Live Listings Live Listings Evolution Driving Consistent Growth in Supply & Assortment * Excluding Venezuela Live Listings Evolution per Quarter (M) $ 111 $ 119 $ 133 $ 155 $ 168 $ 101 $ 168 52% 55% 51% 56% 59% 0.46 0.48 0.5 0.52 0.54 0.56 0.58 0.6 0 20 40 60 80 100 120 140 160 180 3Q17 4Q17 1Q18 2Q18 3Q18 3Q17* 3Q18 Live Listings YoY Growth As Reported

MercadoPago On Marketplace Payments growth affected by tougher comps, OFF Platform Payments TPV growing at triple digits reaching a multi - year high of 160 % YoY growth Consolidated TPV ON Consolidated TPV OFF 82% 85% 62% 49% 40% 83% 81% 89% 89% 91% 0 0.1 0.2 0.3 0.4 0.5 0.6 0.7 0.8 0.9 1 0 0.1 0.2 0.3 0.4 0.5 0.6 0.7 0.8 0.9 1 3Q17 4Q17 1Q18 2Q18 3Q18 LC YoY Growth MP ON Marketplace Penetration 108% 128% 127% 142% 163% 24% 26% 27% 32% 36% 0 0.1 0.2 0.3 0.4 0.5 0.6 0.7 0.8 0.9 1 0 0.2 0.4 0.6 0.8 1 1.2 1.4 1.6 1.8 3Q17 4Q17 1Q18 2Q18 3Q18 LC YoY Growth TPV OFF Penetration* *TPV OFF as a % of Total TPV

MercadoCredito Record credits originations, credit portfolio in USD affected by Argentina FX headwinds Merchant & Consumer Credits Portfolio *TPV OFF as a % of Total TPV Merchant Credits Originations $52 $73 $122 $112 $91 0 20 40 60 80 100 120 3Q17 4Q17 1Q18 2Q18 3Q18 Loans Receivable 12 7 11 12 24 0.0 5.0 10.0 15.0 20.0 25.0 3Q17 4Q17 1Q18 2Q18 3Q18 # Credits (M)
Third Quarter 2018 Overview 1. Quarterly Highights 2. KPIs 3. Financial Metrics 4. Margin Structures

FASB ASC 606 Pro Forma *As Recast **As Reported
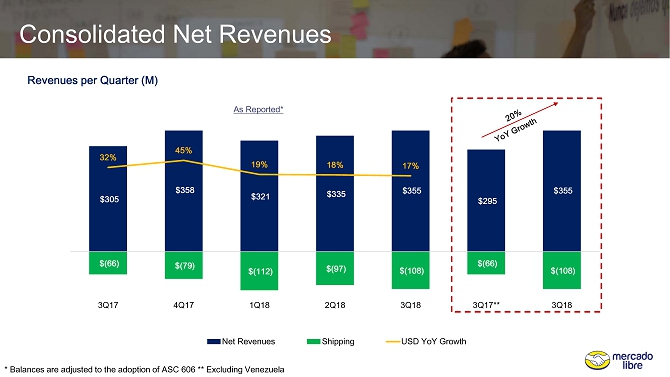
Consolidated Net Revenues $305 $358 $321 $335 $355 $295 $355 $(66) $(79) $(112) $(97) $(108) $(66) $(108) 32% 45% 19% 18% 17% -200.0% -100.0% 0.0% 100.0% -120 -70 -20 30 80 130 180 230 280 330 3Q17 4Q17 1Q18 2Q18 3Q18 3Q17** 3Q18 Net Revenues Shipping USD YoY Growth Revenues per Quarter (M) * Balances are adjusted to the adoption of ASC 606 ** Excluding Venezuela As Reported *
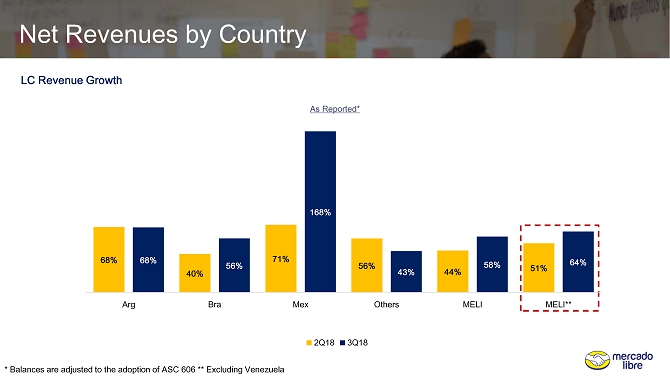
Net Revenues by Country LC Revenue Growth * Balances are adjusted to the adoption of ASC 606 ** Excluding Venezuela 68% 40% 71% 56% 44% 51% 68% 56% 168% 43% 58% 64% 0 0.2 0.4 0.6 0.8 1 1.2 1.4 1.6 1.8 Arg Bra Mex Others MELI MELI** 2Q18 3Q18 As Reported *
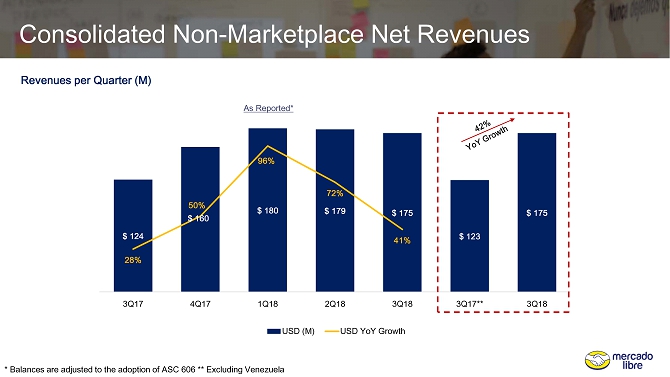
Consolidated Non - Marketplace Net Revenues Revenues per Quarter (M) * Balances are adjusted to the adoption of ASC 606 ** Excluding Venezuela $ 124 $ 160 $ 180 $ 179 $ 175 $ 123 $ 175 28% 50% 96% 72% 41% 0 0.2 0.4 0.6 0.8 1 1.2 0 20 40 60 80 100 120 140 160 180 200 3Q17 4Q17 1Q18 2Q18 3Q18 3Q17** 3Q18 USD (M) USD YoY Growth As Reported *
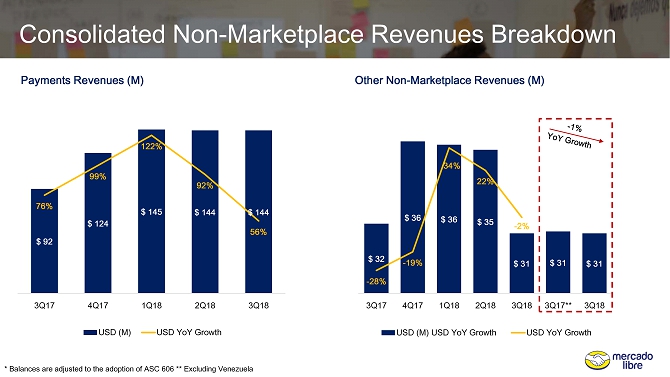
Consolidated Non - Marketplace Revenues Breakdown Payments Revenues (M) * Balances are adjusted to the adoption of ASC 606 ** Excluding Venezuela Other Non - Marketplace Revenues (M) $ 32 $ 36 $ 36 $ 35 $ 31 $ 31 $ 31 - 28% - 19% 34% 22% - 2% -0.4 -0.3 -0.2 -0.1 0 0.1 0.2 0.3 0.4 0.5 28 29 30 31 32 33 34 35 36 37 3Q17 4Q17 1Q18 2Q18 3Q18 3Q17** 3Q18 USD (M) USD YoY Growth USD YoY Growth $ 92 $ 124 $ 145 $ 144 $ 144 76% 99% 122% 92% 56% 0 0.2 0.4 0.6 0.8 1 1.2 1.4 0 20 40 60 80 100 120 140 160 3Q17 4Q17 1Q18 2Q18 3Q18 USD (M) USD YoY Growth
Third Quarter 2018 Overview 1. Quarterly Highlights 2. KPIs 3. Financial Metrics 4. Margin Structures
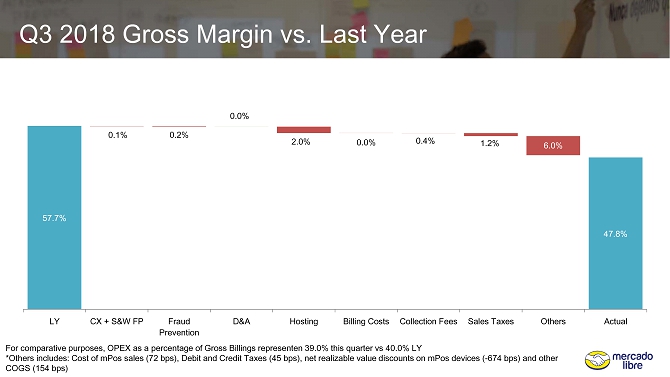
Q3 2018 Gross Margin vs. Last Year For comparative purposes , OPEX as a percentage of Gross Billings representen 39.0% this quarter vs 40.0% LY * Others includes : Cost of mPos sales (72 bps), Debit and Credit Taxes (45 bps), net realizable value discounts on mPos devices ( - 674 bps) and other COGS (154 bps) 57.7% 47.8% 0.1% 0.2% 2.0% 0.0% 0.4% 1.2% 6.0% 0.0% LY CX + S&W FP Fraud Prevention D&A Hosting Billing Costs Collection Fees Sales Taxes Others Actual

Q3 2018 EBIT Margin vs. Last Year 9.0% - 3.1% 9.9 % 1.0% 2.7 % 1.5 % 0.0% 0.4 % 1.1 % 0.3% 2.0 % LY COGS Marketing BPP Bad Debt Chargebacks Other S&M PD G&A S&W Actual 2,8%
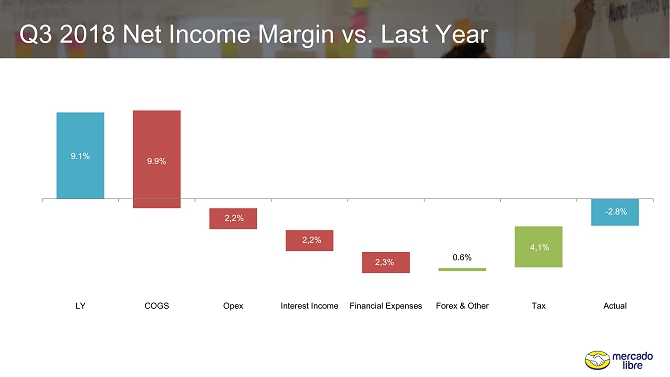
Q3 2018 Net Income Margin vs. Last Year 9.1% - 2.8% 2,2% 2,2% 2,3% 9.9% 0.6% 4,1% LY COGS Opex Interest Income Financial Expenses Forex & Other Tax Actual
INVESTOR PRESENTATION Third Quarter 2018 Results Th ank You