Attached files
| file | filename |
|---|---|
| EX-32.2 - EXHIBIT 32.2 - PUGET ENERGY INC /WA | pe-ex322_20180930xq3.htm |
| EX-32.1 - EXHIBIT 32.1 - PUGET ENERGY INC /WA | pe-ex321_20180930xq3.htm |
| EX-31.4 - EXHIBIT 31.4 - PUGET ENERGY INC /WA | pe-ex314_20180930xq3.htm |
| EX-31.3 - EXHIBIT 31.3 - PUGET ENERGY INC /WA | pe-ex313_20180930xq3.htm |
| EX-31.2 - EXHIBIT 31.2 - PUGET ENERGY INC /WA | pe-ex312_20180930xq3.htm |
| EX-31.1 - EXHIBIT 31.1 - PUGET ENERGY INC /WA | pe-ex311_20180930xq3.htm |
| EX-12.2 - EXHIBIT 12.2 - PUGET ENERGY INC /WA | pe-ex122_20180930xq3.htm |
| EX-12.1 - EXHIBIT 12.1 - PUGET ENERGY INC /WA | pe-ex121_20180930xq3.htm |
UNITED STATES
SECURITIES AND EXCHANGE COMMISSION
Washington, D.C. 20549
FORM 10-Q
[X] | QUARTERLY REPORT PURSUANT TO SECTION 13 OR 15(d) OF THE SECURITIES EXCHANGE ACT OF 1934 |
For the quarterly period ended September 30, 2018
OR
[ ] | TRANSITION REPORT PURSUANT TO SECTION 13 OR 15(d) OF THE SECURITIES EXCHANGE ACT OF 1934 |
For the Transition period from ________ to ________
Commission File Number | Exact name of registrant as specified in its charter, state of incorporation, address of principal executive offices, telephone number | I.R.S. Employer Identification Number |

1-16305 | PUGET ENERGY, INC. A Washington Corporation 355 110th Ave NE Bellevue, Washington 98004 (425) 454-6363 | 91-1969407 |

1-4393 | PUGET SOUND ENERGY, INC. A Washington Corporation 355 110th Ave NE Bellevue, Washington 98004 (425) 454-6363 | 91-0374630 |
Indicate by check mark whether the registrants: (1) have filed all reports required to be filed by Section 13 or 15(d) of the Securities Exchange Act of 1934 during the preceding 12 months (or for such shorter period that the registrant was required to file such reports), and (2) have been subject to such filing requirements for the past 90 days.
Puget Energy, Inc. | Yes | /X/ | No | / / | Puget Sound Energy, Inc. | Yes | /X/ | No | / / | |
Indicate by check mark whether the registrants have submitted electronically every Interactive Data File required to be submitted pursuant to Rule 405 of Regulation S-T (232.405 of this chapter) during the preceding 12 months (or for such shorter period that the registrant was required to submit and post such files).
Puget Energy, Inc. | Yes | /X/ | No | / / | Puget Sound Energy, Inc. | Yes | /X/ | No | / / | |
Indicate by check mark whether registrant is a large accelerated filer, an accelerated filer, a non-accelerated filer, a smaller reporting company or an emerging growth company. See the definitions of “large accelerated filer", "accelerated filer," a smaller reporting company,” and "emerging growth company" in Rule 12b-2 of the Exchange Act.
Puget Energy, Inc. | Large accelerated filer | / / | Accelerated filer | / / | Non-accelerated filer | /X/ | Smaller reporting company | / / | Emerging growth company | / / |
Puget Sound Energy, Inc. | Large accelerated filer | / / | Accelerated filer | / / | Non-accelerated filer | /X/ | Smaller reporting company | / / | Emerging growth company | / / |
If an emerging growth company, indicate by check mark if the registrant has elected not to use the extended transition period for complying with any new or revised financial accounting standards provided pursuant to Section 13(a) of the Exchange Act. / /
Indicate by check mark whether the registrant is a shell company (as defined in Rule 12b-2 of the Exchange Act).
Puget Energy, Inc. | Yes | / / | No | /X/ | Puget Sound Energy, Inc. | Yes | / / | No | /X/ | |
All of the outstanding shares of voting stock of Puget Energy, Inc. are held by Puget Equico LLC, an indirect wholly-owned subsidiary of Puget Holdings LLC. All of the outstanding shares of voting stock of Puget Sound Energy, Inc. are held by Puget Energy, Inc.
Table of Contents
Page | ||
Puget Energy, Inc. | ||
Puget Sound Energy, Inc. | ||
Notes | ||
2
DEFINITIONS
ARO | Asset Retirement and Environmental Obligations |
ASU | Accounting Standards Update |
ASC | Accounting Standards Codification |
EBITDA | Earnings Before Interest, Tax, Depreciation and Amortization |
EIM | Energy Imbalance Market |
ERF | Expedited Rate Filing |
FASB | Financial Accounting Standards Board |
GAAP | U.S. Generally Accepted Accounting Principles |
GRC | General Rate Case |
ISDA | International Swaps and Derivatives Association |
LIBOR | London Interbank Offered Rate |
LNG | Liquefied Natural Gas |
MMBtu | One Million British Thermal Units |
MWh | Megawatt Hour (one MWh equals one thousand kWh) |
NAESB | North American Energy Standards Board |
NPNS | Normal Purchase Normal Sale |
PCA | Power Cost Adjustment |
PCORC | Power Cost Only Rate Case |
PGA | Purchased Gas Adjustment |
PTC | Production Tax Credit |
PSE | Puget Sound Energy, Inc. |
Puget Energy | Puget Energy, Inc. |
Puget Holdings | Puget Holdings, LLC |
Puget LNG | Puget Liquid Natural Gas, LLC |
REP | Residential Exchange Program |
SERP | Supplemental Executive Retirement Plan |
TCJA | Tax Cuts and Jobs Act |
Washington Commission | Washington Utilities and Transportation Commission |
WSPP | WSPP, Inc. |
3
FILING FORMAT
This report on Form 10-Q is a Quarterly Report filed separately by two registrants, Puget Energy, Inc. (Puget Energy) and Puget Sound Energy, Inc. (PSE). Any references in this report to “the Company” are to Puget Energy and PSE collectively.
FORWARD-LOOKING STATEMENTS
Puget Energy and PSE include the following cautionary statements in this Form 10-Q to make applicable and to take advantage of the safe harbor provisions of the Private Securities Litigation Reform Act of 1995 for any forward-looking statements made by or on behalf of Puget Energy or PSE. This report includes forward-looking statements, which are statements of expectations, beliefs, plans, objectives and assumptions of future events or performance. Words or phrases such as “anticipates,” “believes,” “continues,” “could,” “estimates,” “expects,” “future,” “intends,” “may,” “might,” “plans,” “potential,” “predicts,” “projects,” “should,” “will likely result,” “will continue” or similar expressions are intended to identify certain of these forward-looking statements and may be included in discussion of, among other things, our anticipated operating or financial performance, business plans and prospects, planned capital expenditures and other future expectations. In particular, these include statements relating to future actions, business plans and prospects, future performance expenses, the outcome of contingencies, such as legal proceedings, government regulation and financial results.
Forward-looking statements reflect current expectations and involve risks and uncertainties that could cause actual results or outcomes to differ materially from those expressed. There can be no assurance that Puget Energy’s and PSE’s expectations, beliefs or projections will be achieved or accomplished.
In addition to other factors and matters discussed elsewhere in this report, some important risks that could cause actual results or outcomes for Puget Energy and PSE to differ materially from past results and those discussed in the forward-looking statements include:
● | Governmental policies and regulatory actions, including those of the Federal Energy Regulatory Commission (FERC) and the Washington Utilities and Transportation Commission (Washington Commission), that may affect our ability to recover costs and earn a reasonable return, including but not limited to disallowance or delays in the recovery of capital investments and operating costs and discretion over allowed return on investment; |
● | Changes in, adoption of and compliance with laws and regulations, including decisions and policies concerning the environment, climate change, greenhouse gas or other emissions or by products of electric generation (including coal ash or other substances), natural resources, and fish and wildlife (including the Endangered Species Act) as well as the risk of litigation arising from such matters, whether involving public or private claimants or regulatory investigative or enforcement measures; |
● | Changes in tax law, related regulations or differing interpretation, including as a result of the TCJA, or enforcement of applicable law by the Internal Revenue Service (IRS) or other taxing jurisdiction; and PSE's ability to recover costs in a timely manner arising from such changes; |
● | Inability to realize deferred tax assets and use production tax credits (PTCs) due to insufficient future taxable income; |
● | Accidents or natural disasters, such as hurricanes, windstorms, earthquakes, floods, fires and landslides, and other acts of God, terrorism, asset-based or cyber-based attacks, pandemic or similar significant events, which can interrupt service and lead to lost revenue, cause temporary supply disruptions and/or price spikes in the cost of fuel and raw materials and impose extraordinary costs; |
● | Commodity price risks associated with procuring natural gas and power in wholesale markets from creditworthy counterparties; |
● | Wholesale market disruption, which may result in a deterioration of market liquidity, increase the risk of counterparty default, affect the regulatory and legislative process in unpredictable ways, negatively affect wholesale energy prices and/or impede PSE's ability to manage its energy portfolio risks and procure energy supply, affect the availability and access to capital and credit markets and/or impact delivery of energy to PSE from its suppliers; |
● | Financial difficulties of other energy companies and related events, which may affect the regulatory and legislative process in unpredictable ways, adversely affect the availability of and access to capital and credit markets and/or impact delivery of energy to PSE from its suppliers; |
● | The effect of wholesale market structures (including, but not limited to, regional market designs or transmission organizations) or other related federal initiatives; |
● | PSE electric or natural gas distribution system failure, blackouts or large curtailments of transmission systems (whether PSE's or others'), or failure of the interstate natural gas pipeline delivering to PSE's system, all of which can affect PSE's ability to deliver power or natural gas to its customers and generating facilities; |
● | Electric plant generation and transmission system outages, which can have an adverse impact on PSE's expenses with respect to repair costs, added costs to replace energy or higher costs associated with dispatching a more expensive generation resource; |
● | The ability to restart generation following a regional transmission disruption; |
● | The ability of a natural gas or electric plant to operate as intended; |
● | Changes in climate or weather conditions in the Pacific Northwest, which could have effects on customer usage and PSE's revenue and expenses; |
● | Regional or national weather, which could impact PSE's ability to procure adequate supplies of natural gas, fuel or purchased power to serve its customers and the cost of procuring such supplies; |
● | Variable hydrological conditions, which can impact streamflow and PSE's ability to generate electricity from hydroelectric facilities; |
● | Variable wind conditions, which can impact PSE's ability to generate electricity from wind facilities; |
● | The ability to renew contracts for electric and natural gas supply and the price of renewal; |
● | Industrial, commercial and residential growth and demographic patterns in the service territories of PSE; |
● | General economic conditions in the Pacific Northwest, which may impact customer consumption or affect PSE's accounts receivable; |
● | The loss of significant customers, changes in the business of significant customers or the condemnation of PSE's facilities as a result of municipalization or other government action or negotiated settlement, which may result in changes in demand for PSE's services; |
● | The failure of information systems or the failure to secure information system data, which may impact the operations and cost of PSE's customer service, generation, distribution and transmission; |
● | Opposition and social activism that may hinder PSE's ability to perform work or construct infrastructure; |
● | Capital market conditions, including changes in the availability of capital and interest rate fluctuations; |
● | Employee workforce factors, including strikes, work stoppages, availability of qualified employees or the loss of a key executive; |
● | The ability to obtain insurance coverage, the availability of insurance for certain specific losses, and the cost of such insurance; |
● | The ability to maintain effective internal controls over financial reporting and operational processes; |
● | Changes in Puget Energy's or PSE's credit ratings, which may have an adverse impact on the availability and cost of capital for Puget Energy or PSE generally; and |
● | Deteriorating values of the equity, fixed income and other markets which could significantly impact the value of investments of PSE's retirement plan, post-retirement medical benefit plan trusts and the funding of obligations thereunder. |
Any forward-looking statement speaks only as of the date on which such statement is made, and, except as required by law, the Company undertakes no obligation to update any forward-looking statement to reflect events or circumstances after the date on which such statement is made or to reflect the occurrence of unanticipated events. New factors emerge from time to time and it is not possible for management to predict all such factors, nor can it assess the impact of any such factor on the business or the extent to which any factor, or combination of factors, may cause results to differ materially from those contained in any forward-looking statement. For further information, see Item 1A, “Risk Factors” in the Company's most recent Annual Report on Form 10-K for the year ended December 31, 2017.
4
PART I FINANCIAL INFORMATION
Item 1. Financial Statements
PUGET ENERGY, INC.
CONSOLIDATED STATEMENTS OF INCOME
(Dollars in Thousands)
(Unaudited)
Three Months Ended September 30, | Nine Months Ended September 30, | ||||||||||||||
2018 | 2017 | 2018 | 2017 | ||||||||||||
Operating revenue: | |||||||||||||||
Electric | $ | 534,569 | $ | 537,543 | $ | 1,735,765 | $ | 1,736,335 | |||||||
Natural gas | 106,826 | 111,516 | 597,306 | 691,685 | |||||||||||
Other | 10,069 | 11,318 | 28,253 | 29,356 | |||||||||||
Total operating revenue | 651,464 | 660,377 | 2,361,324 | 2,457,376 | |||||||||||
Operating expenses: | |||||||||||||||
Energy costs: | |||||||||||||||
Purchased electricity | 148,536 | 115,881 | 431,856 | 425,263 | |||||||||||
Electric generation fuel | 71,004 | 66,584 | 143,177 | 152,057 | |||||||||||
Residential exchange | (15,401 | ) | (14,246 | ) | (55,436 | ) | (52,814 | ) | |||||||
Purchased natural gas | 30,192 | 32,224 | 211,679 | 248,208 | |||||||||||
Unrealized (gain) loss on derivative instruments, net | (14,046 | ) | (23 | ) | (21,953 | ) | 23,098 | ||||||||
Utility operations and maintenance | 139,361 | 141,003 | 440,016 | 438,622 | |||||||||||
Non-utility expense and other | 19,338 | 7,319 | 40,587 | 18,658 | |||||||||||
Depreciation and amortization | 149,760 | 120,829 | 486,377 | 355,538 | |||||||||||
Conservation amortization | 21,601 | 25,395 | 82,489 | 85,847 | |||||||||||
Taxes other than income taxes | 63,822 | 66,367 | 248,357 | 262,099 | |||||||||||
Total operating expenses | 614,167 | 561,333 | 2,007,149 | 1,956,576 | |||||||||||
Operating income (loss) | 37,297 | 99,044 | 354,175 | 500,800 | |||||||||||
Other income (expense): | |||||||||||||||
Other income | 24,806 | 7,151 | 46,378 | 19,375 | |||||||||||
Other expense | (3,250 | ) | (2,878 | ) | (7,678 | ) | (6,134 | ) | |||||||
Non-hedged interest rate swap (expense) income | — | — | — | 28 | |||||||||||
Interest charges: | |||||||||||||||
AFUDC | 3,911 | 3,123 | 10,112 | 7,853 | |||||||||||
Interest expense | (87,578 | ) | (88,780 | ) | (261,988 | ) | (265,771 | ) | |||||||
Income (loss) before income taxes | (24,814 | ) | 17,660 | 140,999 | 256,151 | ||||||||||
Income tax (benefit) expense | (2,844 | ) | 4,824 | 12,428 | 80,489 | ||||||||||
Net income (loss) | $ | (21,970 | ) | $ | 12,836 | $ | 128,571 | $ | 175,662 | ||||||
The accompanying notes are an integral part of the financial statements.
5
PUGET ENERGY, INC.
CONSOLIDATED STATEMENTS OF COMPREHENSIVE INCOME
(Dollars in Thousands)
(Unaudited)
Three Months Ended September 30, | Nine Months Ended September 30, | ||||||||||||||
2018 | 2017 | 2018 | 2017 | ||||||||||||
Net income (loss) | $ | (21,970 | ) | $ | 12,836 | $ | 128,571 | $ | 175,662 | ||||||
Other comprehensive income (loss): | |||||||||||||||
Net unrealized gain (loss) from pension and post-retirement plans, net of tax of $(741), $(143), $(620), and $216, respectively | (2,786 | ) | (266 | ) | (2,333 | ) | 400 | ||||||||
Reclassification of stranded taxes to retained earnings due to tax reform | — | — | (5,230 | ) | — | ||||||||||
Other comprehensive income (loss) | (2,786 | ) | (266 | ) | (7,563 | ) | 400 | ||||||||
Comprehensive income (loss) | $ | (24,756 | ) | $ | 12,570 | $ | 121,008 | $ | 176,062 | ||||||
The accompanying notes are an integral part of the financial statements.
6
PUGET ENERGY, INC. CONSOLIDATED BALANCE SHEETS (Dollars in Thousands) (Unaudited) ASSETS | |||||||
September 30, 2018 | December 31, 2017 | ||||||
Utility plant (at original cost, including construction work in progress of $684,260 and $495,937, respectively): | |||||||
Electric plant | $ | 8,408,412 | $ | 8,135,847 | |||
Natural gas plant | 3,521,224 | 3,307,545 | |||||
Common plant | 961,128 | 811,815 | |||||
Less: Accumulated depreciation and amortization | (2,722,280 | ) | (2,428,524 | ) | |||
Net utility plant | 10,168,484 | 9,826,683 | |||||
Other property and investments: | |||||||
Goodwill | 1,656,513 | 1,656,513 | |||||
Other property and investments | 232,616 | 182,355 | |||||
Total other property and investments | 1,889,129 | 1,838,868 | |||||
Current assets: | |||||||
Cash and cash equivalents | 7,965 | 26,616 | |||||
Restricted cash | 11,143 | 10,145 | |||||
Accounts receivable, net of allowance for doubtful accounts of $8,115 and $8,901, respectively | 228,519 | 341,110 | |||||
Unbilled revenue | 119,042 | 222,186 | |||||
Materials and supplies, at average cost | 114,005 | 107,003 | |||||
Fuel and natural gas inventory, at average cost | 57,293 | 49,908 | |||||
Unrealized gain on derivative instruments | 16,524 | 22,247 | |||||
Prepaid expense and other | 37,759 | 21,996 | |||||
Power contract acquisition adjustment gain | 6,180 | 12,207 | |||||
Total current assets | 598,430 | 813,418 | |||||
Other long-term and regulatory assets: | |||||||
Power cost adjustment mechanism | 4,691 | 4,576 | |||||
Regulatory assets related to power contracts | 17,148 | 19,454 | |||||
Other regulatory assets | 798,112 | 948,532 | |||||
Unrealized gain on derivative instruments | 1,897 | 2,158 | |||||
Power contract acquisition adjustment gain | 157,406 | 162,711 | |||||
Other | 88,488 | 74,389 | |||||
Total other long-term and regulatory assets | 1,067,742 | 1,211,820 | |||||
Total assets | $ | 13,723,785 | $ | 13,690,789 | |||
The accompanying notes are an integral part of the financial statements.
PUGET ENERGY, INC. CONSOLIDATED BALANCE SHEETS (Dollars in Thousands) (Unaudited) CAPITALIZATION AND LIABILITIES | |||||||
September 30, 2018 | December 31, 2017 | ||||||
Capitalization: | |||||||
Common shareholder’s equity: | |||||||
Common stock $0.01 par value, 1,000 shares authorized, 200 shares outstanding | $ | — | $ | — | |||
Additional paid-in capital | 3,308,957 | 3,308,957 | |||||
Retained earnings | 522,427 | 465,355 | |||||
Accumulated other comprehensive income (loss), net of tax | (31,845 | ) | (24,282 | ) | |||
Total common shareholder’s equity | 3,799,539 | 3,750,030 | |||||
Long-term debt: | |||||||
First mortgage bonds and senior notes | 3,764,412 | 3,164,412 | |||||
Pollution control bonds | 161,860 | 161,860 | |||||
Junior subordinated notes | — | 250,000 | |||||
Long-term debt | 1,950,465 | 1,902,600 | |||||
Debt discount, issuance costs and other | (218,582 | ) | (220,943 | ) | |||
Total long-term debt | 5,658,155 | 5,257,929 | |||||
Total capitalization | 9,457,694 | 9,007,959 | |||||
Current liabilities: | |||||||
Accounts payable | 324,801 | 359,586 | |||||
Short-term debt | 206,000 | 329,463 | |||||
Current maturities of long-term debt | — | 200,000 | |||||
Purchased gas adjustment payable | 35,962 | 16,051 | |||||
Accrued expenses: | |||||||
Taxes | 124,643 | 117,948 | |||||
Salaries and wages | 40,411 | 53,220 | |||||
Interest | 80,061 | 73,564 | |||||
Unrealized loss on derivative instruments | 30,558 | 64,859 | |||||
Power contract acquisition adjustment loss | 2,565 | 2,762 | |||||
Other | 89,821 | 80,206 | |||||
Total current liabilities | 934,822 | 1,297,659 | |||||
Other long-term and regulatory liabilities: | |||||||
Deferred income taxes | 775,378 | 746,868 | |||||
Unrealized loss on derivative instruments | 11,588 | 21,235 | |||||
Regulatory liabilities | 751,014 | 731,587 | |||||
Regulatory liability for deferred income taxes | 988,050 | 1,011,626 | |||||
Regulatory liabilities related to power contracts | 163,586 | 174,918 | |||||
Power contract acquisition adjustment loss | 14,583 | 16,693 | |||||
Other deferred credits | 627,070 | 682,244 | |||||
Total other long-term and regulatory liabilities | 3,331,269 | 3,385,171 | |||||
Commitments and contingencies (Note 8) | |||||||
Total capitalization and liabilities | $ | 13,723,785 | $ | 13,690,789 | |||
The accompanying notes are an integral part of the financial statements.
7
PUGET ENERGY, INC. CONSOLIDATED STATEMENTS OF CASH FLOWS (Dollars in Thousands) (Unaudited) | |||||||
Nine Months Ended September 30, | |||||||
2018 | 2017 | ||||||
Operating activities: | |||||||
Net income (loss) | $ | 128,571 | $ | 175,662 | |||
Adjustments to reconcile net income (loss) to net cash provided by operating activities: | |||||||
Depreciation and amortization | 486,377 | 355,538 | |||||
Conservation amortization | 82,489 | 85,847 | |||||
Deferred income taxes and tax credits, net | 5,554 | 81,899 | |||||
Net unrealized (gain) loss on derivative instruments | (21,953 | ) | 22,957 | ||||
AFUDC – equity | (12,958 | ) | (11,266 | ) | |||
Production tax credit monetization | (56,177 | ) | — | ||||
Other non-cash | 11,105 | 12,358 | |||||
Funding of pension liability | (13,500 | ) | (18,000 | ) | |||
Regulatory assets and liabilities | (22,545 | ) | (85,385 | ) | |||
Other long-term assets and liabilities | (4,872 | ) | (2,068 | ) | |||
Change in certain current assets and liabilities: | |||||||
Accounts receivable and unbilled revenue | 214,166 | 204,477 | |||||
Materials and supplies | (7,002 | ) | (2,436 | ) | |||
Fuel and natural gas inventory | (7,385 | ) | (2,789 | ) | |||
Prepayments and other | (15,763 | ) | 7,391 | ||||
Purchased gas adjustment | 19,911 | 8,569 | |||||
Accounts payable | (38,001 | ) | (31,027 | ) | |||
Taxes payable | 6,695 | (30,074 | ) | ||||
Other | (12,379 | ) | (2,983 | ) | |||
Net cash provided by (used in) operating activities | 742,333 | 768,670 | |||||
Investing activities: | |||||||
Construction expenditures – excluding equity AFUDC | (760,728 | ) | (761,968 | ) | |||
Other | 2,090 | 5,796 | |||||
Net cash provided by (used in) investing activities | (758,638 | ) | (756,172 | ) | |||
Financing activities: | |||||||
Change in short-term debt, net | (123,463 | ) | (106,763 | ) | |||
Dividends paid | (76,728 | ) | (17,543 | ) | |||
Proceeds from long-term debt and bonds issued | 642,615 | 70,583 | |||||
Redemption of bonds and notes | (450,000 | ) | — | ||||
Other | 6,228 | 15,999 | |||||
Net cash provided by (used in) financing activities | (1,348 | ) | (37,724 | ) | |||
Net increase (decrease) in cash, cash equivalents, and restricted cash | (17,653 | ) | (25,226 | ) | |||
Cash, cash equivalents, and restricted cash at beginning of period | 36,761 | 41,296 | |||||
Cash, cash equivalents, and restricted cash at end of period | $ | 19,108 | $ | 16,070 | |||
Supplemental cash flow information: | |||||||
Cash payments for interest (net of capitalized interest) | $ | 234,438 | $ | 239,566 | |||
Cash payments (refunds) for income taxes | 7,595 | 1,649 | |||||
Non-cash financing and investing activities: | |||||||
Accounts payable for capital expenditures eliminated from cash flows | $ | 105,070 | $ | 87,456 | |||
The accompanying notes are an integral part of the financial statements.
8
PUGET SOUND ENERGY, INC.
CONSOLIDATED STATEMENTS OF INCOME
(Dollars in Thousands)
(Unaudited)
Three Months Ended September 30, | Nine Months Ended September 30, | ||||||||||||||
2018 | 2017 | 2018 | 2017 | ||||||||||||
Operating revenue: | |||||||||||||||
Electric | $ | 534,569 | $ | 537,543 | $ | 1,735,765 | $ | 1,736,335 | |||||||
Natural gas | 106,826 | 111,516 | 597,306 | 691,685 | |||||||||||
Other | 10,069 | 11,318 | 28,253 | 29,356 | |||||||||||
Total operating revenue | 651,464 | 660,377 | 2,361,324 | 2,457,376 | |||||||||||
Operating expenses: | |||||||||||||||
Energy costs: | |||||||||||||||
Purchased electricity | 148,536 | 115,881 | 431,856 | 425,263 | |||||||||||
Electric generation fuel | 71,004 | 66,584 | 143,177 | 152,057 | |||||||||||
Residential exchange | (15,401 | ) | (14,246 | ) | (55,436 | ) | (52,814 | ) | |||||||
Purchased natural gas | 30,192 | 32,224 | 211,679 | 248,208 | |||||||||||
Unrealized (gain) loss on derivative instruments, net | (14,046 | ) | (23 | ) | (21,953 | ) | 23,098 | ||||||||
Utility operations and maintenance | 139,361 | 141,003 | 440,016 | 438,622 | |||||||||||
Non-utility expense and other | 10,518 | 9,994 | 31,132 | 27,857 | |||||||||||
Depreciation and amortization | 149,730 | 120,829 | 486,300 | 355,538 | |||||||||||
Conservation amortization | 21,601 | 25,395 | 82,489 | 85,847 | |||||||||||
Taxes other than income taxes | 63,822 | 66,367 | 248,357 | 262,099 | |||||||||||
Total operating expenses | 605,317 | 564,008 | 1,997,617 | 1,965,775 | |||||||||||
Operating income (loss) | 46,147 | 96,369 | 363,707 | 491,601 | |||||||||||
Other income (expense): | |||||||||||||||
Other income | 13,596 | 6,778 | 29,352 | 18,861 | |||||||||||
Other expense | (3,250 | ) | (2,878 | ) | (7,678 | ) | (6,134 | ) | |||||||
Interest charges: | |||||||||||||||
AFUDC | 3,911 | 3,123 | 10,112 | 7,853 | |||||||||||
Interest expense | (58,278 | ) | (59,868 | ) | (174,853 | ) | (180,320 | ) | |||||||
Income (loss) before income taxes | 2,126 | 43,524 | 220,640 | 331,861 | |||||||||||
Income tax (benefit) expense | (1,765 | ) | 14,424 | 26,931 | 109,015 | ||||||||||
Net income (loss) | $ | 3,891 | $ | 29,100 | $ | 193,709 | $ | 222,846 | |||||||
The accompanying notes are an integral part of the financial statements.
9
PUGET SOUND ENERGY, INC.
CONSOLIDATED STATEMENTS OF COMPREHENSIVE INCOME
(Dollars in Thousands)
(Unaudited)
Three Months Ended September 30, | Nine Months Ended September 30, | ||||||||||||||
2018 | 2017 | 2018 | 2017 | ||||||||||||
Net income (loss) | $ | 3,891 | $ | 29,100 | $ | 193,709 | $ | 222,846 | |||||||
Other comprehensive income (loss): | |||||||||||||||
Net unrealized gain (loss) from pension and post-retirement plans, net of tax of $(30), $939, $1,492, and $3,813, respectively | (113 | ) | 1,744 | 5,613 | 7,083 | ||||||||||
Amortization of treasury interest rate swaps to earnings, net of tax of $26, $43, $77, and $128, respectively | 96 | 79 | 289 | 237 | |||||||||||
Reclassification of stranded taxes to retained earnings due to tax reform | — | — | (27,333 | ) | — | ||||||||||
Other comprehensive income (loss) | (17 | ) | 1,823 | (21,431 | ) | 7,320 | |||||||||
Comprehensive income (loss) | $ | 3,874 | $ | 30,923 | $ | 172,278 | $ | 230,166 | |||||||
The accompanying notes are an integral part of the financial statements.
10
PUGET SOUND ENERGY, INC.
CONSOLIDATED BALANCE SHEETS
(Dollars in Thousands)
(Unaudited)
ASSETS
September 30, 2018 | December 31, 2017 | ||||||
Utility plant (at original cost, including construction work in progress of $684,260 and $495,937, respectively): | |||||||
Electric plant | $ | 10,487,372 | $ | 10,232,771 | |||
Natural gas plant | 4,089,635 | 3,882,733 | |||||
Common plant | 991,094 | 843,145 | |||||
Less: Accumulated depreciation and amortization | (5,399,617 | ) | (5,131,966 | ) | |||
Net utility plant | 10,168,484 | 9,826,683 | |||||
Other property and investments: | |||||||
Other property and investments | 77,429 | 76,350 | |||||
Total other property and investments | 77,429 | 76,350 | |||||
Current assets: | |||||||
Cash and cash equivalents | 5,640 | 25,864 | |||||
Restricted cash | 11,143 | 10,145 | |||||
Accounts receivable, net of allowance for doubtful accounts of $8,115 and $8,901, respectively | 236,761 | 343,546 | |||||
Unbilled revenue | 119,042 | 222,186 | |||||
Materials and supplies, at average cost | 114,005 | 107,003 | |||||
Fuel and natural gas inventory, at average cost | 55,970 | 48,585 | |||||
Unrealized gain on derivative instruments | 16,524 | 22,247 | |||||
Prepaid expense and other | 37,759 | 21,996 | |||||
Total current assets | 596,844 | 801,572 | |||||
Other long-term and regulatory assets: | |||||||
Power cost adjustment mechanism | 4,691 | 4,576 | |||||
Other regulatory assets | 798,112 | 948,540 | |||||
Unrealized gain on derivative instruments | 1,897 | 2,158 | |||||
Other | 86,324 | 71,827 | |||||
Total other long-term and regulatory assets | 891,024 | 1,027,101 | |||||
Total assets | $ | 11,733,781 | $ | 11,731,706 | |||
The accompanying notes are an integral part of the financial statements.
11
PUGET SOUND ENERGY, INC.
CONSOLIDATED BALANCE SHEETS
(Dollars in Thousands)
(Unaudited)
CAPITALIZATION AND LIABILITIES
September 30, 2018 | December 31, 2017 | ||||||
Capitalization: | |||||||
Common shareholder’s equity: | |||||||
Common stock $0.01 par value, 150,000,000 shares authorized, 85,903,791 shares outstanding | $ | 859 | $ | 859 | |||
Additional paid-in capital | 3,275,105 | 3,275,105 | |||||
Retained earnings | 521,792 | 452,066 | |||||
Accumulated other comprehensive income (loss), net of tax | (148,337 | ) | (126,906 | ) | |||
Total common shareholder’s equity | 3,649,419 | 3,601,124 | |||||
Long-term debt: | |||||||
First mortgage bonds and senior notes | 3,764,412 | 3,164,412 | |||||
Pollution control bonds | 161,860 | 161,860 | |||||
Junior subordinated notes | — | 250,000 | |||||
Debt discount, issuance costs and other | (31,785 | ) | (26,361 | ) | |||
Total long-term debt | 3,894,487 | 3,549,911 | |||||
Total capitalization | 7,543,906 | 7,151,035 | |||||
Current liabilities: | |||||||
Accounts payable | 324,813 | 359,585 | |||||
Short-term debt | 206,000 | 329,463 | |||||
Current maturities of long-term debt | — | 200,000 | |||||
Purchased gas adjustment payable | 35,962 | 16,051 | |||||
Accrued expenses: | |||||||
Taxes | 124,643 | 117,063 | |||||
Salaries and wages | 40,411 | 53,220 | |||||
Interest | 57,181 | 47,837 | |||||
Unrealized loss on derivative instruments | 30,558 | 64,859 | |||||
Other | 89,821 | 80,206 | |||||
Total current liabilities | 909,389 | 1,268,284 | |||||
Other long-term and regulatory liabilities: | |||||||
Deferred income taxes | 907,432 | 869,473 | |||||
Unrealized loss on derivative instruments | 11,588 | 21,235 | |||||
Regulatory liabilities | 749,691 | 730,273 | |||||
Regulatory liability for deferred income taxes | 988,671 | 1,012,260 | |||||
Other deferred credits | 623,104 | 679,146 | |||||
Total other long-term and regulatory liabilities | 3,280,486 | 3,312,387 | |||||
Commitments and contingencies (Note 8) | |||||||
Total capitalization and liabilities | $ | 11,733,781 | $ | 11,731,706 | |||
The accompanying notes are an integral part of the financial statements.
12
PUGET SOUND ENERGY, INC.
CONSOLIDATED STATEMENTS OF CASH FLOWS
(Dollars in Thousands)
(Unaudited)
Nine Months Ended September 30, | |||||||
2018 | 2017 | ||||||
Operating activities: | |||||||
Net income (loss) | $ | 193,709 | $ | 222,846 | |||
Adjustments to reconcile net income (loss) to net cash provided by operating activities: | |||||||
Depreciation and amortization | 486,300 | 355,538 | |||||
Conservation amortization | 82,489 | 85,847 | |||||
Deferred income taxes and tax credits, net | 12,801 | 109,015 | |||||
Net unrealized (gain) loss on derivative instruments | (21,953 | ) | 23,098 | ||||
AFUDC – equity | (12,958 | ) | (11,266 | ) | |||
Production tax credit monetization | (56,177 | ) | — | ||||
Other non-cash | 3,319 | 3,946 | |||||
Funding of pension liability | (13,500 | ) | (18,000 | ) | |||
Regulatory assets and liabilities | (22,545 | ) | (85,385 | ) | |||
Other long-term assets and liabilities | 5,144 | (17,665 | ) | ||||
Change in certain current assets and liabilities: | |||||||
Accounts receivable and unbilled revenue | 208,359 | 215,674 | |||||
Materials and supplies | (7,002 | ) | (2,436 | ) | |||
Fuel and natural gas inventory | (7,385 | ) | (2,789 | ) | |||
Prepayments and other | (15,763 | ) | 7,391 | ||||
Purchased gas adjustment | 19,911 | 8,569 | |||||
Accounts payable | (37,988 | ) | (31,027 | ) | |||
Taxes payable | 7,580 | (30,074 | ) | ||||
Other | (9,528 | ) | (857 | ) | |||
Net cash provided by (used in) operating activities | 814,813 | 832,425 | |||||
Investing activities: | |||||||
Construction expenditures – excluding equity AFUDC | (712,329 | ) | (677,004 | ) | |||
Other | 2,090 | 6,233 | |||||
Net cash provided by (used in) investing activities | (710,239 | ) | (670,771 | ) | |||
Financing activities: | |||||||
Change in short-term debt, net | (123,463 | ) | (106,763 | ) | |||
Dividends paid | (151,315 | ) | (96,546 | ) | |||
Long-term bonds and notes issued | 594,750 | — | |||||
Redemption of bonds and notes | (450,000 | ) | — | ||||
Other | 6,228 | 15,997 | |||||
Net cash provided by (used in) financing activities | (123,800 | ) | (187,312 | ) | |||
Net increase (decrease) in cash, cash equivalents, and restricted cash | (19,226 | ) | (25,658 | ) | |||
Cash, cash equivalents, and restricted cash at beginning of period | 36,009 | 40,899 | |||||
Cash, cash equivalents, and restricted cash at end of period | $ | 16,783 | $ | 15,241 | |||
Supplemental cash flow information: | |||||||
Cash payments for interest (net of capitalized interest) | $ | 152,273 | $ | 160,426 | |||
Cash payments (refunds) for income taxes | 13,839 | 3,058 | |||||
Non-cash financing and investing activities: | |||||||
Accounts payable for capital expenditures eliminated from cash flows | $ | 105,070 | $ | 87,456 | |||
The accompanying notes are an integral part of the financial statements.
13
COMBINED NOTES TO CONSOLIDATED FINANCIAL STATEMENTS (Unaudited)
(1) | Summary of Consolidation Policy |
Basis of Presentation
Puget Energy is an energy services holding company that owns Puget Sound Energy (PSE). PSE is a public utility incorporated in the state of Washington that furnishes electric and natural gas services in a territory covering approximately 6,000 square miles, primarily in the Puget Sound region. Puget Energy also has a wholly-owned non-regulated subsidiary, Puget LNG, LLC (Puget LNG), which has the sole purpose of owning, developing and financing the non-regulated activity of the Tacoma LNG facility, currently under construction. PSE and Puget LNG are considered related parties with similar ownership by Puget Energy. Therefore, capital and operating costs that are incurred by PSE and allocated to Puget LNG are related party transactions by nature.
In 2009, Puget Holdings, LLC (Puget Holdings), owned by a consortium of long-term infrastructure investors, completed its merger with Puget Energy (the merger). As a result of the merger, all of Puget Energy’s common stock is indirectly owned by Puget Holdings. The acquisition of Puget Energy was accounted for in accordance with Financial Accounting Standards Board (FASB) Accounting Standards Codification (ASC) 805, “Business Combinations” (ASC 805), as of the date of the merger. ASC 805 requires the acquirer to recognize and measure identifiable assets acquired and liabilities assumed at fair value as of the merger date.
The consolidated financial statements of Puget Energy reflect the accounts of Puget Energy and its subsidiaries. PSE’s consolidated financial statements include the accounts of PSE and its subsidiary. Puget Energy and PSE are collectively referred to herein as “the Company”. The consolidated financial statements are presented after elimination of all significant intercompany items and transactions. PSE’s consolidated financial statements continue to be accounted for on a historical basis and do not include any Accounting Standards Codification (ASC) 805, “Business Combinations” (ASC 805) purchase accounting adjustments. The preparation of financial statements in conformity with U.S. Generally Accepted Accounting Principles (GAAP) requires management to make estimates and assumptions that affect the reported amounts of assets and liabilities, disclosure of contingent assets and liabilities at the date of the financial statements and the reported amounts of revenue and expenses during the reporting period. Actual results could differ from those estimates.
Tacoma LNG Facility
The Tacoma LNG facility is intended to provide peak-shaving services to PSE’s natural gas customers. By storing surplus natural gas, PSE is able to meet the requirements of peak consumption. LNG will also provide fuel to transportation customers, particularly in the marine market. On January 24, 2018, the Puget Sound Clean Air Agency determined a Supplemental Environmental Impact Statement is necessary in order to rule on the air quality permit for the facility. As a result of requiring a Supplemental Environmental Impact Statement, the Company's construction schedule may be impacted depending on the Puget Sound Clean Air Agency's timing and decision on the air quality permit.
If delayed, the construction schedule and costs may be adversely impacted. Pursuant to an order by the Washington Utilities and Transportation Commission (Washington Commission), PSE will be allocated approximately 43.0% of common capital and operating costs, consistent with the regulated portion of the Tacoma LNG facility. The remaining 57.0% of common capital and operating costs of the Tacoma LNG facility will be allocated to Puget LNG. Per this allocation of costs, $156.1 million of construction work in progress and $1.5 million of operating costs related to Puget LNG's portion of the Tacoma LNG facility are reported in the Puget Energy "Other property and investments" and "Non-utility expense and other" financial statement line items, respectively, as of September 30, 2018. Additionally, $120.0 million of construction work in progress related to PSE’s portion of the Tacoma LNG facility is reported in the PSE “Utility plant - Natural gas plant” financial statement line item, as PSE is a regulated entity.
14
(2) New Accounting Pronouncements
Recently Adopted Accounting Guidance
Retirement Benefits
In March 2017, the FASB issued Accounting Standards Update (ASU) 2017-07, "Compensation - Retirement Benefits (Topic 715): Improving the Presentation of Net Periodic Pension Cost and Net Periodic Postretirement Benefit Cost". The amendments require that an employer report the service cost component in the same line items as other compensation costs arising from services rendered by the pertinent employees during the period. The other components of net benefit cost (which include interest costs, expected return on plan assets, amortization of prior service cost or credits and actuarial gains and losses) are required to be presented in the income statement separately from the service cost component and outside a subtotal of income from operations. The line item used in the income statement to present the other components of net benefit cost must be disclosed. Additionally, the service cost component of net benefit cost is the only eligible cost for capitalization.
These amendments are effective for fiscal years beginning after December 15, 2017, including interim periods within those years. The Company adopted ASU 2017-07 during the first quarter of fiscal year 2018 by applying the amendments related to the presentation of the service cost component and other components of net periodic pension cost retrospectively. For additional information, see Note 6, "Retirement Benefits" to the consolidated financial statements included in Item 1 of this report.
Income Taxes
In March 2018, the FASB issued ASU 2018-05, "Income Taxes (Topic 740): Amendments to SEC Paragraphs Pursuant to SEC Staff Accounting Bulletin No. 118". The staff of the U.S. Securities and Exchange Commission (SEC) recognized the complexity of reflecting the impacts of the Tax Cuts Job Act (TCJA), and on December 22, 2017 issued guidance in Staff Accounting Bulletin 118 (SAB 118), which clarifies accounting for income taxes under Accounting Standards Codification (ASC) 740 if information is not yet available or complete and provides for up to a one year period in which to complete the required analysis and accounting (the measurement period). SAB 118 describes three scenarios (or “buckets”) associated with a company’s status of accounting for income tax reform: (i) a company is complete with its accounting for certain effects of tax reform, (ii) a company is able to determine a reasonable estimate for certain effects of tax reform and records that estimate as a provisional amount, or (iii) a company is not able to determine a reasonable estimate and therefore continues to apply ASC 740, based on the provisions of the tax laws that were in effect immediately prior to the TCJA being enacted. The Company has completed the required analysis and accounting for substantially all the effects of the TCJA's enactment and has made a reasonable estimate as to the other effects and has reflected the measurement and accounting of the effects in the consolidated financial statements. The items reflected as provisional amounts include tax depreciation and amortization and other book to tax differences. The Company has accounted for these items based on its interpretation of the TCJA. Further interpretive guidance on the TCJA from the Internal Revenue Service (IRS), U.S. Treasury Department, or the Joint Committee on Taxation may require adjustments to the Company's accounting. In accordance with SAB 118, adjustments, if any, will be recorded in 2018.
At December 31, 2017, the Company did not identify any effects of the TCJA for which they were not able to either complete the required analysis or make a reasonable estimate. Additionally, PSE filed an accounting petition on December 29, 2017 requesting deferred accounting treatment for impacts of tax reform. For additional information, see Note 7, "Regulation and Rates" to the consolidated financial statements included in Item 1 of this report.
Stranded Tax Effects in AOCI
In February 2018, the FASB issued ASU 2018-02, "Income Statement—Reporting Comprehensive Income (Topic 220): Reclassification of Certain Tax Effects from Accumulated Other Comprehensive Income". The amendments in this update allow reclassification from accumulated other comprehensive income to retained earnings for stranded tax effects resulting from the TCJA and will improve the usefulness of information reported to financial statement users.
These amendments are effective for fiscal years beginning after December 15, 2018, including interim periods within those years. Early adoption is permitted, including adoption in any interim period for reporting periods for which financial statements have not yet been issued. The Company early adopted ASU 2018-02 as of January 1, 2018 and reclassified accumulated other comprehensive income to retained earnings, resulting in a $5.2 million increase for Puget Energy related to pension and post-retirement plans and a $27.3 million increase for PSE, comprised of $26.2 million related to pension and post-retirement plans and $1.1 million related to interest rate swaps.
Statement of Cash Flows
In August 2016, the FASB issued ASU 2016-15, "Statement of Cash Flows (Topic 230): Classification of Certain Cash Receipts and Cash Payments". The amendments in ASU 2016-15 provide guidance for eight specific cash flow issues that include (i) debt prepayment or debt extinguishment costs, (ii) settlement of zero-coupon debt instruments, (iii) contingent consideration payments
15
made after a business combination, (iv) proceeds from the settlement of insurance claims, (v) proceeds from the settlement of corporate-owned life insurance policies, including bank-owned life insurance policies, (vi) distribution received from equity method investees, (vii) beneficial interest in securitization transactions, and (viii) separately identifiable cash flows and application of the predominance principle.
This update is effective for financial statements issued for fiscal years beginning after December 15, 2017, and interim periods within those fiscal years. Early adoption is permitted for all entities upon issuance. The amendments in this update should be applied using a retrospective transition method to each period presented. The Company adopted ASU 2016-15 as of January 1, 2018, with the standard only impacting the classification of debt extinguishment costs as financing outflows.
In November 2016, the FASB issued ASU 2016-18, "Statement of Cash Flows (Topic 230): Restricted Cash". The amendments in this update require that a statement of cash flows explain the change during the period in the total of cash, cash equivalents, and amounts generally described as restricted cash or restricted cash equivalents. The new standard is effective for fiscal years beginning after December 15, 2017, and interim periods within those fiscal years. The Company adopted ASU 2016-18 as of January 1, 2018, by moving the presentation of restricted cash in the statement of cash flows to net cash flows of total cash, cash equivalents, and restricted cash. Amounts included in restricted cash primarily represent funds required to be set aside for contractual obligations related to transmission and generation facilities.
The following tables provide a reconciliation of cash, cash equivalents and restricted cash reported within the statements of cash flows:
Puget Energy | Nine Months Ended September 30, | ||||||
(Dollars in Thousands) | 2018 | 2017 | |||||
Cash and cash equivalents | $ | 7,965 | $ | 6,768 | |||
Restricted cash | 11,143 | 9,302 | |||||
Total cash, cash equivalents and restricted cash shown in the statement of cash flows | $ | 19,108 | $ | 16,070 | |||
Puget Sound Energy | Nine Months Ended September 30, | ||||||
(Dollars in Thousands) | 2018 | 2017 | |||||
Cash and cash equivalents | $ | 5,640 | $ | 5,939 | |||
Restricted cash | 11,143 | 9,302 | |||||
Total cash, cash equivalents and restricted cash shown in the statement of cash flows | $ | 16,783 | $ | 15,241 | |||
Revenue Recognition
In May 2014, the FASB issued ASU No. 2014-09, "Revenue from Contracts with Customers (Topic 606)". ASU 2014-09 and the related amendments outline a single comprehensive model for use in accounting for revenue arising from contracts with customers and supersede most current revenue recognition guidance, including industry-specific guidance. The ASU is based on the principle that an entity should recognize revenue to depict the transfer of goods or services to customers in an amount that reflects the consideration to which the entity expects to be entitled in exchange for those goods or services. The ASU also requires additional disclosure about the nature, amount, timing and uncertainty of revenue and cash flows arising from customer contracts, including significant judgments and changes in judgments and assets recognized from costs incurred to fulfill a contract.
The Company implemented the standard as of January 1, 2018, using the modified retrospective method of adoption. As a result of implementation of this standard, the Company made no cumulative adjustments to revenue for contracts with customers open as of January 1, 2018. For the three and nine months ended September 30, 2018, the Company's revenue was 86.9% and 91.4% comprised of contracts with retail customers from rate-regulated sales of electricity and natural gas where revenue is recognized over time as delivered. Pursuant to the new standard, the Company has added enhanced quantitative and qualitative disclosures for revenue from contracts with customers and revenue outside the scope of the standard, in Note 3, "Revenue" to the consolidated financial statements included in Item 1 of this report.
Accounting Standards Issued but Not Yet Adopted
Internal-Use Software
In August 2018, the FASB issued ASU 2018-15, "Intangibles—Goodwill and Other—Internal-Use Software (Subtopic 350-40): Customer’s Accounting for Implementation Costs Incurred in a Cloud Computing Arrangement That Is a Service
16
Contract". These amendments align the requirements for capitalizing implementation costs incurred in a hosting arrangement that is a service contract with the requirements for capitalizing implementation costs incurred to develop or obtain internal-use software (and hosting arrangements that include an internal-use software license). The accounting for the service element of a hosting arrangement that is a service contract is not affected by these amendments.
The amendments in this Update are effective for public business entities for fiscal years beginning after December 15, 2019, and interim periods within those fiscal years. Early adoption of the amendments in this Update is permitted, including adoption in any interim period, for all entities. The amendments in this Update should be applied either retrospectively or prospectively to all implementation costs incurred after the date of adoption. The Company is in the process of evaluating potential impacts of these amendments.
Fair Value Measurement
In August 2018, the FASB issued ASU 2018-13, "Fair Value Measurement (Topic 820): Disclosure Framework - Changes to the Disclosure Requirements for Fair Value Measurement". The amendments in this update modify the disclosure requirements on fair value measurements in Topic 820, Fair Value Measurement, based on the concepts in the Concepts Statement, including the consideration of costs and benefits. The amendments are effective for fiscal years, and interim periods within those fiscal years, beginning after December 15, 2019. The Company is in the process of evaluating potential impacts of these amendments to Note 5, "Fair Value Measurements" to the consolidated financial statements.
Retirement Benefits
In August 2018, the FASB issued ASU 2018-14, "Compensation—Retirement Benefits—Defined Benefit Plans—General (Subtopic 715-20): Disclosure Framework—Changes to the Disclosure Requirements for Defined Benefit Plans". This update modifies the disclosure requirements for employers that sponsor defined benefit pension or other postretirement plans through added, removed, and clarified requirements of relevant disclosures.
The amendments in this update are effective for fiscal years ending after December 15, 2020, for public business entities and for fiscal years ending after December 15, 2021, for all other entities. Early adoption is permitted for all entities. The Company is in the process of evaluating potential impacts of these amendments to Note 6, "Retirement Benefits" to the consolidated financial statements.
Lease Accounting
In February 2016, the FASB issued ASU 2016-02, "Leases (Topic 842)". The FASB issued this ASU to increase transparency and comparability among organizations by recognizing right-of-use (ROU) lease assets and lease liabilities on the balance sheet and disclosing key information about leasing arrangements. To meet that objective, the FASB is amending the FASB ASC and creating Topic 842, Leases. ASU 2016-02 requires lessees to recognize the following for all leases (with the exception of short-term leases) at the commencement date: (i) a lease liability, which is a lessee's obligation to make lease payments arising from a lease, measured on a discounted basis; and (ii) a right-of-use asset, which is an asset that represents the lessee’s right to use, or control the use of, a specified asset for the lease term. The income statement recognition is similar to existing lease accounting and is based on lease classification. Under the new guidance, lessor accounting is largely unchanged.
In January 2018, the FASB issued ASU 2018-01, "Leases (Topic 842): Land Easement Practical Expedient for Transition to Topic 842". In connection with the FASB’s transition support efforts, the amendments in this update provide an optional transition practical expedient to not evaluate under Topic 842 existing or expired land easements that were not previously accounted for as leases under the current guidance in Topic 840. An entity that elects this practical expedient should evaluate new or modified land easements under Topic 842 upon adoption. Land easements (also commonly referred to as rights of way) represent the right to use, access, or cross another entity’s land for a specified purpose. The Company plans to elect this practical expedient, and will evaluate new and modified land easements as of the first quarter of fiscal year 2019.
In July 2018, the FASB issued both ASU 2018-10 and ASU 2018-11, "Leases (Topic 842): Codification Improvements" and "Leases (Topic 842): Targeted Improvements". These ASUs provide entities with both clarification on existing guidance issued in ASU 2016-02, as well as an additional transition method to adopt the new leasing standard. Under the new transition method, the entity initially applies the new standard at the adoption date by recognizing a cumulative-effect adjustment to the opening balance of retained earnings in the period of adoption. Consequently, an entity's reporting for the comparative periods presented in the financial statements will continue to be in accordance with Topic 840. The Company is in the process of evaluating potential impacts of this new transition method. In preparation for adoption of the standard, the Company initiated a project team that meets bi-weekly to make key accounting assessments related to the standard, which included the implementation of associated internal controls.
These amendments are effective for financial statements issued for fiscal years beginning after December 15, 2018, including interim periods within those fiscal years. Earlier adoption is permitted for all entities upon issuance. The Company will adopt ASU 2016-02 during the first quarter of fiscal year 2019 and expects the adoption of the standard will result in recognition of
17
right-of-use assets and liabilities that have not previously been recorded, which will have a material impact on the consolidated balance sheets.
(3) Revenue
The following table presents disaggregated revenue from contracts with customers, and other revenue by major source:
Puget Energy and Puget Sound Energy | |||||||
(Dollars in Thousands) | Three Months Ended September 30, | Nine Months Ended September 30, | |||||
Revenue from contracts with customers: | 2018 | 2018 | |||||
Electric retail | $ | 464,210 | $ | 1,563,394 | |||
Natural gas retail | 101,995 | 594,572 | |||||
Other | 67,217 | 148,581 | |||||
Total revenue from contracts with customers | 633,422 | 2,306,547 | |||||
Alternative revenue programs | (782 | ) | (24,678 | ) | |||
Other non-customer revenue | 18,824 | 79,455 | |||||
Total operating revenue | $ | 651,464 | $ | 2,361,324 | |||
Revenue at PSE is recognized when performance obligations under the terms of a contract or tariff with our customers are satisfied. Performance obligations are satisfied generally through performance of PSE's obligation over time or with transfer of control of electric power, natural gas, and other revenue from contracts with customers. Revenue is measured as the amount of consideration expected to be received in exchange for transferring goods and services.
Electric and Natural Gas Retail Revenue
Electric and natural gas retail revenue consists of tariff-based sales of electricity and natural gas to PSE's customers. For tariff contracts, PSE has elected the portfolio approach practical expedient model to apply the revenue from contracts with customers to groups of contracts. The Company determined that the portfolio approach will not differ from considering each contract or performance obligation separately. Electric and natural gas tariff contracts include the performance obligation of standing ready to perform electric and natural gas services. The electricity and natural gas the customer chooses to consume is considered an option and is recognized over time using the output method when the customer simultaneously consumes the electricity or natural gas. PSE has elected the right to invoice practical expedient for unbilled retail revenue. The obligation of standing ready to perform electric service and the consumption of electricity and natural gas at market value implies a right to consideration for performance completed to date. The Company believes that tariff prices approved by the Washington Commission represent stand-alone selling prices for the performance obligations under ASC 606. PSE collects Washington State excise taxes (which are a component of general retail customer rates) and municipal taxes and presents the taxes on a gross basis, as PSE is the taxpayer for those excise and municipal taxes.
Other Revenue from Contracts with Customers
Other revenue from contracts with customers is primarily comprised of electric transmission, natural gas transportation, biogas, and wholesale revenue sold on an intra-month basis.
Electric Transmission and Natural Gas Transportation
Transmission and transportation tariff contracts include the performance obligation to transmit and transport electricity or natural gas. Transfer of control and recognition of revenue occurs over time as the customer simultaneously receives the transmission and transportation services. Measurement of satisfaction of this performance obligation is determined using the output method. Similar to retail revenue, the Company utilizes the right to invoice practical expedient as PSE’s right to consideration is tied directly to the value of power and gas transmitted and transported each month. The price is based on the tariff rates that were approved by the Washington Commission or the Federal Energy Regulatory Commission (FERC) and, therefore, corresponds directly to the value to the customer for performance completed to date.
18
Biogas
Biogas is a renewable natural gas fuel that PSE purchases and sells along with the renewable green attributes derived from the renewable natural gas. Biogas contracts include the performance obligations of biogas and renewable credit delivery upon PSE receiving produced biogas from its supplier. Transfer of control and recognition of revenue occurs at a point in time as biogas is considered a storable commodity and may not be consumed as it is delivered.
Wholesale Revenue
Wholesale revenue at PSE includes sales of electric power and non-core natural gas to other utilities or marketers. Wholesale revenue contracts include the performance obligation of physical electric power or natural gas. There are typically no added fixed or variable amounts on top of the established rate for power or natural gas and contracts always have a stated, fixed quantity of power or natural gas delivered. Transfer of control and recognition of revenue occurs at a point in time when the customer takes physical possession of electric power or natural gas. Non-core gas consists of natural gas supply in excess of natural gas used for generation, sold to third parties to mitigate the costs of firm transportation and storage capacity for its core natural gas customers. PSE reports non-core gas sold net of costs as PSE does not take control of the natural gas but is merely an agent within the market that connects a seller to a purchaser.
Other Revenue
In accordance with ASC 606, PSE separately presents revenue not collected from contracts with customers that falls under other accounting guidance.
(4) Accounting for Derivative Instruments and Hedging Activities
PSE employs various energy portfolio optimization strategies but is not in the business of assuming risk for the purpose of realizing speculative trading revenue. The nature of serving regulated electric customers with its portfolio of owned and contracted electric generation resources exposes PSE and its customers to some volumetric and commodity price risks within the sharing mechanism of the power cost adjustment (PCA). Therefore, wholesale market transactions and PSE's related hedging strategies are focused on reducing costs and risks where feasible, thus reducing volatility of costs in the portfolio. In order to manage its exposure to the variability in future cash flows for forecasted energy transactions, PSE utilizes a programmatic hedging strategy which extends out three years. PSE's hedging strategy includes a risk-responsive component for the core natural gas portfolio, which utilizes quantitative risk-based measures with defined objectives to balance both portfolio risk and hedge costs. PSE's energy risk portfolio management function monitors and manages these risks using analytical models and tools. In order to manage risks effectively, PSE enters into forward physical electric and natural gas purchase and sale agreements, fixed-for-floating swap contracts, and commodity call/put options. Currently, the Company does not apply cash flow hedge accounting and therefore records all mark-to-market gains or losses through earnings.
The Company manages its interest rate risk through the issuance of mostly fixed-rate debt with varied maturities. The Company utilizes internal cash from operations, borrowings under its commercial paper program and its credit facilities to meet short-term funding needs. The Company may enter into swap instruments or other financial hedge instruments to manage the interest rate risk associated with these debts.
19
The following table presents the volumes, fair values and classification of the Company's derivative instruments recorded on the balance sheets:
Puget Energy and Puget Sound Energy | |||||||||||||||||||
At September 30, 2018 | At December 31, 2017 | ||||||||||||||||||
(Dollars in Thousands) | Volumes | Assets1 | Liabilities1 | Volumes | Assets1 | Liabilities1 | |||||||||||||
Electric portfolio derivatives | * | $ | 8,229 | $ | 21,935 | * | $ | 13,391 | $ | 49,050 | |||||||||
Natural gas derivatives (MMBtus)2 | 302.0 million | 10,192 | 20,211 | 332.1 million | 11,014 | 37,044 | |||||||||||||
Total derivative contracts | $ | 18,421 | $ | 42,146 | $ | 24,405 | $ | 86,094 | |||||||||||
Current | $ | 16,524 | $ | 30,558 | $ | 22,247 | $ | 64,859 | |||||||||||
Long-term | 1,897 | 11,588 | 2,158 | 21,235 | |||||||||||||||
Total derivative contracts | $ | 18,421 | $ | 42,146 | $ | 24,405 | $ | 86,094 | |||||||||||
_______________
1 | Balance sheet classification: Current and Long-term Unrealized loss on derivative instruments. |
2 | All fair value adjustments on derivatives relating to the natural gas business have been deferred in accordance with ASC 980, “Regulated Operations,” due to the purchased gas adjustment (PGA) mechanism. The net derivative asset or liability and offsetting regulatory liability or asset are related to contracts used to economically hedge the cost of physical gas purchased to serve natural gas customers. |
* | Electric portfolio derivatives consist of electric generation fuel of 134.6 million One Million British Thermal Units (MMBtu) and purchased electricity of 6.5 million Megawatt Hours (MWhs) at September 30, 2018, and 166.8 million MMBtus and 2.9 million MWhs at December 31, 2017. |
It is the Company's policy to record all derivative transactions on a gross basis at the contract level without offsetting assets or liabilities. The Company generally enters into transactions using the following master agreements: WSPP, Inc. (WSPP) agreements, which standardize physical power contracts; International Swaps and Derivatives Association (ISDA) agreements, which standardize financial natural gas and electric contracts; and North American Energy Standards Board (NAESB) agreements, which standardize physical natural gas contracts. The Company believes that such agreements reduce credit risk exposure because such agreements provide for the netting and offsetting of monthly payments as well as the right of set-off in the event of counterparty default. The set-off provision can be used as a final settlement of accounts which extinguishes the mutual debts owed between the parties in exchange for a new net amount. For further details regarding the fair value of derivative instruments, see Note 5, "Fair Value Measurements," to the consolidated financial statements included in Item 1 of this report.
20
The following tables present the potential effect of netting arrangements, including rights of set-off associated with the Company's derivative assets and liabilities:
Puget Energy and Puget Sound Energy | |||||||||||||||||||||||
At September 30, 2018 | |||||||||||||||||||||||
Gross Amount Recognized in the Statement of Financial Position1 | Gross Amounts Offset in the Statement of Financial Position | Net of Amounts Presented in the Statement of Financial Position | Gross Amounts Not Offset in the Statement of Financial Position | ||||||||||||||||||||
(Dollars in Thousands) | Commodity Contracts | Cash Collateral Received/Posted | Net Amount | ||||||||||||||||||||
Assets: | |||||||||||||||||||||||
Energy derivative contracts | $ | 18,421 | $ | — | $ | 18,421 | $ | (11,058 | ) | $ | — | $ | 7,363 | ||||||||||
Liabilities: | |||||||||||||||||||||||
Energy derivative contracts | 42,146 | — | 42,146 | (11,058 | ) | — | 31,088 | ||||||||||||||||
Puget Energy and Puget Sound Energy | |||||||||||||||||||||||
At December 31, 2017 | |||||||||||||||||||||||
Gross Amount Recognized in the Statement of Financial Position1 | Gross Amounts Offset in the Statement of Financial Position | Net of Amounts Presented in the Statement of Financial Position | Gross Amounts Not Offset in the Statement of Financial Position | ||||||||||||||||||||
(Dollars in Thousands) | Commodity Contracts | Cash Collateral Received/Posted | Net Amount | ||||||||||||||||||||
Assets: | |||||||||||||||||||||||
Energy derivative contracts | $ | 24,405 | $ | — | $ | 24,405 | $ | (17,940 | ) | $ | — | $ | 6,465 | ||||||||||
Liabilities: | |||||||||||||||||||||||
Energy derivative contracts | 86,094 | — | 86,094 | (17,940 | ) | (353 | ) | 67,801 | |||||||||||||||
_______________
1 | All derivative contract deals are executed under ISDA, NAESB and WSPP master netting agreements with right of set-off. |
21
The following table presents the effect and classification of the realized and unrealized gains (losses) of the Company's derivatives recorded on the statements of income:
Puget Energy and Puget Sound Energy | Three Months Ended September 30, | Nine Months Ended September 30, | ||||||||||||||
(Dollars in Thousands) | Classification | 2018 | 2017 | 2018 | 2017 | |||||||||||
Interest rate contracts1: | ||||||||||||||||
Non-hedged interest rate swap (expense) income | $ | — | $ | — | $ | — | $ | 28 | ||||||||
Gas for Power Derivatives: | ||||||||||||||||
Unrealized | Unrealized gain (loss) on derivative instruments, net | 8,503 | 903 | 16,172 | (20,979 | ) | ||||||||||
Realized | Electric generation fuel | (6,308 | ) | (6,753 | ) | (18,401 | ) | (14,773 | ) | |||||||
Power Derivatives: | ||||||||||||||||
Unrealized | Unrealized gain (loss) on derivative instruments, net | 5,543 | (880 | ) | 5,781 | (2,119 | ) | |||||||||
Realized | Purchased electricity | (4,803 | ) | (4,356 | ) | (10,028 | ) | (14,434 | ) | |||||||
Total gain (loss) recognized in income on derivatives | $ | 2,935 | $ | (11,086 | ) | $ | (6,476 | ) | $ | (52,277 | ) | |||||
_______________
1 Interest rate swap contracts were held at Puget Energy, and matured January 2017.
The Company is exposed to credit risk primarily through buying and selling electricity and natural gas to serve its customers. Credit risk is the potential loss resulting from a counterparty's non-performance under an agreement. The Company manages credit risk with policies and procedures for, among other things, counterparty credit analysis, exposure measurement, and exposure monitoring and mitigation.
The Company monitors counterparties for significant swings in credit default swap rates, credit rating changes by external rating agencies, ownership changes or financial distress. When deemed appropriate, the Company may request collateral or other security from its counterparties to mitigate potential credit default losses. Criteria employed in this decision include, among other things, the perceived creditworthiness of the counterparty and the expected credit exposure.
It is possible that volatility in energy commodity prices could cause the Company to have material credit risk exposure with one or more counterparties. If such counterparties fail to perform their obligations under one or more agreements, the Company could suffer a material financial loss. However, as of September 30, 2018, approximately 93.0% of the Company's energy portfolio exposure, excluding normal purchase normal sale (NPNS) transactions, was with counterparties that are rated investment grade by rating agencies and 7.0% are either rated below investment grade or not rated by rating agencies. The Company assesses credit risk internally for counterparties that are not rated by the major rating agencies.
The Company computes credit reserves at a master agreement level by counterparty. The Company considers external credit ratings and market factors in the determination of reserves, such as credit default swaps and bond spreads. The Company recognizes that external ratings may not always reflect how a market participant perceives a counterparty's risk of default. The Company uses both default factors published by Standard & Poor's and factors derived through analysis of market risk which reflect the application of an industry standard recovery rate. The Company selects a default factor by counterparty at an aggregate master agreement level based on a weighted average default tenor for that counterparty's deals. The default tenor is determined by weighting the fair value and contract tenors for all deals for each counterparty to derive an average value. The default factor used is dependent upon whether the counterparty is in a net asset or a net liability position after applying the master agreement levels.
The Company applies the counterparty's default factor to compute credit reserves for counterparties that are in a net asset position. The Company calculates a non-performance risk on its derivative liabilities by using its estimated incremental borrowing rate over the risk-free rate. Credit reserves are netted against the unrealized gain (loss) positions. As of September 30, 2018, the Company was in a net liability position with the majority of its counterparties, so the default factors of counterparties did not have a significant impact on reserves for the period. The majority of the Company's derivative contracts are with financial institutions and other utilities operating within the Western Electricity Coordinating Council. PSE also transacts power futures contracts on the Intercontinental Exchange (ICE) platform, which requires the daily posting of margin calls as collateral through a futures and clearing agent. As of September 30, 2018, PSE had cash posted as collateral of $4.0 million related to contracts executed on this platform. As additional contracts are executed on this exchange, the amount of collateral to be posted will increase, subject to PSE’s established limit. PSE also has a $1.0 million letter of credit posted as collateral as a condition of transacting on a physical energy exchange and clearing house in Canada. PSE did not trigger any collateral requirements with any of its counterparties nor
22
were any of PSE's counterparties required to post collateral resulting from credit rating downgrades during the nine months ended September 30, 2018.
The following table presents the aggregate fair value of all derivative instruments with credit-risk-related contingent features that are in a liability position and the amount of additional collateral the Company could be required to post:
Puget Energy and Puget Sound Energy | |||||||||||||||||||||||
(Dollars in Thousands) | At September 30, 2018 | At December 31, 2017 | |||||||||||||||||||||
Fair Value1 | Posted | Contingent | Fair Value1 | Posted | Contingent | ||||||||||||||||||
Contingent Feature | Liability | Collateral | Collateral | Liability | Collateral | Collateral | |||||||||||||||||
Credit rating2 | $ | 285 | $ | — | $ | 285 | $ | 3,187 | $ | — | $ | 3,187 | |||||||||||
Requested credit for adequate assurance | 18,511 | — | — | 37,374 | — | — | |||||||||||||||||
Forward value of contract3 | — | 4,028 | — | 353 | 2,639 | — | |||||||||||||||||
Total | $ | 18,796 | $ | 4,028 | $ | 285 | $ | 40,914 | $ | 2,639 | $ | 3,187 | |||||||||||
_______________
1 | Represents the derivative fair value of contracts with contingent features for counterparties in net derivative liability positions. Excludes NPNS, accounts payable and accounts receivable. |
2 | Failure by PSE to maintain an investment grade credit rating from each of the major credit rating agencies provides counterparties a contractual right to demand collateral. |
3 | Collateral requirements may vary, based on changes in the forward value of underlying transactions relative to contractually defined collateral thresholds. |
(5) | Fair Value Measurements |
ASC 820 established a fair value hierarchy that prioritizes the inputs used to measure fair value. The hierarchy categorizes the inputs into three levels with the highest priority given to unadjusted quoted prices in active markets for identical assets or liabilities (Level 1 measurement) and the lowest priority given to unobservable inputs (Level 3 measurement). The three levels of the fair value hierarchy are as follows:
Level 1 - Quoted prices are available in active markets for identical assets or liabilities as of the reporting date. Level 1 primarily consists of financial instruments such as exchange-traded derivatives and listed equities. Equity securities that are also classified as cash equivalents are considered Level 1 if there are unadjusted quoted prices in active markets for identical assets or liabilities.
Level 2 - Pricing inputs are other than quoted prices in active markets included in Level 1, which are either directly or indirectly observable as of the reporting date. Level 2 includes those financial instruments that are valued using models or other valuation methodologies. Instruments in this category include non-exchange-traded derivatives such as over-the-counter forwards and options.
Level 3 - Pricing inputs include significant inputs that have little or no observability as of the reporting date. These inputs may be used with internally developed methodologies that result in management's best estimate of fair value.
Financial assets and liabilities measured at fair value are classified in their entirety in the appropriate fair value hierarchy based on the lowest level of input that is significant to the fair value measurement. The Company's assessment of the significance of a particular input to the fair value measurement requires judgment and may affect the valuation of fair value assets and liabilities and their placement within the fair value hierarchy. The Company primarily determines fair value measurements classified as Level 2 or Level 3 using a combination of the income and market valuation approaches. The process of determining the fair values is the responsibility of the derivative accounting department which reports to the Controller and Principal Accounting Officer. Inputs used to estimate the fair value of forwards, swaps and options include market-price curves, contract terms and prices, credit-risk adjustments, and discount factors. Additionally, for options, the Black-Scholes option valuation model and implied market volatility curves are used. Inputs used to estimate fair value in industry-standard models are categorized as Level 2 inputs as substantially all assumptions and inputs are observable in active markets throughout the full term of the instruments. On a daily basis, the Company obtains quoted forward prices for the electric and natural gas markets from an independent external pricing service.
23
The Company considers its electric and natural gas contracts as Level 2 derivative instruments as such contracts are commonly traded as over-the-counter forwards with indirectly observable price quotes. However, certain energy derivative instruments with maturity dates falling outside the range of observable price quotes are classified as Level 3 in the fair value hierarchy. Management's assessment is based on the trading activity in real-time and forward electric and natural gas markets. Each quarter, the Company confirms the validity of pricing-service quoted prices used to value Level 2 commodity contracts with the actual prices of commodity contracts entered into during the most recent quarter.
Assets and Liabilities with Estimated Fair Value
The carrying values of cash and cash equivalents, restricted cash, and short-term debt as reported on the balance sheet are reasonable estimates of their fair value due to the short-term nature of these instruments and are classified as Level 1 in the fair value hierarchy. The carrying value of other investments totaling $49.2 million and $48.5 million at September 30, 2018 and December 31, 2017, respectively, are included in "Other property and investments" on the balance sheet. These values are also reasonable estimates of their fair value and classified as Level 2 in the fair value hierarchy as they are valued based on market rates for similar transactions.
The fair value of the junior subordinated and long-term notes was estimated using the discounted cash flow method with the U.S. Treasury yields and the Company's credit spreads as inputs, interpolating to the maturity date of each issue. The carrying values and estimated fair values were as follows:
Puget Energy | At September 30, 2018 | At December 31, 2017 | ||||||||||||||
(Dollars in Thousands) | Level | Carrying Value | Fair Value | Carrying Value | Fair Value | |||||||||||
Liabilities: | ||||||||||||||||
Junior subordinated notes | 2 | $ | — | $ | — | $ | 250,000 | $ | 238,935 | |||||||
Long-term debt (fixed-rate), net of discount1 | 2 | 5,507,690 | 6,444,215 | 5,105,329 | 6,520,515 | |||||||||||
Long-term debt (variable-rate) | 2 | 150,465 | 150,465 | 102,600 | 102,600 | |||||||||||
Total liabilities | $ | 5,658,155 | $ | 6,594,680 | $ | 5,457,929 | $ | 6,862,050 | ||||||||
Puget Sound Energy | At September 30, 2018 | At December 31, 2017 | ||||||||||||||
(Dollars in Thousands) | Level | Carrying Value | Fair Value | Carrying Value | Fair Value | |||||||||||
Liabilities: | ||||||||||||||||
Junior subordinated notes | 2 | $ | — | $ | — | $ | 250,000 | $ | 238,935 | |||||||
Long-term debt (fixed-rate), net of discount2 | 2 | 3,894,487 | 4,564,144 | 3,499,911 | 4,550,130 | |||||||||||
Total liabilities | $ | 3,894,487 | $ | 4,564,144 | $ | 3,749,911 | $ | 4,789,065 | ||||||||
_______________
1 | The carrying value includes debt issuances costs of $26.8 million and $27.9 million for September 30, 2018 and December 31, 2017, respectively, which are not included in fair value. |
2 | The carrying value includes debt issuances costs of $24.9 million and $24.6 million for September 30, 2018 and December 31, 2017, respectively, which are not included in fair value. |
24
Assets and Liabilities Measured at Fair Value on a Recurring Basis
The following table presents the Company's financial assets and liabilities by level, within the fair value hierarchy, that were accounted for at fair value on a recurring basis:
Puget Energy and | Fair Value | Fair Value | |||||||||||||||||||||
Puget Sound Energy | At September 30, 2018 | At December 31, 2017 | |||||||||||||||||||||
(Dollars in Thousands) | Level 2 | Level 3 | Total | Level 2 | Level 3 | Total | |||||||||||||||||
Assets: | |||||||||||||||||||||||
Electric derivative instruments | $ | 5,801 | $ | 2,428 | $ | 8,229 | $ | 9,866 | $ | 3,525 | $ | 13,391 | |||||||||||
Natural gas derivative instruments | 5,826 | 4,366 | 10,192 | 6,973 | 4,041 | 11,014 | |||||||||||||||||
Total assets | $ | 11,627 | $ | 6,794 | $ | 18,421 | $ | 16,839 | $ | 7,566 | $ | 24,405 | |||||||||||
Liabilities: | |||||||||||||||||||||||
Electric derivative instruments | $ | 20,884 | $ | 1,051 | $ | 21,935 | $ | 46,623 | $ | 2,427 | $ | 49,050 | |||||||||||
Natural gas derivative instruments | 19,021 | 1,190 | 20,211 | 34,926 | 2,118 | 37,044 | |||||||||||||||||
Total liabilities | $ | 39,905 | $ | 2,241 | $ | 42,146 | $ | 81,549 | $ | 4,545 | $ | 86,094 | |||||||||||
The following table presents the Company's reconciliation of the changes in the fair value of Level 3 derivatives in the fair value hierarchy:
Puget Energy and Puget Sound Energy | Three Months Ended September 30, | ||||||||||||||||||||||
(Dollars in Thousands) | 2018 | 2017 | |||||||||||||||||||||
Level 3 Roll-Forward Net Asset/(Liability) | Electric | Natural Gas | Total | Electric | Natural Gas | Total | |||||||||||||||||
Balance at beginning of period | $ | 2,009 | $ | 3,949 | $ | 5,958 | $ | 643 | $ | 1,456 | $ | 2,099 | |||||||||||
Changes during period: | |||||||||||||||||||||||
Realized and unrealized energy derivatives: | |||||||||||||||||||||||
Included in earnings1 | 67 | — | 67 | 2,458 | — | 2,458 | |||||||||||||||||
Included in regulatory assets / liabilities | — | 930 | 930 | — | 2,133 | 2,133 | |||||||||||||||||
Settlements | (945 | ) | (2,217 | ) | (3,162 | ) | (1,783 | ) | (1,301 | ) | (3,084 | ) | |||||||||||
Transferred into Level 3 | (150 | ) | — | (150 | ) | (1,668 | ) | — | (1,668 | ) | |||||||||||||
Transferred out of Level 3 | 396 | 514 | 910 | 1,760 | (34 | ) | 1,726 | ||||||||||||||||
Balance at end of period | $ | 1,377 | $ | 3,176 | $ | 4,553 | $ | 1,410 | $ | 2,254 | $ | 3,664 | |||||||||||
1 | Income Statement locations: Unrealized (gain) loss on derivative instruments, net. Amounts include unrealized gains (losses) on derivatives still held in position as of the reporting date for electric derivatives of $(0.1) million and $0.9 million for the three months ended September 30, 2018 and 2017, respectively. |
25
Puget Energy and Puget Sound Energy | Nine Months Ended September 30, | ||||||||||||||||||||||
(Dollars in Thousands) | 2018 | 2017 | |||||||||||||||||||||
Level 3 Roll-Forward Net Asset/(Liability) | Electric | Natural Gas | Total | Electric | Natural Gas | Total | |||||||||||||||||
Balance at beginning of period | $ | 1,098 | $ | 1,923 | $ | 3,021 | $ | 972 | $ | 625 | $ | 1,597 | |||||||||||
Changes during period: | |||||||||||||||||||||||
Realized and unrealized energy derivatives: | |||||||||||||||||||||||
Included in earnings1 | 2,052 | — | 2,052 | 3,503 | — | 3,503 | |||||||||||||||||
Included in regulatory assets / liabilities | — | 6,260 | 6,260 | — | 5,715 | 5,715 | |||||||||||||||||
Settlements | (1,599 | ) | (5,819 | ) | (7,418 | ) | (5,622 | ) | (4,605 | ) | (10,227 | ) | |||||||||||
Transferred into Level 3 | (1,987 | ) | — | (1,987 | ) | 523 | (553 | ) | (30 | ) | |||||||||||||
Transferred out of Level 3 | 1,813 | 812 | 2,625 | 2,034 | 1,072 | 3,106 | |||||||||||||||||
Balance at end of period | $ | 1,377 | $ | 3,176 | $ | 4,553 | $ | 1,410 | $ | 2,254 | $ | 3,664 | |||||||||||
______________
1 | Income Statement locations: Unrealized (gain) loss on derivative instruments, net. Amounts include unrealized gains (losses) on derivatives still held in position as of the reporting date for electric derivatives of $1.4 million and $1.9 million for the nine months ended September 30, 2018 and 2017, respectively. |
Realized gains and losses on energy derivatives for Level 3 recurring items are included in energy costs in the Company's consolidated statements of income under purchased electricity, electric generation fuel or purchased natural gas when settled. Unrealized gains and losses on energy derivatives for Level 3 recurring items are included in net unrealized (gain) loss on derivative instruments in the Company's consolidated statements of income.
In order to determine which assets and liabilities are classified as Level 3, the Company receives market data from its independent external pricing service defining the tenor of observable market quotes. To the extent any of the Company's commodity contracts extend beyond what is considered observable, as defined by its independent pricing service, the contracts are classified as Level 3. The actual tenor of what the independent pricing service defines as observable is subject to change depending on market conditions. Therefore, as the market changes, the same contract may be designated Level 3 one month and Level 2 the next and vice versa. The changes of fair value classification into or out of Level 3 are recognized each month and reported in the Level 3 Roll-Forward tables. The Company did not have any transfers between Level 1 and Level 2 during the reported periods. The Company does periodically transact at locations or market price points that are illiquid or for which no prices are available from the independent pricing service. In such circumstances, the Company uses a more liquid price point and performs a 15-month regression against the illiquid locations to serve as a proxy for forward market prices. Such transactions are classified as Level 3. The Company does not use internally developed models to make adjustments to significant unobservable pricing inputs. The only significant unobservable input into the fair value measurement of the Company's Level 3 assets and liabilities is the forward price for electric and natural gas contracts.
The following table presents the forward price ranges for the Company's Level 3 commodity contracts as of September 30, 2018:
Puget Energy and Puget Sound Energy | Fair Value | Range | |||||||||||||||||||||
(Dollars in Thousands) | Assets1 | Liabilities1 | Valuation Technique | Unobservable Input | Low | High | Weighted Average | ||||||||||||||||
Electric | $ | 2,428 | $ | 1,051 | Discounted cash flow | Power prices (per MWh) | $ | 8.85 | $ | 46.15 | $ | 25.48 | |||||||||||
Natural gas | $ | 4,366 | $ | 1,190 | Discounted cash flow | Natural gas prices (per MMBtu) | $ | 2.20 | $ | 2.93 | $ | 2.57 | |||||||||||
_______________
1 | The valuation techniques, unobservable inputs and ranges are the same for asset and liability positions. |
26
The following table presents the forward price ranges for the Company's Level 3 commodity contracts as of December 31, 2017:
Puget Energy and Puget Sound Energy | Fair Value | Range | |||||||||||||||||||||
(Dollars in Thousands) | Assets1 | Liabilities1 | Valuation Technique | Unobservable Input | Low | High | Weighted Average | ||||||||||||||||
Electric | $ | 3,525 | $ | 2,427 | Discounted cash flow | Power prices (per MWh) | $ | 7.02 | $ | 28.94 | $ | 18.61 | |||||||||||
Natural gas | $ | 4,041 | $ | 2,118 | Discounted cash flow | Natural gas prices (per MMBtu) | $ | 1.22 | $ | 2.80 | $ | 1.54 | |||||||||||
____________
1 | The valuation techniques, unobservable inputs and ranges are the same for asset and liability positions. |
The significant unobservable inputs listed above would have a direct impact on the fair values of the above instruments if they were adjusted. Consequently, significant increases or decreases in the forward prices of electricity or natural gas in isolation would result in a significantly higher or lower fair value for Level 3 assets and liabilities. Generally, interrelationships exist between market prices of natural gas and power. As such, an increase in natural gas pricing would potentially have a similar impact on forward power markets. At September 30, 2018 and December 31, 2017, a hypothetical 10.0% increase or decrease in market prices of natural gas and electricity would change the fair value of the Company's derivative portfolio, classified as Level 3 within the fair value hierarchy, by $0.8 million and $0.9 million, respectively.
Long-Lived Assets Measured at Fair Value on a Nonrecurring Basis
Puget Energy records the fair value of its intangible assets in accordance with ASC 360, “Property, Plant, and Equipment,” (ASC 360). The fair value assigned to the power contracts was determined using an income approach comparing the contract rate to the market rate for power over the remaining period of the contracts incorporating non-performance risk. Management also incorporated certain assumptions related to quantities and market presentation that it believes market participants would make in the valuation. The fair value of the power contracts is amortized as the contracts settle.
ASC 360 requires long-lived assets to be tested for impairment on an annual basis, and upon the occurrence of any events or circumstances that would be more likely than not to reduce the fair value of the long-lived assets below their carrying value. One such triggering event is a significant decrease in the forward market prices of power.
As of September 30, 2018, Puget Energy completed valuation and impairment testing of its power purchase contracts classified as intangible assets and found no impairment. As of March 31, 2018, the Wells Hydro contract was determined to be impaired due to a decrease in forward prices for this contract of 39.0% from December 31, 2017, causing an impairment of $1.9 million.
The following table presents the impairment recorded to the Company's intangible asset contracts, with corresponding reductions to the regulatory liability:
Puget Energy | ||||||||||||
(Dollars in Thousands) | ||||||||||||
Valuation Date | Contract Name | Carrying Value | Fair Value | Write Down | ||||||||
March 31, 2018 | Wells Hydro | $ | 4,302 | $ | 2,395 | $ | 1,907 | |||||
The valuations were measured using a discounted cash flow, income-based valuation methodology. Significant inputs included forward electricity prices and power contract pricing which provided future net cash flow estimates classified as Level 3 within the fair value hierarchy. A less significant input is the discount rate reflective of PSE's cost of capital used in the valuation.
The following table presents the significant unobservable inputs used in estimating the impaired long-term power purchase contracts' fair value:
Puget Energy | ||||||||||||
Valuation Date | Unobservable Input | Low | High | Average | ||||||||
March 31, 2018 | Power prices (per MWh) | $ | 9.69 | $ | 25.30 | $ | 17.50 | |||||
Power contract costs per quarter (in thousands) | $ | 4,126 | $ | 4,126 | $ | 4,126 | ||||||
27
(6) | Retirement Benefits |
PSE has a defined benefit pension plan (Qualified Pension Benefits) covering a substantial majority of PSE employees. Pension benefits earned are a function of age, salary, years of service and, in the case of employees in the cash balance formula plan, the applicable annual interest crediting rates. Starting January 1, 2014, all United Association of Journeyman and Apprentices of the Plumbing and Pipefitting Industry (UA) represented employees will receive annual employer contributions of 4.0% of eligible pay each year in the cash balance formula plan of the defined benefit pension. Starting January 1, 2014, for non-represented employees, and December 12, 2014 for employees represented by the IBEW, participants will receive annual employer contributions of 4.0% of eligible pay each year in the cash balance formula of the defined benefit pension or 401k plan account. Those employees receiving contributions in the cash balance formula plan also receive interest credits, which are at least 1.0% per quarter. When an employee with a vested cash balance formula benefit leaves PSE, they will have annuity and lump sum options for distribution. PSE also maintains a non-qualified supplemental executive retirement plan (SERP) for its key senior management employees.
In addition to providing pension benefits, PSE provides legacy group health care and life insurance benefits (Other Benefits) for certain retired employees. These benefits are provided principally through an insurance company. The insurance premiums, paid primarily by retirees, are based on the benefits provided during the prior year. Puget Energy's retirement plans were re-measured as a result of the merger in 2009, which represents the difference between Puget Energy and PSE's retirement plans.
In March 2017, the FASB issued ASU 2017-07, requiring that an employer report the service cost component in the same line items as other compensation costs arising from services rendered by the pertinent employees during the period. The other components of net benefit cost (which include interest costs, expected return on plan assets, amortization of prior service cost or credits and actuarial gains and losses) are required to be presented in the income statement separately from the service cost component and outside a subtotal of income from operations. The Company has included in the consolidated statements of income: (i) the components of service cost within utility operations and maintenance for PSE and within non-utility expense and other for Puget Energy, and (ii) all non-service cost components in other income.
28
The following tables summarize the Company’s net periodic benefit cost for the three and nine months ended September 30, 2018 and 2017:
Puget Energy | Qualified Pension Benefits | SERP Pension Benefits | Other Benefits | ||||||||||||||||||||
Three Months Ended September 30, | |||||||||||||||||||||||
(Dollars in Thousands) | 2018 | 2017 | 2018 | 2017 | 2018 | 2017 | |||||||||||||||||
Components of net periodic benefit cost: | |||||||||||||||||||||||
Service cost | $ | 6,218 | $ | 5,020 | $ | 212 | $ | 228 | $ | 17 | $ | 18 | |||||||||||
Interest cost | 6,917 | 7,093 | 530 | 571 | 113 | 125 | |||||||||||||||||
Expected return on plan assets | (12,533 | ) | (11,945 | ) | — | — | (119 | ) | (115 | ) | |||||||||||||
Amortization of prior service cost | (495 | ) | (495 | ) | 11 | 11 | — | — | |||||||||||||||
Amortization of net loss (gain) | 716 | — | 394 | 269 | (80 | ) | (101 | ) | |||||||||||||||
Net periodic benefit cost | $ | 823 | $ | (327 | ) | $ | 1,147 | $ | 1,079 | $ | (69 | ) | $ | (73 | ) | ||||||||
Puget Energy | Qualified Pension Benefits | SERP Pension Benefits | Other Benefits | ||||||||||||||||||||
Nine Months Ended September 30, | |||||||||||||||||||||||
(Dollars in Thousands) | 2018 | 2017 | 2018 | 2017 | 2018 | 2017 | |||||||||||||||||
Components of net periodic benefit cost: | |||||||||||||||||||||||
Service cost | $ | 17,068 | $ | 15,060 | $ | 635 | $ | 685 | $ | 52 | $ | 54 | |||||||||||
Interest cost | 20,477 | 21,279 | 1,590 | 1,714 | 333 | 375 | |||||||||||||||||
Expected return on plan assets | (37,652 | ) | (35,837 | ) | — | — | (354 | ) | (346 | ) | |||||||||||||
Amortization of prior service cost | (1,485 | ) | (1,485 | ) | 33 | 33 | — | — | |||||||||||||||
Amortization of net loss (gain) | 1,640 | — | 1,185 | 807 | (252 | ) | (302 | ) | |||||||||||||||
Net periodic benefit cost | $ | 48 | $ | (983 | ) | $ | 3,443 | $ | 3,239 | $ | (221 | ) | $ | (219 | ) | ||||||||
Puget Sound Energy | Qualified Pension Benefits | SERP Pension Benefits | Other Benefits | |||||||||||||||||||||
Three Months Ended September 30, | ||||||||||||||||||||||||
(Dollars in Thousands) | 2018 | 2017 | 2018 | 2017 | 2018 | 2017 | ||||||||||||||||||
Components of net periodic benefit cost: | ||||||||||||||||||||||||
Service cost | $ | 6,218 | $ | 5,020 | $ | 212 | $ | 228 | $ | 17 | $ | 18 | ||||||||||||
Interest cost | 6,917 | 7,093 | 530 | 571 | 113 | 125 | ||||||||||||||||||
Expected return on plan assets | (12,542 | ) | (11,965 | ) | — | — | (119 | ) | (115 | ) | ||||||||||||||
Amortization of prior service cost | (393 | ) | (393 | ) | 11 | 11 | — | — | ||||||||||||||||
Amortization of net loss (gain) | 3,928 | 3,262 | 517 | 392 | (134 | ) | (160 | ) | ||||||||||||||||
Net periodic benefit cost | $ | 4,128 | $ | 3,017 | $ | 1,270 | $ | 1,202 | $ | (123 | ) | $ | (132 | ) | ||||||||||
29
Puget Sound Energy | Qualified Pension Benefits | SERP Pension Benefits | Other Benefits | ||||||||||||||||||||
Nine Months Ended September 30, | |||||||||||||||||||||||
(Dollars in Thousands) | 2018 | 2017 | 2018 | 2017 | 2018 | 2017 | |||||||||||||||||
Components of net periodic benefit cost: | |||||||||||||||||||||||
Service cost | $ | 17,068 | $ | 15,060 | $ | 635 | $ | 685 | $ | 52 | $ | 54 | |||||||||||
Interest cost | 20,477 | 21,279 | 1,590 | 1,714 | 333 | 375 | |||||||||||||||||
Expected return on plan assets | (37,680 | ) | (35,896 | ) | — | — | (354 | ) | (346 | ) | |||||||||||||
Amortization of prior service cost | (1,180 | ) | (1,180 | ) | 33 | 33 | — | — | |||||||||||||||
Amortization of net loss (gain) | 11,188 | 9,786 | 1,552 | 1,175 | (417 | ) | (480 | ) | |||||||||||||||
Net periodic benefit cost | $ | 9,873 | $ | 9,049 | $ | 3,810 | $ | 3,607 | $ | (386 | ) | $ | (397 | ) | |||||||||
The following table summarizes the Company’s change in benefit obligation for the periods ended September 30, 2018 and December 31, 2017:
Puget Energy and Puget Sound Energy | Qualified Pension Benefits | SERP Pension Benefits | Other Benefits | ||||||||||||||||||||
Nine Months Ended | Year Ended | Nine Months Ended | Year Ended | Nine Months Ended | Year Ended | ||||||||||||||||||
(Dollars in Thousands) | September 30, 2018 | December 31, 2017 | September 30, 2018 | December 31, 2017 | September 30, 2018 | December 31, 2017 | |||||||||||||||||
Change in benefit obligation: | |||||||||||||||||||||||
Benefit obligation at beginning of period | $ | 700,481 | $ | 652,607 | $ | 55,754 | $ | 51,734 | $ | 11,454 | $ | 11,194 | |||||||||||
Service cost | 17,068 | 20,081 | 635 | 913 | 52 | 72 | |||||||||||||||||
Interest cost | 20,477 | 28,373 | 1,590 | 2,285 | 333 | 500 | |||||||||||||||||
Actuarial loss (gain) | 3,991 | 40,945 | — | 2,722 | 82 | 725 | |||||||||||||||||
Benefits paid | (33,183 | ) | (40,594 | ) | (1,561 | ) | (1,900 | ) | (816 | ) | (1,137 | ) | |||||||||||
Medicare part D subsidy received | — | — | — | — | 85 | 100 | |||||||||||||||||
Administrative Expense | — | (931 | ) | — | — | — | — | ||||||||||||||||
Benefit obligation at end of period | $ | 708,834 | $ | 700,481 | $ | 56,418 | $ | 55,754 | $ | 11,190 | $ | 11,454 | |||||||||||
The aggregate expected contributions by the Company to fund the qualified pension plan, SERP and the other postretirement plans for the year ending December 31, 2018 are expected to be at least $18.0 million, $5.5 million and $0.3 million, respectively. During the three months ended September 30, 2018, the Company contributed $4.5 million and $0.5 million to fund the qualified pension plan and SERP, respectively. During the nine months ended September 30, 2018, the Company contributed $13.5 million and $1.6 million to fund the qualified pension plan and SERP, respectively. The Company contributed an immaterial amount to fund the other postretirement plans.
30
(7) Regulation and Rates
General Rate Case Filing
In January 2017, PSE filed its general rate case (GRC) with the Washington Commission. The GRC filing included a required plan to address Colstrip Units 1 and 2 closures, requested that electric energy supply fixed costs be included in PSE's decoupling mechanism, and contained requests for two new mechanisms to address regulatory lag. The Washington Commission entered a final order accepting the multi-party settlement agreement and determined the contested issues in the case on December 5, 2017 and new rates became effective December 19, 2017. The settlement agreement provides for a weighted cost of capital of 7.6% or 6.55% after-tax, and a capital structure of 48.5% in common equity with a return on equity of 9.5%. The settlement also resulted in a combined electric tariff change that resulted in a net increase of $20.2 million, or 0.9%, annually, and a combined natural gas tariff change that resulted in a net decrease of $35.5 million, or 3.8%, annually.
The GRC also re-purposed the benefit of PTCs and hydro-related treasury grants to fund and recover decommissioning and remediation costs for Colstrip Units 1 and 2. As the Company monetizes PTCs on its filed tax returns, the regulatory liability is transferred to a reserve for Colstrip Units 1 and 2 decommissioning and remediation costs.
For further details regarding the 2017 GRC filing, see Note 3, "Regulation and Rates" to the consolidated financial statements included in Item 8 of the Company’s Form 10-K for the period ended December 31, 2017.
Decoupling Filings
While fluctuations in weather conditions will continue to affect PSE's billed revenue and energy supply expenses from month to month, PSE's decoupling mechanisms assist in mitigating the impact of weather on operating revenue and net income. Since July 2013, the Washington Commission has allowed PSE to record a monthly adjustment to its electric and natural gas operating revenues related to electric transmission and distribution, natural gas operations and general administrative costs from most residential, commercial and industrial customers to mitigate the effects of abnormal weather, conservation impacts and changes in usage patterns per customer. As a result, these electric and natural gas revenues are recovered on a per customer basis regardless of actual consumption levels. PSE's energy supply costs, which are part of the PCA and PGA mechanisms, are not included in the decoupling mechanism. The revenue recorded under the decoupling mechanisms will be affected by customer growth and not actual consumption. During the rate plan, which ended in December 2017, the allowed decoupling revenue per customer for the recovery of delivery system costs increased by 3.0% for the electric customers and 2.2% for the natural gas customers on January 1 of each year. Following each calendar year, PSE will recover from, or refund to, customers the difference between allowed decoupling revenue and the corresponding actual revenue during the following May to April time period.
On December 5, 2017, the Washington Commission approved PSE’s request within the 2017 GRC to extend the decoupling mechanism with several changes to the methodology that took effect on December 19, 2017. Electric and natural gas delivery revenues continue to be recovered on a per customer basis and electric fixed production energy costs are now decoupled and recovered on the basis of a fixed monthly amount. The allowed decoupling revenue for electric and natural gas customers will no longer increase annually each January 1 as occurred prior to December 19, 2017. Approved revenue per customer costs can only be changed in a GRC or expedited rate filing (ERF). Approved electric fixed production energy costs can also be changed in a power cost only rate case (PCORC). Other changes to the decoupling methodology approved by the Washington Commission include regrouping of electric and natural gas non-residential customers and the exclusion of certain electric schedules from the decoupling mechanism going forward. The rate test which limits the amount of revenues PSE can collect in its annual filings increased from 3.0% to 5.0% for natural gas customers but will remain at 3.0% for electric customers. The decoupling mechanism will be reviewed again in PSE’s first rate case filed in or after 2021, or in a separate proceeding, if appropriate.
On September 30, 2018, PSE performed an analysis to determine if electric and natural gas decoupling revenue deferrals would be collected from customers within 24 months of the annual period, per ASC 980. If not, for GAAP purposes only, PSE would need to record a reserve against the decoupling revenue and regulatory asset balance. Once the revenue is forecasted to be collected within 24 months, the reserve can be reversed. The analysis indicated that $0.3 million of electric deferred revenue will not be collected within 24 months of the annual period; therefore, an adjustment was booked to 2018 decoupling revenue. The previously unrecognized decoupling deferrals of $20.8 million at December 31, 2016, was recognized as decoupling revenue in nine months ended September 30, 2017.
31
Electric Regulation and Rates
Storm Damage Deferral Accounting
The Washington Commission issued a GRC order that defined deferrable storm events and provided that costs in excess of the annual cost threshold may be deferred for qualifying storm damage costs that meet the modified Institute of Electrical and Electronics Engineers outage criteria for system average interruption duration index. For the nine months ended September 30, 2018, PSE incurred $8.9 million in storm-related electric transmission and distribution system restoration costs, of which no current year amount was deferred to a regulatory asset. This compares to $21.1 million incurred in storm-related electric transmission and distribution system restoration costs for the nine months ended September 30, 2017, of which $12.4 million was deferred to a regulatory asset. Under the December 5, 2017 Washington Commission order regarding PSE’s GRC, the following changes to PSE’s storm deferral mechanism were approved: (i) the cumulative annual cost threshold for deferral of storms under the mechanism increased from $8.0 million to $10.0 million effective January 1, 2018; and (ii) qualifying events where the total qualifying cost is less than $0.5 million will not qualify for deferral and these costs will also not count toward the $10.0 million annual cost threshold.
Washington Commission Tax Deferral Filing
The TCJA was signed into law in December 2017. As a result of this change, PSE re-measured its deferred tax balances under the new corporate tax rate. PSE filed an accounting petition on December 29, 2017 requesting deferred accounting treatment for the impacts of tax reform. The requested deferral accounting treatment results in the tax rate change being captured in the deferred income tax balance with an offset to the regulatory liability for deferred income taxes. Additionally, on March 30, 2018, PSE filed for a rate change for electric and natural gas customers associated with TCJA to reflect the decrease in the federal corporate income tax rate from 35.0% to 21.0%. The rate change filing did not address excess deferred taxes or the deferred balance associated with the over-collection of income tax expense of $34.6 million for the period January 1 through April 30, 2018 (the time period that encompasses the effective date of the TCJA through May 1, 2018, the effective date of the rate change). The $34.6 million tax over-collection decreased PSE's revenue and increased the regulatory liability for a refund to customers. PSE proposed in the rate change filing to address both the excess deferred taxes and the deferred balance associated with the over-collection of income tax expense in PSE’s accounting petition. The overall impact of the rate change, based on the annual period from May 2018 through April 2019, is a revenue decrease of $72.9 million, or 3.4% for electric and $23.6 million, or 2.7% for natural gas.
32
(8) Commitments and Contingencies
Colstrip
PSE has a 50% ownership interest in Colstrip Units 1 and 2 and a 25% interest in Colstrip Units 3 and 4. On March 6, 2013, the Sierra Club and the Montana Environmental Information Center filed a Clean Air Act citizen suit against all Colstrip owners in the U.S. District Court, District of Montana. On July 12, 2016, PSE reached a settlement with the Sierra Club to dismiss all of the Clean Air Act allegations against the Colstrip Generating Station, which was approved by the court on September 6, 2016. As part of the settlement that was signed by all Colstrip owners, Colstrip 1 and 2 owners, PSE and Talen Energy, agreed to retire the two oldest units (Units 1 and 2) no later than July 1, 2022. The Washington Commission allows full recovery in rates of the net book value (NBV) at retirement and related decommissioning costs consistent with prior precedents.
Depreciation rates were updated in the GRC effective December 19, 2017, where PSE's depreciation increased for Colstrip Units 1 and 2 to recover plant costs to the expected shutdown date. The increase in depreciation caused the Colstrip Units 1 and 2 regulatory asset to be reduced to $129.9 million and $127.6 million as of September 30, 2018 and December 31, 2017, respectively. However, the full scope of decommissioning activities and costs may vary from the estimates that are available at this time. The GRC also repurposed PTCs and hydro-related treasury grants to fund and recover decommissioning and remediation costs for Colstrip Units 1 and 2. Additionally, PSE will accelerate the depreciation of Colstrip Units 3 and 4, per the terms of the GRC settlement, to December 31, 2027.
Greenwood
On March 9, 2016, a natural gas explosion occurred in the Greenwood neighborhood of Seattle, WA, damaging multiple structures. The Washington Commission Staff completed its investigation of the incident and filed a complaint on September 20, 2016. On March 28, 2017, pipeline safety regulators and PSE reached a settlement in response to the complaint. As part of the agreement, PSE agreed to pay a penalty of $1.5 million, and is currently implementing a comprehensive inspection and remediation program. However, litigation is still pending regarding damage and personal injury claims.
Other Commitments and Contingencies
There have been no material changes to the contractual obligations and consolidated commercial commitments disclosed in Note 15, "Commitments and Contingencies" to the consolidated financial statements included in Item 8 of the Company's Form 10-K for the period ended December 31, 2017.
(9) Other
Long-Term Debt
On June 4, 2018, PSE issued $600.0 million of 30-year Senior Notes under its senior note indenture at an interest rate of 4.223% with a maturity date of June 15, 2048. The proceeds from the issuance were used to pay the principal and accrued interest on the Company’s $200.0 million Secured Notes that matured on June 15, 2018, outstanding commercial paper borrowings of $348.0 million and other general corporate expenses.
On October 1, 2018, Puget Energy entered into a $150.0 million, three-year term loan agreement with a small group of banks. The agreement allows Puget Energy to borrow at either the banks' prime rate or at LIBOR plus a spread based on credit rating. The Term Loan Agreement also includes an expansion feature, pursuant to which Puget Energy may request to increase the aggregate amount of the Term Loan Agreement, obtain incremental term loans or any combination of increases and incremental term loans in an amount up to $100.0 million. The proceeds from the term loan will be used to repay borrowings under the revolving credit facility, which carries a higher interest rate.
33
Item 2. Management's Discussion and Analysis of Financial Condition and Results of Operations
The following discussion and analysis should be read in conjunction with the financial statements and related notes thereto included elsewhere in this report on Form 10-Q. The discussion contains forward-looking statements that involve risks and uncertainties, such as Puget Energy, Inc. (Puget Energy) and Puget Sound Energy, Inc. (PSE) objectives, expectations and intentions. Words or phrases such as “anticipates,” “believes,” “continues,” “could,” “estimates,” “expects,” “future,” “intends,” “may,” “might,” “plans,” “potential,” “predicts,” “projects,” “should,” “will likely result,” “will continue” and similar expressions are intended to identify certain of these forward-looking statements. However, these words are not the exclusive means of identifying such statements. In addition, any statements that refer to expectations, projections or other characterizations of future events or circumstances are forward-looking statements. Readers are cautioned not to place undue reliance on these forward-looking statements, which speak only as of the date of this report. Puget Energy's and PSE's actual results could differ materially from results that may be anticipated by such forward-looking statements. Factors that could cause or contribute to such differences include, but are not limited to, those discussed in the section entitled “Forward-Looking Statements” included elsewhere in this report and in the section entitled "Risk Factors" included in Part I, Item 1A in Puget Energy's and Puget Sound Energy's Form 10-K for the period ended December 31, 2017. Except as required by law, neither Puget Energy nor PSE undertakes any obligation to revise any forward-looking statements in order to reflect events or circumstances that may subsequently arise. Readers are urged to carefully review and consider the various disclosures made in this report and in Puget Energy's and PSE's other reports filed with the U.S. Securities and Exchange Commission (SEC) that attempt to advise interested parties of the risks and factors that may affect Puget Energy's and PSE's business, prospects and results of operations.
Overview
Puget Energy is an energy services holding company and substantially all of its operations are conducted through its subsidiary PSE, a regulated electric and natural gas utility company. PSE is the largest electric and natural gas utility in the state of Washington, primarily engaged in the business of electric transmission, distribution and generation and natural gas distribution. Puget Energy's business strategy is to generate stable cash flows by offering reliable electric and natural gas service in a cost-effective manner through PSE. Puget Energy also has a wholly-owned non-regulated subsidiary, Puget LNG, LLC (Puget LNG), which has the sole purpose of owning, developing and financing the non-regulated activity of the Tacoma LNG facility, currently under construction. All of Puget Energy's common stock is indirectly owned by Puget Holdings, LLC (Puget Holdings). Puget Holdings is owned by a consortium of long-term infrastructure investors including Macquarie Infrastructure Partners, Macquarie Capital Group Limited, the Canada Pension Plan Investment Board, the British Columbia Investment Management Corporation, and the Alberta Investment Management Corporation. In August 2018, Macquarie Infrastructure Partners and Macquarie Capital Group Limited reached an agreement to sell their shares to Ontario Municipal Employee Retirement System, PGGM and current owners, Alberta Investment Management Corporation and British Columbia Investment Management Corporation. The sale is conditioned upon the approval of various federal and state agencies, including that of the Washington Commission. Puget Energy and PSE are collectively referred to herein as “the Company.”
PSE generates revenue and cash flow primarily from the sale of electric and natural gas services to residential and commercial customers within a service territory covering approximately 6,000 square miles, principally in the Puget Sound region of the state of Washington. PSE continually balances its load requirements, generation resources, purchase power agreements, and market purchases to meet customer demand. The Company's external financing requirements principally reflect the cash needs of its construction program, its schedule of maturing debt and certain operational needs. PSE requires access to bank and capital markets to meet its financing needs.
34
Factors and Trends Affecting PSE's Performance
The principal business, economic and other factors that affect PSE's operations and financial performance include:
• | The rates PSE is allowed to charge for its services; |
• | PSE’s ability to recover power costs that are included in rates which are based on volume; |
• | Weather conditions, including the impact of temperature on customer load; the impact of extreme weather events on budgeted maintenance costs; meteorological conditions such as snow-pack, stream-flow and wind-speed which affect power generation, supply and price; |
• | Regulatory decisions allowing PSE to recover purchased power and fuel costs, on a timely basis; |
• | PSE’s ability to supply electricity and natural gas, either through company-owned generation, purchase power contracts or by procuring natural gas or electricity in wholesale markets; |
• | Equal sharing between PSE and its customers of earnings which exceed PSE's authorized rate of return (ROR); |
• | Availability and access to capital and the cost of capital; |
• | Regulatory compliance costs, including those related to new and developing federal regulations of electric system reliability, state regulations of natural gas pipelines and federal, state and local environmental laws and regulations; |
• | Wholesale commodity prices of electricity and natural gas; |
• | Increasing capital expenditures with additional depreciation and amortization; |
• | Tax reform, the effect of lower tax rates, and regulatory treatment of excess deferred tax balances on rate base and customer rates; |
• | General economic conditions in PSE's service territory and its effects on customer growth and use-per-customer; and |
• | Federal, state, and local taxes. |
Further detail regarding the factors and trends affecting performance of the Company during the fiscal quarter ended September 30, 2018 is set forth below in this "Overview" section as well as in other sections of Management's Discussion and Analysis.
Regulation of PSE Rates and Recovery of PSE Costs
PSE's regulatory requirements and operational needs require the investment of substantial capital in 2018 and future years. As PSE intends to seek recovery of these investments through the regulatory process, its financial results depend heavily upon sufficient outcomes from that process. The rates that PSE is allowed to charge for its services influence its financial condition, results of operations and liquidity. PSE is highly regulated and the rates that it charges its retail customers are approved by the Washington Utilities and Transportation Commission (Washington Commission). The Washington Commission has traditionally required these rates be determined based, to a large extent, on historic test year costs plus weather normalized assumptions about hydroelectric conditions and power costs in the relevant rate year. Incremental customer growth and sales typically have not provided sufficient revenue to cover general cost increases over time due to the combined effects of regulatory lag and attrition. Accordingly, the Company will need to seek rate relief through a rate case on a regular and frequent basis in the foreseeable future after the investment is made. In addition, the Washington Commission determines whether the Company's expenses and capital investments are reasonable and prudent for the provision of cost-effective, reliable and safe electric and natural gas service. If the Washington Commission determines that a capital investment is not reasonable or prudent, the costs (including return on any resulting rate base) related to such capital investment may be disallowed, partially or entirely, and not recovered in rates.
Washington state law also requires PSE to pursue electric conservation that is cost-effective, reliable and feasible. PSE’s mandate to pursue electric conservation initiatives may have a negative impact on the electric business financial performance due to lost margins from lower sales volumes as variable power costs are not part of the decoupling mechanism. Although not specified by Washington state law, the Washington Commission also sets natural gas conservation achievement standards for PSE. The effects of achieving these standards will, however, have only a slight negative impact on natural gas business financial performance due to the natural gas business being almost fully decoupled.
General Rate Case Filing
In January 2017, PSE filed its general rate case (GRC) with the Washington Commission. The Washington Commission entered a final order accepting the multi-party settlement agreement and determined the contested issues in the case on December 5, 2017 and new rates became effective December 19, 2017. For further details regarding the 2017 GRC filing, see Note 3, "Regulation and Rates" to the consolidated financial statements included in Item 8 of the Company's Form 10-K for the period ended December 31, 2017.
35
Washington Commission Tax Deferral Filing
The TCJA was signed into law in December 2017. As a result of this change, PSE re-measured its deferred tax balances under the new corporate tax rate. PSE filed an accounting petition on December 29, 2017 requesting deferred accounting treatment for the impacts of tax reform. The deferral accounting treatment results in the tax rate change being captured in the deferred income tax balance with an offset to the regulatory liability for deferred income taxes. Additionally, on March 30, 2018, PSE filed for a rate change for electric and natural gas customers associated with TCJA to reflect the decrease in the federal corporate income tax rate from 35% to 21%. The rate change filing did not address excess deferred taxes or the deferred balance associated with the over collection of income tax expense for the period January 1 through April 30, 2018 (the time period that encompasses the effective date of the TCJA through May 1, 2018, the requested effective date of the rate change). PSE proposed in the rate change filing to address both the excess deferred taxes and the deferred balance associated with the over collection of income tax expense in PSE’s accounting petition.
The Washington Commission approved the following PSE requests to change rates to reflect the new corporate tax rates:
Effective Date | Average Percentage Increase (Decrease) in Rates | Increase (Decrease) in Revenue (Dollars in Millions) | |
Electric: | |||
May 1, 2018 | (3.4)% | $(72.9) | |
Natural Gas: | |||
May 1, 2018 | (2.7) | (23.6) | |
Decoupling Filings
On December 5, 2017, the Washington Commission approved PSE’s request within the 2017 GRC to extend the decoupling mechanism with some changes to the methodology that took effect on December 19, 2017. Electric and natural gas delivery revenues will continue to be recovered on a per customer basis and electric fixed production energy costs will now be decoupled and recovered on the basis of a fixed monthly amount. The allowed decoupling revenue for electric and natural gas customers will no longer increase annually each January 1 as occurred prior to December 19, 2017. Approved revenue per customer costs can only be changed in a GRC or expedited rate filing (ERF). Approved electric fixed production energy costs can also be changed in a power cost only rate case (PCORC). Other changes to the decoupling methodology approved by the Washington Commission include regrouping of electric and natural gas non-residential customers and the exclusion of certain electric schedules from the decoupling mechanism going forward. The rate cap which limits the amount of revenues PSE can collect in its annual filings increased from 3.0% to 5.0% for natural gas customers but will remain at 3.0% for electric customers. The decoupling mechanism is to be reviewed again in PSE's first GRC filed in or after 2021, or in a separate proceeding, if appropriate.
36
The Washington Commission approved the following PSE requests to change rates for prior deferrals under its electric and natural gas decoupling mechanisms:
Effective Date | Average Percentage Increase (Decrease) in Rates | Increase (Decrease) in Revenue (Dollars in Millions)1 | |
Electric: | |||
May 1, 2018 | (1.1)% | $(25.2) | |
May 1, 2017 | 2.0 | 41.9 | |
May 1, 2016 | 1.0 | 20.8 | |
Natural Gas: | |||
May 1, 2018 | 1.7% | $15.9 | |
May 1, 2017 | 2.4 | 22.4 | |
May 1, 2016 | 2.8 | 25.4 | |
_______________
1 | The increase in revenue is net of reductions from excess earnings of $10.0 million for electric and $4.9 million for natural gas effective May 1, 2018, $11.9 million for electric and $2.2 million for natural gas effective May 1, 2017, and $11.9 million for electric and $5.5 million for natural gas effective May 1, 2016. |
Electric Rates
Power Cost Adjustment Mechanism
PSE currently has a power cost adjustment (PCA) mechanism that provides for the deferral of power costs that vary from the “power cost baseline” level of power costs. The “power cost baseline” levels are set, in part, based on normalized assumptions about weather and hydroelectric conditions. Excess power costs or savings are apportioned between PSE and its customers pursuant to the graduated scale set forth in the PCA mechanism and will trigger a surcharge or refund when the cumulative deferral trigger is reached.
Effective January 1, 2017 the following graduated scale is used in the PCA mechanism:
Company's Share | Customers’ Share | ||||||
Annual Power Cost Variability | Over | Under | Over | Under | |||
Over or Under Collected by up to $17 million | 100% | 100% | —% | —% | |||
Over or Under Collected by between $17 million - $40 million | 35 | 50 | 65 | 50 | |||
Over or Under Collected beyond $40 + million | 10 | 10 | 90 | 90 | |||
On September 30, 2016, PSE filed an accounting petition with the Washington Commission which requested deferral of the variances, either positive or negative, between the fixed costs previously recovered in the PCA and the revenue received to cover the allowed fixed costs. The deferral period requested was January 1, 2017 through December 31, 2017 when rates were to go into effect from PSE's 2017 GRC. On November 10, 2016, the Washington Commission issued Order No. 01 approving PSE’s accounting petition. With the final determination in PSE’s GRC, this deferral ceased with the rate effective date of December 19, 2017.
For the nine months ended September 30, 2018, in its PCA mechanism, PSE under recovered its power costs by $7.7 million of which no amount was apportioned to customers. This compares to an under recovery of power costs of $8.9 million for the nine months ended September 30, 2017 of which no amounts were apportioned to customers. Power costs decreased in 2018 compared to 2017, although the effect of the lower power costs in the PCA mechanism was offset by a decrease in load used to calculate the baseline amount and a slightly lower baseline rate in 2018.
Electric Conservation Rider
The electric conservation rider collects revenue to cover the costs incurred in providing services and programs for conservation. Rates change annually on May 1 to collect the annual budget that started the prior January and to true-up for the difference between
37
actual conservation expenditures and the forecasted conservation expenditures from the prior year as well as the difference between actual load and the forecasted load set in rates.
The following table sets forth conservation rider rate adjustments approved by the Washington Commission and the corresponding expected annual impact on PSE’s revenue based on the effective dates:
Effective Date | Average Percentage Increase (Decrease) in Rates | Increase (Decrease) in Revenue (Dollars in Millions) | |
May 1, 2018 | (0.8)% | $(18.0) | |
May 1, 2017 | 0.7 | 16.5 | |
May 1, 2016 | (0.5) | (11.7) | |
Electric Property Tax Tracker Mechanism
The purpose of the property tax tracker mechanism is to pass through the cost of all property taxes incurred by the Company. The mechanism was implemented in 2013 and removed property taxes from general rates and included those costs for recovery in an adjusting tariff rate. The mechanism acts as a tracker rate schedule and collects the total amount of property taxes assessed. The tracker is adjusted each year in May based on that year's assessed property taxes and true-up from the prior year.
The following table sets forth property tax tracker mechanism rate adjustments approved by the Washington Commission and the corresponding expected annual impact on PSE’s revenue based on the effective dates:
Effective Date | Average Percentage Increase (Decrease) in Rates | Increase (Decrease) in Revenue (Dollars in Millions) | |
May 1, 2018 | (0.1)% | $(1.3) | |
May 1, 2017 | (0.04) | (0.9) | |
May 1, 2016 | 0.3 | 5.7 | |
Federal Incentive Tracker Tariff
The Federal Incentive Tracker Tariff passes through to customers the benefits associated with the wind-related treasury grants. The filing results in a credit back to customers for pass-back of treasury grant amortization and pass-through of interest and any related true-ups. The filing is adjusted annually for new federal benefits, actual versus forecast interest and to true-up for the difference between actual load and the forecasted load set in rates. Rates change annually on January 1. Additionally, this tracker is impacted by the TCJA previously discussed. Accordingly, PSE filed for a one-time rate change to be effective May 1, 2018 to recognize the decrease in the federal corporate income tax rate from 35% to 21%.
The following table sets forth the federal incentive tracker tariff revenue requirement approved by the Washington Commission and the corresponding expected annual impact on PSE’s revenue based on the effective dates:
Effective Date | Average Percentage Increase (Decrease) in Rates from prior year | Total credit to be passed back to eligible customers (Dollars in Millions) | |
May 1, 2018 | 0.4% | $(40.1) | |
January 1, 2018 | 0.2 | (48.2) | |
January 1, 2017 | 0.3 | (51.7) | |
January 1, 2016 | (0.2) | (57.3) | |
Residential Exchange Benefit
The residential exchange program passes through the residential exchange program benefits that PSE receives from the Bonneville Power Administration (BPA). Rates change bi-annually on October 1.
38
The following table sets forth residential exchange benefit adjustments approved by the Washington Commission and the corresponding expected annual impact on PSE’s revenue based on the effective dates:
Effective Date | Average Percentage Increase (Decrease) in Rates | Total credit to be passed back to eligible customers (Dollars in Millions) | |
October 1, 2017 | (0.6)% | $(80.8) | |
Natural Gas Rates
Natural Gas Conservation Rider
The natural gas conservation rider collects revenue to cover the costs incurred in providing services and programs for conservation. Rates change annually on May 1 to collect the annual budget that started the prior January and to true-up for the difference between actual conservation expenditures and forecasted conservation expenditures from the prior year as well as the difference between actual load and the forecasted load set in rates.
The following table sets forth conservation rider rate adjustments approved by the Washington Commission and the corresponding expected annual impact on PSE’s revenue based on the effective dates:
Effective Date | Average Percentage Increase (Decrease) in Rates | Increase (Decrease) in Revenue (Dollars in Millions) | ||
May 1, 2017 | (0.1) | (1.0) | ||
May 1, 2016 | 0.3 | 2.9 | ||
Natural Gas Property Tax Tracker Mechanism
The purpose of the property tax tracker mechanism is to pass through the cost of all property taxes incurred by the Company. The mechanism was implemented in 2013 and removed property taxes from general rates and included those costs for recovery in an adjusting tariff rate. The mechanism acts as a tracker rate schedule and collects the total amount of property taxes assessed. The tracker is adjusted each year in May based on that year's assessed property taxes and adjustments to the rate from the prior year.
The following table sets forth property tax tracker mechanism rate adjustments approved by the Washington Commission and the corresponding expected annual impact on PSE’s revenue based on the effective dates:
Effective Date | Average Percentage Increase (Decrease) in Rates | Increase (Decrease) in Revenue (Dollars in Millions) | |
May 1, 2018 | (0.2)% | $(2.2) | |
May 1, 2017 | (0.1) | (1.1) | |
May 1, 2016 | 0.4 | 3.5 | |
Natural Gas Cost Recovery Mechanism
The purpose of the cost recovery mechanism (CRM) is to recover capital costs related to projects included in PSE's pipe replacement program plan on file with the Washington Commission with the intended effect of enhancing the safety of the natural gas distribution system. Rates change annually on November 1.
39
The following table sets forth CRM rate adjustments approved by the Washington Commission and the corresponding expected annual impact on PSE’s revenue based on the effective dates:
Effective Date | Average Percentage Increase (Decrease) in Rates | Increase (Decrease) in Revenue (Dollars in Millions) | |
November 1, 2018 | 0.5% | $5.0 | |
November 1, 2017 | 0.5 | 4.9 | |
November 1, 2016 | 0.6 | 5.6 | |
Purchased Gas Adjustment
PSE has a purchased gas adjustment (PGA) mechanism that allows PSE to recover expected natural gas supply and transportation costs and defer, as a receivable or liability, any natural gas supply and transportation costs that exceed or fall short of this expected natural gas cost amount in PGA mechanism rates, including accrued interest. PSE is authorized by the Washington Commission to accrue carrying costs on PGA receivable and payable balances. A receivable or payable balance in the PGA mechanism reflects an under recovery or over recovery, respectively, of natural gas cost through the PGA mechanism. Rates change annually on November 1.
The following table sets forth the PGA rate adjustments approved by the Washington Commission and the corresponding expected annual impact on PSE’s revenue based on the effective date:
Effective Date | Average Percentage Increase (Decrease) in Rates | Increase (Decrease) in Revenue (Dollars in Millions) | |
November 1, 2018 | (10.9)% | $(98.4) | |
November 1, 2017 | (3.3) | (30.8) | |
November 1, 2016 | (0.4) | (4.1) | |
Other Proceedings
Large Customer Retail Wheeling
On October 7, 2016, PSE filed a tariff to provide open access service to a narrow set of qualifying customers. Subsequent to that tariff filing, parties to the case reached an all-party settlement that converted the tariff to a special contract only allowing retail access for the loads of the Microsoft Corporation currently being served under PSE’s electric Schedule 40. The special contract includes the following conditions: (i) Microsoft must exceed Washington State’s current renewable portfolio standards, (ii) the remainder of power sold to Microsoft must be carbon free, (iii) there will be no reduction in Microsoft's funding of PSE’s conservation programs, (iv) Microsoft will pay a transition fee that will be a straight pass-through to customers and (v) Microsoft will fund enhanced low-income support. A definitive agreement among the parties, the special contract and supportive testimony were filed with the Washington Commission on April 11, 2017 with hearings that occurred on May 3, 2017. The Washington Commission issued an order on July 13, 2017 approving PSE’s special contract with Microsoft. Microsoft cannot begin taking service under the special contract until it has the required metering installed, has contracts for the supply and transmission of its power supply and pays the transition fee.
40
Voluntary Long-Term Renewable Energy
On September 28, 2016, the Washington Commission approved PSE's tariff revision to create an additional voluntary renewable energy product, effective September 30, 2016. This provides customers with electric generation resource options to help them meet their sustainability goals. Incremental costs of the program will be allocated to the voluntary participants of the program as is the case with PSE’s existing Green Power programs. PSE initially offered this service, Green Direct, to larger customers (aggregated annual loads greater than 10,000 MWh) and government customers. The initial resource option offered under this rate schedule is a new wind generation facility with the capacity of approximately 136.8 MW that will be constructed in the region by a developer under contract to PSE to meet the demand for this voluntary renewable energy product. PSE anticipates that customers will start receiving energy through this program in 2019. Twenty-one customers have fully subscribed to the anticipated output of the project.
On July 26, 2018, the Washington Commission approved a second phase of the Green Direct product. The phase 2 offering will be a blend of the phase 1 wind and a 120.0 MW solar project. Phase 1 customers will receive wind through 2020; and then will receive the blended energy in 2021. Open enrollment for phase 2, which is fully subscribed, began on August 31, 2018 and customers will start receiving energy through the program in 2021.
For additional information, see Note 7, "Regulation and Rates" to the consolidated financial statements included in Item 1 of this report.
Other Factors and Trends
Access to Debt Capital
PSE relies on access to bank borrowings and short-term money markets as sources of liquidity and longer-term capital markets to fund its utility construction program, to meet maturing debt obligations and other capital expenditure requirements not satisfied by cash flow from its operations or equity investment from its parent, Puget Energy. Neither Puget Energy nor PSE have any debt outstanding whose maturity would accelerate upon a credit rating downgrade. However, a ratings downgrade could adversely affect the Company's ability to renew existing, or obtain access to new credit facilities and could increase the cost of such facilities. For example, under Puget Energy's and PSE's credit facilities, the borrowing costs increase as their respective credit ratings decline due to increases in credit spreads and commitment fees. If PSE is unable to access debt capital on reasonable terms, its ability to pursue improvements or acquisitions, including generating capacity, which may be relied on for future growth and to otherwise implement its strategy, could be adversely affected. PSE monitors the credit environment and expects to continue to be able to access the capital markets to meet its short-term and long-term borrowing needs. In October 2017, Puget Energy and PSE each entered into new five-year credit facilities that replaced the previous facilities and are scheduled to mature in October 2022. On October 1, 2018, Puget Energy entered into a three-year term loan agreement that includes an expansion feature and will mature in October 2021.
Additional information on credit facilities is set forth below in the “Puget Sound Energy - Credit Facilities” and "Puget Energy - Credit Facility" sections.
Regulatory Compliance Costs and Expenditures
PSE's operations are subject to extensive federal, state and local laws and regulations. These regulations cover electric system reliability, natural gas pipeline system safety and energy market transparency, among other areas. Environmental laws and regulations related to air and water quality, including climate change and endangered species protection, waste handling and disposal (including generation by-products such as coal ash), remediation of contamination and siting new facilities also impact the Company's operations. PSE must spend a significant amount of resources to fulfill requirements set by regulatory agencies, many of which have greatly expanded mandates on measures including resource planning, remediation, monitoring, pollution control equipment and emissions-related abatement and fees.
Compliance with these or other future regulations, such as those pertaining to climate change, could require significant capital expenditures by PSE and may adversely affect PSE's financial position, results of operations, cash flows and liquidity.
Other Challenges and Strategies
Competition
PSE’s electric and natural gas utility retail customers generally do not have the ability to choose their electric or natural gas supplier; and therefore, PSE’s business has historically been recognized as a natural monopoly. However, PSE faces competition from public utility districts and municipalities that want to establish their own municipal-owned utility, as a result of which PSE may lose a number of customers. PSE also faces increasing competition for sales to its retail customers through alternative methods of electric energy generation, including solar and other self-generation methods. In addition, PSE’s natural gas customers may elect to use heating oil, propane or other fuels instead of using and purchasing natural gas from PSE.
41
Results of Operations
Puget Sound Energy
Non-GAAP Financial Measures - Electric and Natural Gas Margins
The following discussion includes financial information prepared in accordance with U.S. Generally Accepted Accounting Principles (GAAP), as well as two other financial measures, electric margin and natural gas margin, that are considered “non-GAAP financial measures.” Generally, a non-GAAP financial measure is a numerical measure of a company’s financial performance, financial position or cash flows that includes adjustments that result in a departure from GAAP presentation. The presentation of electric margin and natural gas margin is intended to supplement an understanding of PSE’s operating performance. Electric margin and natural gas margin are used by PSE to determine whether PSE is collecting the appropriate amount of revenue from its customers in order to provide adequate recovery of operating costs, including interest and equity returns. PSE’s electric margin and natural gas margin measures may not be comparable to other companies’ electric margin and natural gas margin measures. Furthermore, these measures are not intended to replace operating income as determined in accordance with GAAP as an indicator of operating performance.
42
Electric Margin
Electric margin represents electric sales to retail and transportation customers less the cost of generating and purchasing electric energy sold to customers, including transmission costs, to bring electric energy to PSE's service territory. The following chart displays the details of PSE's electric margin changes for the three months ended September 30, 2017 and 2018:
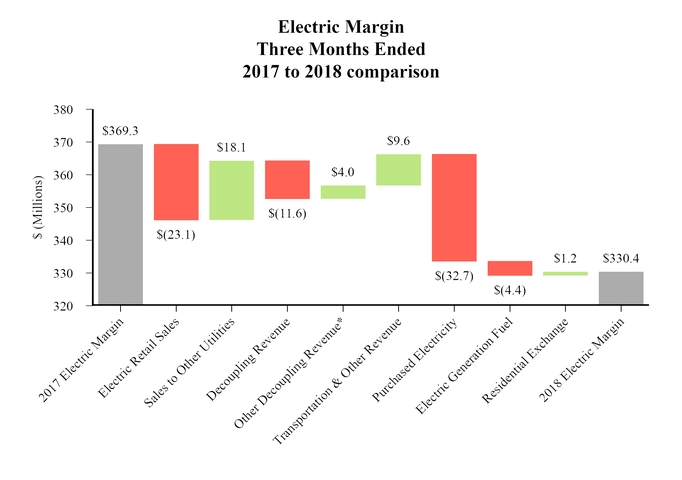
______________
* Includes decoupling cash collections, ROR excess earnings, and decoupling 24-month revenue reserve.
Three months ended September 30, 2017 compared to 2018
Electric Operating Revenue
Electric operating revenues decreased $3.0 million from the prior year primarily due to a decrease in electric retail sales of $23.1 million and a decrease in decoupling revenue of $11.6 million; partially offset by an increase in sales to other utilities of $18.1 million, transportation and other revenues of $9.6 million and other decoupling revenue of $4.0 million. These items are discussed in detail below.
• | Electric retail sales decreased $23.1 million primarily due to the following: (i) a decrease of $17.4 million as a result of a 3.4% decrease attributable to corporate tax rates in the TCJA filing and a decoupling rate mechanism decrease of 1.1% annually effective May 2018 and (ii) a $5.7 million decrease primarily from lower retail electricity usage of 1.3% compared to the prior year. |
• | Sales to other utilities increased $18.1 million due to a 52.2% increase in volumes due to additional combustion turbine generation as a result of favorable heat rates and a 15.8% increase in electric wholesale prices due to increased demand within the region from warm weather. Refer to the electric generation fuel discussion below. |
• | Decoupling revenue decreased $11.6 million primarily due to a decrease of $17.4 million in PCA fixed cost deferrals. In 2017, the PCA fixed cost deferrals were not load shaped within the mechanism, which led to a large over-collection. In 2018, PCA fixed costs are load shaped within the decoupling mechanism to more accurately reflect annual load trends. As a result, actual revenues were closer to PSE's allowed revenues for the decoupling mechanism in 2018 as compared to 2017. |
43
This was partially offset by a $5.8 million increase in delivery decoupling deferrals, where decreased electricity usage has resulted in under-collection in the current year as compared to over-collection in the prior year.
• | Other decoupling revenue increased $4.0 million primarily due to a $4.8 million decrease in amortization of prior year deferrals resulting from lower amortization rates and reduced electricity usage in the current year. This was partially offset by a decrease in current year recognition of revenues previously not recognized as they were not expected to be recovered in rates within 24 months. |
• | Transportation and other revenue increased $9.6 million primarily due to a change in production tax credit (PTC) deferral revenue of $5.0 million for the re-purpose of the PTCs and an increase in net wholesale natural gas sales of $3.3 million due to an increase of wholesale electricity prices. |
Electric Power Costs
Electric power costs increased $35.9 million primarily due to an increase of $32.7 million of purchased electricity costs and an increase of $4.4 million of electric generation fuel expense. These items are discussed in detail below.
• | Purchased electricity expense increased $32.7 million primarily due to a 28.5% increase in wholesale prices partially offset by a 0.1% decrease in wholesale electricity purchases as discussed in sales to other utilities. |
• | Electric generation fuel expense increased $4.4 million primarily due to a $7.4 million increase in combustion turbine generation costs primarily due to an increase in generation of 39.0% as a result of favorable heat rates; partially offset by a $3.0 million reduction of coal generation costs primarily at Colstrip units 3 and 4 for variable fuel costs due to a 49.1% decrease in production from an unplanned outage. |
The following chart displays the details of PSE's electric margin changes for the nine months ended September 30, 2017 and 2018:
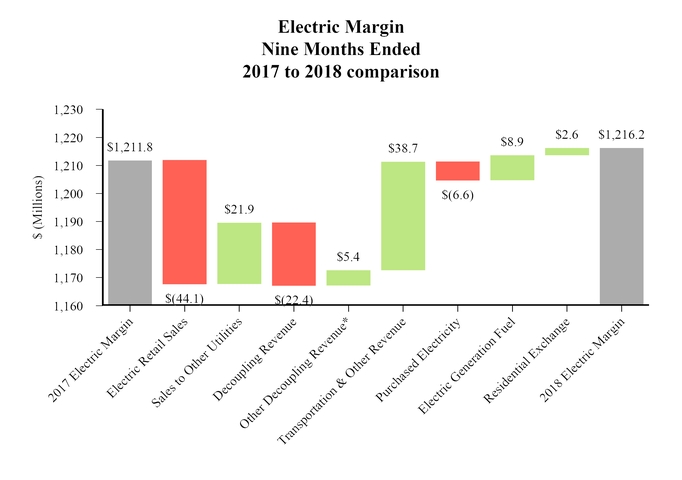
______________
* Includes decoupling cash collections, ROR excess earnings, and decoupling 24-month revenue reserve.
44
Nine months ended September 30, 2017 compared to 2018
Electric Operating Revenue
Electric operating revenues decreased $0.6 million primarily due to a decrease in electric retail sales of $44.1 million and decoupling revenue of $22.4 million; partially offset by an increase in transportation and other revenues of $38.7 million, sales to other utilities of $21.9 million and other decoupling revenue of $5.4 million. These items are discussed in detail below.
• | Electric retail sales decreased $44.1 million due to a decrease of $41.8 million from lower retail electricity usage of 2.5% compared to the prior year and a decrease in rates of $2.6 million. The rate decrease was due to the decoupling rate mechanism rate decrease of 1.1% annually effective May 2018 and the decrease in May 2018 of 3.4% due to change in corporate tax rates as a result of TCJA. The rate decreases were partially offset by the GRC rate increase of 0.9% annually effective December 2017. The reduced usage was due to a decrease of residential and commercial use per customer of 3.6% and 1.2%, respectively, primarily due to a decrease in heating degree days of 10.0% compared to 2017. |
• | Sales to other utilities increased $21.9 million due to a 28.6% increase in volumes due to additional combustion turbine generation as a result of favorable heat rates and a 22.0% increase in electric wholesale prices due to increased demand within the region from warm weather. Refer to the electric generation fuel discussion below. |
• | Decoupling revenue decreased $22.4 million primarily due to a decline of $19.0 million in PCA fixed cost deferrals. In 2017, PCA fixed cost deferrals were not load shaped within the mechanism, which lead to a large undercollection. In 2018, PCA fixed costs are load shaped within the decoupling mechanism to more accurately reflect annual load trends. In addition, delivery decoupling deferrals decreased $3.4 million due to a decrease in allowed revenue per customer, slightly offset by a decrease in electricity usage, as noted above. As a result, actual revenues were closer to PSE's allowed revenues for the decoupling mechanism in 2018 as compared to 2017. |
• | Other decoupling revenue increased $5.4 million primarily due to a $6.9 million decrease in current year amortization of prior year over-collection, resulting from lower amortization rates and reduced electricity usage in the current year. This was offset in part by $1.3 million recognized in 2017 for revenue not expected to be recovered in rates within 24 months from previous years. |
• | Transportation and other revenue increased $38.7 million primarily due to a change in PTC deferral revenue of $56.2 million for the re-purpose of the PTCs and an increase in net wholesale natural gas sales of $3.7 million due to an increase in wholesale electricity prices of 7.9%; partially offset by tax reform deferrals for revenue subject to refunds of $24.1 million as discussed in sales to other utilities. |
Electric Power Costs
Electric power costs decreased $4.9 million primarily due to decrease of $8.9 million of electric generation fuel expense and an increase in residential exchange credits of $2.6 million; partially offset by an increase of $6.6 million of purchased electricity costs. These items are discussed in detail below.
• | Purchased electricity expense increased $6.6 million primarily due to a 7.9% increase in wholesale prices partially offset by a 5.8% decrease in wholesale electricity purchases as discussed in sales to other utilities. |
• | Electric generation fuel expense decreased $8.9 million primarily due to a $6.2 million reduction of coal generation costs primarily at Colstrip for variable fuel costs due to a 10.7% decrease in production driven by maintenance at units 1 and 2 and an unplanned outage at units 3 and 4; Additionally, there was a $2.7 million reduction in combustion turbine generation costs. |
• | Residential exchange expense decreased $2.6 million resulting from decreased electricity usage as rates remain consistent in both periods. The REP credit is a pass-through tariff item with a corresponding credit in electric operating revenue, with no impact on net income. The Northwest Power Act, through the REP, provides access to the benefits of low-cost federal power for residential and small farm customers of regional utilities, including PSE. The program is administered by the BPA. Pursuant to agreements (including settlement agreements) between the BPA and PSE, the BPA has provided payments of REP benefits to PSE, which PSE has passed through to its residential and small farm customers in the form of electricity bill credits. |
Natural Gas Margin
Natural gas margin is natural gas sales to retail and transportation customers less the cost of natural gas purchased, including transportation costs to bring natural gas to PSE’s service territory. The PGA mechanism passes through to customers increases or decreases in the natural gas supply portion of the natural gas service rates based upon changes in the price of natural gas purchased from producers and wholesale marketers or changes in natural gas pipeline transportation costs. PSE's margin or net income is not affected by changes under the PGA mechanism because over-and-under recoveries of natural gas costs included in baseline PGA rates are deferred and either refunded or collected from customers, respectively, in future periods.
45
The following chart displays the details of PSE's natural gas margin changes for the three months ended September 30, 2017 and 2018:
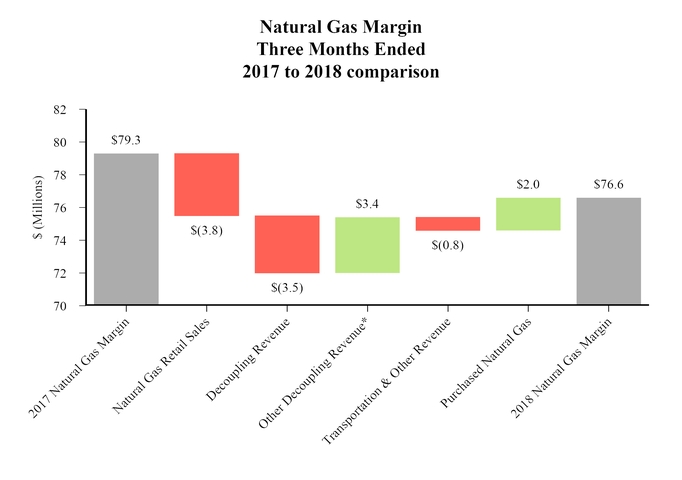
_______________
* Includes decoupling cash collections, ROR excess earnings, and decoupling 24-month revenue reserve.
Three months ended September 30, 2017 compared to 2018
Natural Gas Operating Revenue
Natural gas operating revenue decreased $4.7 million primarily due to a decrease of $3.8 million in total retail sales, a decrease of $3.5 million in decoupling revenue, and a decrease in transportation and other revenue of $0.8 million; partially offset by a $3.4 million increase in other decoupling revenue. These items are discussed in detail below.
• | Natural gas retail sales revenue decreased $3.8 million due to a decrease in rates of $5.2 million; partially offset by an increase of $1.4 million in natural gas sales, which is a result of an increase in natural gas residential load of 3.3% from an increase in residential customers of 1.5% and an increase in heating degree days of 36.5%. The decrease in rates was primarily due to rate changes from the following filings: GRC rates decreased 3.8% annually, PGA rates decreased 3.3% annually, a 3.4% decrease for the change in corporate tax rate due to the TCJA and is offset by an increase in decoupling rates of 1.7% annually, see Management's Discussion and Analysis, "Regulation and Rates" included in Item 2 of this report for natural gas rate changes. |
• | Decoupling revenue decreased $3.5 million where actual revenues more closely aligned with PSE's allowed revenues in the current year as compared to the prior year. This is primarily attributable to a decrease in allowed revenue per customer and an increase in usage, as noted above. |
• | Other decoupling revenue increased $3.4 million as a result of $4.3 million pass back related to ROR in 2017, whereas none is estimated in 2018. |
46
Natural Gas Energy Costs
Purchased natural gas expense decreased $2.0 million due to a 3.3% decrease in natural gas costs included in PGA rates partially offset by an increase in natural gas usage.
The following chart displays the details of PSE's natural gas margin changes for the nine months ended September 30, 2017 and 2018:
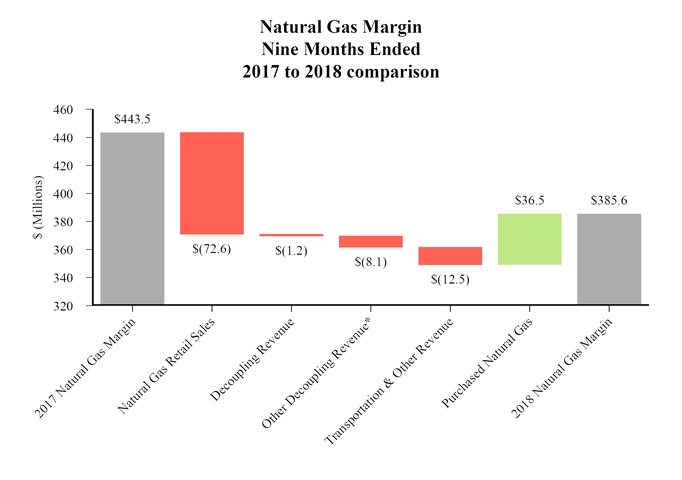
_______________
* Includes decoupling cash collections, ROR excess earnings, and decoupling 24-month revenue reserve.
Nine months ended September 30, 2017 compared to 2018
Natural Gas Operating Revenue
Natural gas operating revenue decreased $94.4 million primarily due to a decrease of $72.6 million in total retail sales, a decrease in transportation and other revenue of $12.5 million, a decrease of $8.1 million in other decoupling revenue and a decrease of $1.2 million increase in decoupling revenue. These items are discussed in detail below.
• | Natural gas retail sales revenue decreased $72.6 million due to a decrease of $49.3 million in natural gas sales, which is a result of a decrease in natural gas load of 7.3% from 2017 and a decrease in rates of $23.3 million. The decrease in rates was primarily due to a rate changes from the following filings: GRC which decreased rates 3.8% annually, PGA rates decreased 3.3% annually, a 3.4% decrease for the change in corporate tax rate due to the TCJA and is offset by an increase in decoupling rates of 2.4%, see Management's Discussion and Analysis, "Regulation and Rates" included in Item 2 of this report for natural gas rate changes. Natural gas load decreased primarily due to the decrease in average therms used per residential and commercial customers of 8.1% and 6.1%, respectively, compared to 2017, as a result of a 10.6% decrease in heating degree days, which decreased the natural gas heating load compared to prior year. |
47
• | Decoupling revenue decreased $1.2 million where actual revenues more closely aligned with PSE's allowed revenues in the current year as compared to the prior year. This is primarily attributable to a decrease in allowed revenue per customer, slightly offset by a decrease in usage, as noted above. |
• | Other decoupling revenue decreased $8.1 million primarily due to a $19.6 million decrease in current year recognition of revenues not recognized in previous years, as they were not expected to be recovered in rates within 24 months. This was partially offset by a $13.5 million increase related to ROR. |
• | Transportation and other revenue decreased $12.5 million primarily due to tax reform deferrals for revenue subject to refund of $10.5 million. |
Natural Gas Energy Costs
Purchased natural gas expense decreased $36.5 million due to a decrease in natural gas costs included in PGA rates and a decrease in natural gas usage of 7.3%.
48
Other Operating Expenses and Other Income (Deductions)
The following chart displays the details of PSE's operating expenses and other income (deductions) for the three months ended September 30, 2017 and 2018:
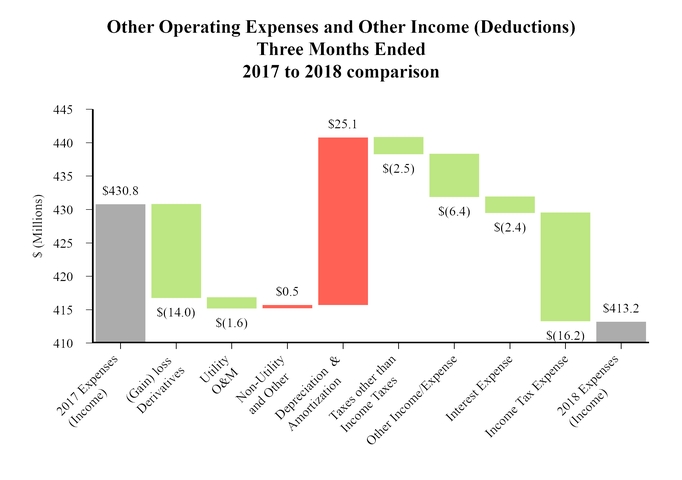
Three months ended September 30, 2017 compared to 2018
Other Operating Expenses
• | Net unrealized (gain) loss on derivative instruments increased $14.0 million to a net gain of 14.0 million. The primary driver for the increase in gains was due to an increase in the weighted average electricity and natural gas forward prices of 12.5%, resulting in a $6.0 million gain, and 9.6%, resulting in a $8.0 million gain, respectively. |
• | Depreciation and amortization expense increased $25.1 million primarily due to a depreciation rate change effective December 2017 as a result of the GRC and the following: (i) amortization of PTC regulatory liability of $5.0 million in 2018; (ii) electric depreciation expense increased $13.6 million, primarily due to net asset additions to production and distribution of $1.6 million and $180.8 million, respectively; (iii) an increase of $7.1 million due to net additions of $158.7 million of computer software; (iv) an increase of storm damage and regulatory amortization of $2.5 million and (v) an increase in natural gas environmental cost amortization of $3.6 million. These increases were partially offset by (i) conservation amortization decreased $3.8 million primarily due to a decrease of electric rate change of 0.8% annually effective May 1, 2018 and lower customer usage and (ii) a decrease in natural gas depreciation expense of $3.9 million primarily due to a depreciation rate change to a lower rate. |
• | Taxes other than income taxes decreased $2.5 million primarily due to decreases in municipal taxes of $0.5 million and state excise taxes of $1.2 million as a result of a decrease in retail revenue. |
49
Other Income, Interest Expense and Income Tax Expense
• | Other Income/expense increased $6.4 million primarily due to the $5.8 million pension non-service cost component recorded in 2018 as compared to 2017. For further details regarding the non-service cost component, see Note 6, "Retirement Benefits" to the consolidated financial statements included in Item 1 of this document. |
• | Interest expense decreased $2.4 million primarily related to lower interest rates on long-term debt due to the refinancing of the $250.0 million in junior subordinated notes and $200.0 million in senior secured notes at a lower interest. |
• | Income tax expense decreased $16.2 million primarily driven by a decrease in pre-tax income with a tax effect of $8.7 million and $1.3 million due to the amortization of excess deferred taxes related to utility plant as a result of tax reform. |
50
The following chart displays the details of PSE's operating expenses and other income (deductions) for the nine months ended September 30, 2017 and 2018:
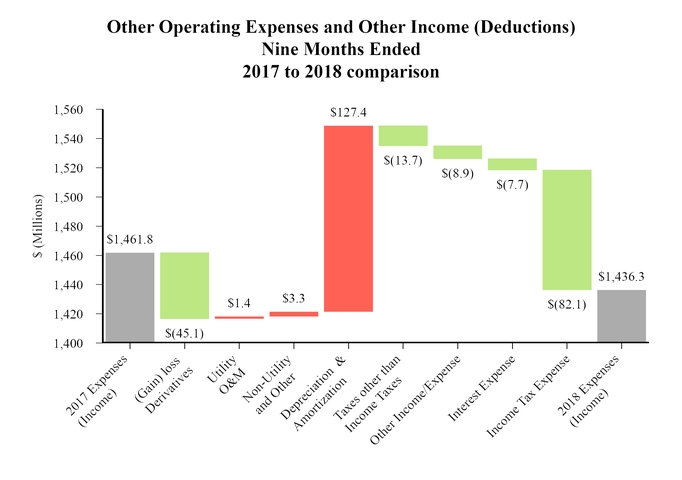
Nine months ended September 30, 2017 compared to 2018
Other Operating Expenses
• | Net unrealized (gain) loss on derivative instruments increased $45.1 million from a loss of $23.1 million. The primary driver for the increase in gains was due to an increase in the weighted average electricity and natural gas forward prices of 21.5%, resulting in a $12.3 million gain, and 11.4%, resulting in a $33.5 million gain, respectively. |
• | Depreciation and amortization expense increased $127.4 million primarily due to a depreciation rate change effective December 2017 as a result of the GRC which increased and the following: (i) amortization of PTC regulatory liability of $56.2 million in 2018; (ii) electric depreciation expense increased $44.5 million, primarily due to net asset additions to production and distribution of $1.6 million and $180.8 million, respectively; (iii) an increase of $15.2 million due to net additions of $158.7 million of computer software: (iv) an increase of storm damage and regulatory amortization of $13.8 million; (v) an increase in natural gas environmental cost amortization of $6.5 million; these increases were partially offset by (vi) a decrease in natural gas depreciation expense of $11.5 million primarily due to a depreciation rate change to a lower rate. |
• | Taxes other than income taxes decreased $13.7 million primarily due to decreases in municipal taxes of $4.8 million and state excise taxes of $4.6 million, as a result of a decrease in retail revenue; additionally, a decrease of $3.9 million related to the property tax tracker, which decreased due to load. |
Other Income, Interest Expense and Income Tax Expense
• | Other Income/expense increased $8.9 million primarily due to the $7.2 million pension non-service cost component recorded in 2018 as compared to 2017. For further details regarding the non-service cost component, see Note 6, "Retirement Benefits" to the consolidated financial statements included in Item 1 of this document. |
51
• | Interest expense decreased $7.7 million primarily related to lower interest rates on long-term debt due to the refinancing of the $250.0 million in junior subordinated notes and $200.0 million in senior secured notes at a lower interest. |
• | Income tax expense decreased $82.1 million primarily driven by the following: (i) approximately $30.9 million from the impact of tax reform with a decrease in statutory tax rate from 35% to 21%, (ii) a decrease in pre-tax book income with a tax effect of approximately $23.4 million, and (iii) approximately $16.3 million due to the amortization of excess deferred taxes related to utility plant as a result of tax reform. |
Puget Energy
Primarily, all operations of Puget Energy are conducted through its subsidiary PSE. Puget Energy's net income (loss) for the three months ended September 30, 2017 and 2018 are as follows:
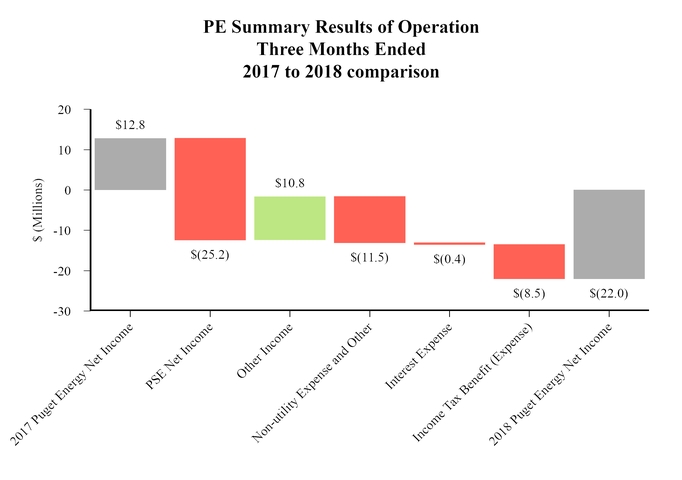
Three months ended September 30, 2017 compared to 2018
Summary Results of Operation
Puget Energy’s net income decreased for the three months ended September 30, 2018 by $34.8 million primarily due to a decrease over the prior year for PSE's net income as well as decreases in income tax benefit:
• | Other income increased by $10.8 million primarily as a result of the reclassification of the non-service cost component of pension benefit cost. For further information on this reclassification, see Note 6, "Retirement Benefits" in the Combined Notes to Consolidated Financial Statements in Item I. |
• | Non-utility expense and other increased by $11.5 million primarily due to the reclassification of non-service cost component of pension benefit cost. |
• | Income tax benefit decreased by $8.5 million primarily due to the impact of tax reform with a decrease in statutory tax rate from 35% to 21% as well as a decrease in pre-tax income. |
52
Puget Energy's net income (loss) for the nine months ended September 30, 2017 and 2018 are as follows:
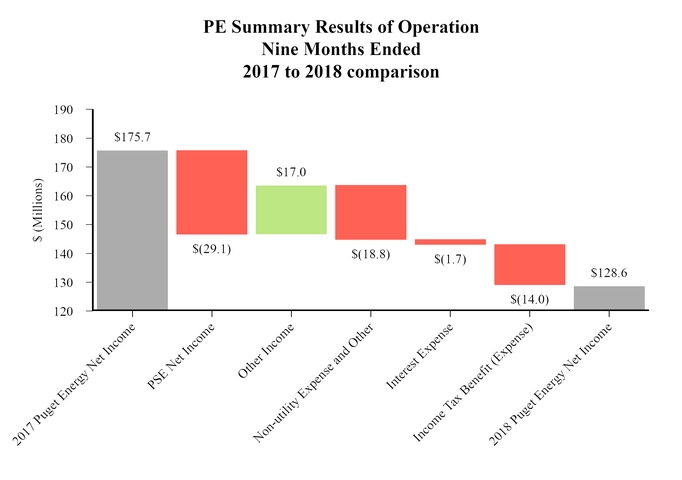
Nine months ended September 30, 2017 compared to 2018
Summary Results of Operation
Puget Energy’s net income decreased for the nine months ended September 30, 2018 by $47.1 million primarily due to a decrease in non-utility and other expense, as well as a decrease in income tax benefit:
• | Other income increased by $17.0 million primarily as a result of the reclassification of the non-service cost component of pension benefit cost. For further information on this reclassification, see Note 6, "Retirement Benefits" in the Combined Notes to Consolidated Financial Statements in Item I. |
• | Non-utility expense and other increased by $18.8 million primarily due to the reclassification of non-service cost component of pension benefit cost. |
• | Income tax benefit decreased by $14.0 million due primarily to the impact of tax reform with a decrease in statutory tax rate from 35% to 21% as well as a decrease in pre-tax income. |
53
Capital Requirements
Contractual Obligations and Commercial Commitments
During the nine months ended September 30, 2018, there were no material changes to the contractual obligations and consolidated commercial commitments disclosed in Note 15, "Commitments and Contingencies" to the consolidated financial statements included in Item 8 of the Company's Form 10-K for the period ended December 31, 2017.
The following are the Company's aggregate availability under commercial commitments as of September 30, 2018:
Puget Sound Energy and Puget Energy | Amount of Available Commitments Expiration Per Period | ||||||||||||||||||
(Dollars in Thousands) | Total | 2018 | 2019 - 2020 | 2021 - 2022 | Thereafter | ||||||||||||||
Commercial commitments: | |||||||||||||||||||
PSE revolving credit facility | $ | 800,000 | $ | — | $ | — | $ | 800,000 | $ | — | |||||||||
Inter-company short-term debt | 30,000 | $ | — | — | — | 30,000 | |||||||||||||
Total PSE commercial commitments | $ | 830,000 | $ | — | $ | — | $ | 800,000 | $ | 30,000 | |||||||||
Puget Energy revolving credit facility | 649,535 | — | — | 649,535 | — | ||||||||||||||
Less: Inter-company short-term debt elimination | (30,000 | ) | — | — | — | (30,000 | ) | ||||||||||||
Total Puget Energy commercial commitments | $ | 1,449,535 | $ | — | $ | — | $ | 1,449,535 | $ | — | |||||||||
For further discussion, see Management's Discussion and Analysis, "Financing Program" in Item 2.
Off-Balance Sheet Arrangements
As of September 30, 2018, the Company had no off-balance sheet arrangements that have or are reasonably likely to have a material effect on the Company's financial condition.
Utility Construction Program
PSE’s construction programs for generating facilities, the electric transmission system, the natural gas and electric distribution systems and the Tacoma LNG facility are designed to support reliable energy delivery, meet regulatory requirements, and customer growth. Construction expenditures, excluding equity allowance for funds used during construction (AFUDC), totaled $712.3 million for the nine months ended September 30, 2018. Presently planned utility construction expenditures, excluding equity AFUDC, are as follows:
Capital Expenditure Projections | |||||||||||
(Dollars in Thousands) | 2018 | 2019 | 2020 | ||||||||
Total energy delivery, technology and facilities expenditures | $ | 1,003,000 | $ | 839,000 | $ | 740,000 | |||||
The program is subject to change based upon general business, economic and regulatory conditions. Utility construction expenditures and any new generation resource expenditures may be funded from a combination of sources which may include cash from operations, short-term debt, long-term debt and/or equity. PSE’s planned capital expenditures may result in a level of spending that will exceed its cash flow from operations. As a result, execution of PSE’s strategy is dependent in part on continued access to capital markets.
54
Capital Resources
Cash from Operations
Puget Sound Energy | Nine Months Ended September 30, | ||||||||||
(Dollars in Millions) | 2018 | 2017 | Change | ||||||||
Net income | $ | 193,709 | $ | 222,846 | $ | (29,137 | ) | ||||
Non-cash items1 | 493,821 | 566,178 | (72,357 | ) | |||||||
Changes in cash flow resulting from working capital2 | 158,184 | 164,451 | (6,267 | ) | |||||||
Regulatory assets and liabilities | (22,545 | ) | (85,385 | ) | 62,840 | ||||||
Other noncurrent assets and liabilities3 | (8,356 | ) | (35,665 | ) | 27,309 | ||||||
Net cash provided by operating activities | $ | 814,813 | $ | 832,425 | $ | (17,612 | ) | ||||
_______________
1 | Non-cash items include depreciation, amortization, deferred income taxes, net unrealized (gain) loss on derivative instruments, AFUDC-equity, PTCs and other miscellaneous non-cash items. |
2 | Changes in working capital include receivables, unbilled revenue, materials/supplies, fuel/gas inventory, income taxes, prepayment, PGA, accounts payable and accrued expenses. |
3 | Other non-current assets and liabilities include funding of pension liability. |
Nine Months Ended September 30, 2018 compared to 2017
Cash generated from operations for the nine months ended September 30, 2018 decreased by $17.6 million including a net income decrease of $29.1 million. The following are significant factors that impacted PSE's cash flows from operations:
• | Cash flow adjustments resulting from non-cash items decreased $72.4 million primarily due to changes in deferred income tax and tax credits of $96.2 million, production tax credit monetization of $56.2 million and derivative instruments of $45.1 million offset by changes in depreciation and amortization of $130.8 million. For further discussion, see note 7, "Regulation and Rates" and Management's Discussion and Analysis, "Other Operating Expenses" in Item 2. |
• | Cash outflows resulting from regulatory assets and liabilities decreased $62.8 million primarily due to deferred accounting treatment for the impacts of tax reform and decoupling collections. For further discussion, see Management's Discussion and Analysis, "Electric Operating Revenue" and "Natural Gas Operating Revenue" in Item 2. |
Puget Energy | Nine Months Ended September 30, | ||||||||||
(Dollars in Millions) | 2018 | 2017 | Change | ||||||||
Net income | $ | (65,138 | ) | $ | (47,184 | ) | $ | (17,954 | ) | ||
Non-cash items1 | 616 | (18,845 | ) | 19,461 | |||||||
Changes in cash flow resulting from working capital2 | 2,058 | (13,323 | ) | 15,381 | |||||||
Regulatory assets and liabilities | — | — | — | ||||||||
Other noncurrent assets and liabilities3 | (10,016 | ) | 15,597 | (25,613 | ) | ||||||
Net cash provided by operating activities | $ | (72,480 | ) | $ | (63,755 | ) | $ | (8,725 | ) | ||
_______________
1 | Non-cash items include depreciation, amortization, deferred income taxes, net unrealized (gain) loss on derivative instruments, AFUDC-equity, PTCs and other miscellaneous non-cash items. |
2 | Changes in working capital include receivables, unbilled revenue, materials/supplies, fuel/gas inventory, income taxes, prepayments, PGA, accounts payable and accrued expenses. |
3 | Other noncurrent assets and liabilities include funding of pension liability. |
Nine Months Ended September 30, 2018 compared to 2017
Cash generated from operations for the nine months ended September 30, 2018, in addition to the changes discussed at PSE above, decreased by $8.7 million compared to the same period in 2017. The change was primarily impacted by the factors explained below:
• | Cash flow resulting from non-cash items increased $19.5 million primarily due to changes in deferred income taxes. |
• | Cash flow resulting from working capital increased $15.4 million primarily due to changes in accounts receivable. |
55
• | Cash flow resulting from other noncurrent assets and liabilities decreased $25.6 million primarily due to the reclassification of construction work-in-process related to other property and investments. |
Financing Program
The Company's external financing requirements principally reflect the cash needs of its construction program, its schedule of maturing debt and certain operational needs. The Company anticipates refinancing the redemption of bonds or other long-term borrowings with its credit facilities and/or the issuance of new long-term debt. Access to funds depends upon factors such as Puget Energy's and PSE's credit ratings, prevailing interest rates and investor receptivity to investing in the utility industry, Puget Energy and PSE. The Company believes it has sufficient liquidity through its credit facilities and access to capital markets and operations to fund its needs over the next twelve months.
Proceeds from PSE’s short-term borrowings and sales of commercial paper are used to provide working capital and the interim funding of utility construction programs. Puget Energy and PSE continue to have reasonable access to the capital and credit markets.
Puget Sound Energy
Credit Facilities
As of September 30, 2018, PSE had an $800.0 million credit facility to meet short-term liquidity needs. The credit facility includes a swingline feature allowing same day availability on borrowings up to $75.0 million. The credit facility has an expansion feature which, upon the banks' approval, would increase the total size of the facility to $1.4 billion. The unsecured revolving credit facility matures in October 2022.
The credit agreement is syndicated among numerous lenders and contains usual and customary affirmative and negative covenants that, among other things, place limitations on PSE's ability to transact with affiliates, make asset dispositions and investments or permit liens to exist. The credit agreement also contains a financial covenant of total debt to total capitalization of 65.0% or less. PSE certifies its compliance with such covenants to participating banks each quarter. As of September 30, 2018, PSE was in compliance with all applicable covenant ratios.
The credit agreement provides PSE with the ability to borrow at different interest rate options. The credit agreement allows PSE to borrow at the bank's prime rate or to make floating rate advances at London Interbank Offered Rate (LIBOR) plus a spread that is based upon PSE's credit rating. PSE must pay a commitment fee on the unused portion of the credit facility. The spreads and the commitment fee depend on PSE's credit ratings. As of the date of this report, the spread to the LIBOR is 1.25% and the commitment fee is 0.175%.
As of September 30, 2018, no amounts were drawn and outstanding under PSE's credit facility and$206.0 million was outstanding under the commercial paper program. Outside of the credit agreement, PSE had a $3.0 million letter of credit in support of a long-term transmission contract and a $1.0 million letter of credit in support of natural gas purchases in Canada.
Demand Promissory Note
In 2006, PSE entered into a revolving credit facility with Puget Energy, in the form of a credit agreement and a demand promissory note (Note) pursuant to which PSE may borrow up to $30.0 million from Puget Energy subject to approval by Puget Energy. Under the terms of the Note, PSE pays interest on the outstanding borrowings based on the lower of the weighted-average interest rates of PSE’s outstanding commercial paper interest rate or PSE’s senior unsecured revolving credit facility. Absent such borrowings, interest is charged at one-month LIBOR plus 0.25%. As of September 30, 2018, PSE had no outstanding balance under the Note.
Long Term Debt
On March 5, 2018, PSE commenced a tender offer and related consent solicitation to purchase any and all of the outstanding $250.0 million 6.974% Series A Enhanced Junior Subordinated Notes due June 1, 2067. Holders of the notes received $1,005 per $1,000 principal amount of notes plus accrued and unpaid interest for notes tendered and accepted by the early tender payment deadline of March 16, 2018. Holders of notes tendered after the early tender payment deadline, but prior to the tender offer expiration on April 2, 2018 were to receive the tender offer consideration of $975 per $1,000 of principal amount of the notes plus accrued but unpaid interest. A total of $193.4 million in principal amount of notes were tendered by the early payment deadline and no notes were tendered after the early payment deadline. On March 20, 2018, $194.9 million was paid to the holders of the tendered notes. This amount included the principal, early tender consideration and accrued interest up to, but not including March 20, 2018.
Concurrently with the tender offer, PSE solicited consents from a majority (in principal amount) of the holders of PSE’s 6.274% Senior Notes due March 15, 2037 to terminate the replacement capital covenant granted to the holders of those notes.
56
The termination of the covenant was necessary because it included restrictions related to repurchases, redemptions and repayments of the 6.974% Series A Enhanced Junior Subordinated Notes. PSE received consents from holders of 87.7% of the 6.274% Senior Notes and paid a consent fee totaling $2.6 million to those holders on March 19, 2018.
On March 28, 2018, PSE issued a notice of redemption, effective April 27, 2018, for the remaining $56.6 million principal amount of the 6.974% Series A Enhanced Junior Subordinated Notes. The notes were redeemed at a price equal to 100% of their principal amount plus accrued and unpaid interest up to, but excluding the redemption date.
On June 4, 2018, PSE issued $600.0 million of 30-year Senior Notes under its senior note indenture at an interest rate of 4.223% with a maturity date of June 15, 2048. The proceeds from the issuance were used to pay the principal and accrued interest on the company’s $200.0 million Secured Notes that matured on June 15, 2018, outstanding commercial paper borrowings of $348.0 million and other general corporate expenses.
Debt Restrictive Covenants
The type and amount of future long-term financings for PSE may be limited by provisions in PSE's electric and natural gas mortgage indentures.
PSE’s ability to issue additional secured debt may also be limited by certain restrictions contained in its electric and natural gas mortgage indentures. Under the most restrictive tests at September 30, 2018, PSE could issue:
• | Approximately $1.9 billion of additional first mortgage bonds under PSE’s electric mortgage indenture based on approximately $3.2 billion of electric bondable property available for issuance, subject to an interest coverage ratio limitation of 2.0 times net earnings available for interest (as defined in the electric utility mortgage), which PSE exceeded at September 30, 2018; and |
• | Approximately $501.0 million of additional first mortgage bonds under PSE’s natural gas mortgage indenture based on approximately $835.0 million of natural gas bondable property available for issuance, subject to a combined natural gas and electric interest coverage test of 1.75 times net earnings available for interest and a natural gas interest coverage test of 2.0 times net earnings available for interest (as defined in the natural gas utility mortgage), both of which PSE exceeded at September 30, 2018. |
At September 30, 2018, PSE had approximately $7.1 billion in electric and natural gas rate base to support the interest coverage ratio limitation test for net earnings available for interest.
Shelf Registrations
On November 21, 2016, PSE filed a shelf registration statement under which it may issue, as of the date of this report, up to $200.0 million aggregate principal amount of senior notes secured by first mortgage bonds. The shelf registration will expire in November 2019.
Dividend Payment Restrictions
The payment of dividends by PSE to Puget Energy is restricted by provisions of certain covenants applicable to long-term debt contained in PSE’s electric and natural gas mortgage indentures. At September 30, 2018, approximately $696.0 million of unrestricted retained earnings was available for the payment of dividends under the most restrictive mortgage indenture covenant.
Pursuant to the terms of the Washington Commission merger order, PSE may not declare or pay dividends if PSE’s common equity ratio, calculated on a regulatory basis, is 44.0% or below except to the extent a lower equity ratio is ordered by the Washington Commission. Also, pursuant to the merger order, PSE may not declare or make any distribution unless on the date of distribution PSE’s corporate credit/issuer rating is investment grade, or, if its credit ratings are below investment grade, PSE’s ratio of earnings before interest, tax, depreciation and amortization (EBITDA) to interest expense for the most recently ended four fiscal quarter periods prior to such date is equal to or greater than 3.0 to 1.0. The common equity ratio, calculated on a regulatory basis, was 48.1% at September 30, 2018 and the EBITDA to interest expense was 5.5 to 1.0 for the twelve months ended September 30, 2018.
PSE’s ability to pay dividends is also limited by the terms of its credit facilities, pursuant to which PSE is not permitted to pay dividends during any Event of Default (as defined in the facilities), or if the payment of dividends would result in an Event of Default, such as failure to comply with certain financial covenants.
57
Puget Energy
Credit Facility
At September 30, 2018, Puget Energy maintained an $800.0 million credit facility which matures in October 2022. The Puget Energy revolving senior secured credit facility also has an accordion feature which, upon the banks' approval, would increase the size of the facility to $1.3 billion.
The revolving senior secured credit facility provides Puget Energy the ability to borrow at different interest rate options and includes variable fee levels. Interest rates may be based on the bank's prime rate or LIBOR, plus a spread based on Puget Energy's credit ratings. Puget Energy must pay a commitment fee on the unused portion of the facility. As of September 30, 2018, there was $150.5 million drawn and outstanding under the facility. As of the date of this report, the spread over LIBOR was 1.75% and the commitment fee was 0.275%.
The revolving senior secured credit facility contains usual and customary affirmative and negative covenants. The agreement also contains a maximum leverage ratio financial covenant as defined in the agreement governing the senior secured credit facility. As of September 30, 2018, Puget Energy was in compliance with all applicable covenants.
Term Loans
On October 1, 2018, Puget Energy entered into a $150.0 million, three-year term loan agreement with a small group of banks. The agreement, which includes an expansion feature of up to $100.0 million, will mature in October 2021. The proceeds from the term loan will be used to repay borrowings under the revolving credit facility, which carries a higher interest rate. For further details regarding the agreement, see Note 9, "Other", to the consolidated financial statements in Item I of this report.
Dividend Payment Restrictions
Puget Energy’s ability to pay dividends is also limited by the merger order issued by the Washington Commission. Pursuant to the merger order, Puget Energy may not declare or make a distribution unless on such date Puget Energy’s ratio of consolidated EBITDA to consolidated interest expense for the four most recently ended fiscal quarters prior to such date is equal to or greater than 2.0 to 1.0. Puget Energy's EBITDA to interest expense was 3.8 to 1.0 for the twelve months ended September 30, 2018.
At September 30, 2018, the Company was in compliance with all applicable covenants, including those pertaining to the payment of dividends.
Other
New Accounting Pronouncements
For the discussion of new accounting pronouncements, see Note 2, "New Accounting Pronouncements" to the consolidated financial statements in Item I of this report.
Colstrip
PSE has a 50% ownership interest in Colstrip Units 1 and 2 and a 25% interest in Colstrip Units 3 and 4. On March 6, 2013, the Sierra Club and the Montana Environmental Information Center filed a Clean Air Act citizen suit against all Colstrip owners in the U.S. District Court, District of Montana. On July 12, 2016, PSE reached a settlement with the Sierra Club to dismiss all of the Clean Air Act allegations against the Colstrip Generating Station, which was approved by the court on September 6, 2016. As part of the settlement that was signed by all Colstrip owners, Colstrip 1 and 2 owners, PSE and Talen Energy, agreed to retire the two oldest units (Units 1 and 2) no later than July 1, 2022. The Washington Commission allows full recovery in rates of the net book value (NBV) at retirement and related decommissioning costs consistent with prior precedents.
Depreciation rates were updated in the GRC effective December 19, 2017, where PSE's depreciation increased for Colstrip Units 1 and 2 to recover plant costs to the expected shutdown date. The increase in depreciation caused the Colstrip Units 1 and 2 regulatory asset to be reduced to $129.9 million and $127.6 million as of September 30, 2018 and December 31, 2017, respectively. However, the full scope of decommissioning activities and costs may vary from the estimates that are available at this time. The GRC also repurposed PTCs and hydro-related treasury grants to fund and recover decommissioning and remediation costs for Colstrip Units 1 and 2. Additionally, PSE will accelerate the depreciation of Colstrip Units 3 and 4, per the terms of the GRC settlement, to December 31, 2027.
Greenwood
On March 9, 2016, a natural gas explosion occurred in the Greenwood neighborhood of Seattle, WA, damaging multiple structures. The Washington Commission Staff completed its investigation of the incident and filed a complaint on September 20,
58
2016. On March 28, 2017, pipeline safety regulators and PSE reached a settlement in response to the complaint. As part of the agreement, PSE agreed to pay a penalty of $1.5 million, and is currently implementing a comprehensive inspection and remediation program. However, litigation is still pending regarding damage and personal injury claims.
Regional Haze Rule
On January 10, 2017, the U.S. Environmental Protection Agency (EPA) provided revisions to the Regional Haze Rule which were published in the Federal Register. Among other things, these revisions delayed new Regional Haze review from 2018 to 2021, however, the end date will remain 2028. Aspects of these revisions are currently being challenged by various entities nationwide and PSE is unable to predict the outcome.
Clean Air Act 111(d)/EPA Clean Power Plan
In June 2014, the EPA issued a proposed Clean Power Plan (CPP) rule under Section 111(d) of the Clean Air Act designed to regulate GHG emissions from existing power plants. The proposed rule includes state-specific goals and guidelines for states to develop plans for meeting these goals. The EPA published a final rule on October 23, 2015. On March 31, 2017, then EPA Administrator, Scott Pruitt, signed a notice of withdrawal of the proposed CPP federal plan and model trading rules and, on October 10, 2017, the EPA proposed to repeal the CPP rule.
On August 21, 2018, the EPA proposed the Affordable Clean Energy rule to replace the 2015 Clean Power Plan. The Affordable Clean Energy establishes emission guidelines for states to develop plans to address greenhouse gas emissions from existing coal-fired power plants. PSE is still reviewing the draft rule, which will go through a public comment period before it is finalized by EPA, and PSE cannot yet predict a final outcome.
Washington Clean Air Rule
The CAR was adopted on September 15, 2016, in Washington State and attempts to reduce greenhouse gas emissions from “covered entities” located within Washington State. Included under the new rule are large manufacturers, petroleum producers and natural gas utilities, including PSE. The CAR sets a cap on emissions associated with covered entities, which decreases over time approximately 5.0% every three years. Entities must reduce their carbon emissions, or purchase emission reduction units (ERUs), as defined under the rule, from others.
On September 27, 2016, PSE, along with Avista Corporation, Cascade Natural Gas Corporation and NW Natural, filed a lawsuit in the U.S. District Court for the Eastern District of Washington challenging the CAR. On September 30, 2016, the four companies filed a similar challenge to the CAR in Thurston County Superior Court. In March, 2018, the Thurston County Superior Court invalidated the CAR. The Department of Ecology appealed the Superior Court decision in May 2018. As a result of the appeal, direct review to the Washington State Supreme Court was granted and briefing is ongoing. The federal court litigation has been held in abeyance pending resolution of the state case.
Related Party Transactions
In August 2015, PSE filed a proposal with the Washington Commission to develop a LNG facility at the Port of Tacoma. The Tacoma LNG facility will provide peak-shaving services to PSE’s natural gas customers, and will provide LNG as fuel to transportation customers, particularly in the marine market. Following a mediation process and the filing of a settlement stipulation by PSE and all parties, the Washington Commission issued an order on October 31, 2016, that allowed PSE’s parent company, Puget Energy, to create a wholly-owned subsidiary, named Puget LNG, which was formed on November 29, 2016, for the sole purpose of owning, developing and financing the non-regulated activity of the Tacoma LNG facility. Puget LNG has entered into one fuel supply agreement with a maritime customer and is marketing the facility’s expected output to other potential customers.
The Tacoma LNG facility is currently under construction. Pursuant to the Commission’s order, Puget LNG will be allocated approximately 57.0% of the capital and operating costs of the Tacoma LNG facility and PSE will be allocated the remaining 43.0% of the capital and operating costs. PSE and Puget LNG are considered related parties with similar ownership by Puget Energy. Therefore, capital and operating costs that occur under PSE and are allocated to Puget LNG are related party transactions by nature. As of September 30, 2018, Puget LNG has incurred $157.6 million in construction work in progress and operating costs related to Puget LNG’s portion of the Tacoma LNG facility. The portion of the Tacoma LNG facility allocated to PSE will be subject to regulation by the Washington Commission.
59
Item 3. Quantitative and Qualitative Disclosure about Market Risk
The Company is exposed to various forms of market risk, consisting primarily of fluctuations in commodity prices, counterparty credit risk, as well as interest rate risk. PSE maintains risk policies and procedures to help manage the various risks. There have been no material changes to market risks affecting the Company from those set forth in Part II, Item 7A - "Quantitative and Qualitative Disclosures about Market Risk" of the Company’s Annual Report on Form 10-K for the year ended December 31, 2017.
Commodity Price Risk
The nature of serving regulated electric and natural gas customers with its portfolio of owned and contracted electric generation resources exposes PSE and its customers to some volumetric and commodity price risks. PSE’s Energy Management Committee establishes energy risk management policies and procedures to manage commodity and volatility risks and the related effects on credit, tax, accounting, financing and liquidity.
PSE's objective is to minimize commodity price exposure and risks associated with volumetric variability in the natural gas and electric portfolios. It is not engaged in the business of assuming risk for the purpose of speculative trading. PSE hedges open natural gas and electric positions to reduce both the portfolio risk and the volatility risk in prices.
Counterparty Credit Risk
PSE is exposed to credit risk primarily through buying and selling electricity and natural gas to serve customers. Credit risk is the potential loss resulting from a counterparty's non-performance under an agreement. PSE manages credit risk with policies and procedures for counterparty analysis and measurement, monitoring and mitigation of exposure. Additionally, PSE has entered into commodity master arrangements (i.e., WSPP, Inc. (WSPP), International Swaps and Derivatives Association (ISDA) or North American Energy Standards Board (NAESB)) with its counterparties to mitigate credit exposure.
Interest Rate Risk
The Company believes its interest rate risk primarily relates to the use of short-term debt instruments, variable-rate leases and anticipated long-term debt financing needed to fund capital requirements. The Company manages its interest rate risk through the issuance of mostly fixed-rate debt with varied maturities. The Company utilizes internal cash from operations, borrowings under its commercial paper program, and its credit facilities to meet short-term funding needs. Short-term obligations are commonly refinanced with fixed-rate bonds or notes when needed and when interest rates are considered favorable. The Company may also enter into swaps or other financial hedge instruments to manage the interest rate risk associated with the debt.
60
Item 4. Controls and Procedures
Puget Energy
Evaluation of Disclosure Controls and Procedures
Under the supervision and with the participation of Puget Energy’s management, including the President and Chief Executive Officer and Senior Vice President and Chief Financial Officer, Puget Energy has evaluated the effectiveness of its disclosure controls and procedures (as defined in Rule 13a-15(e) under the Securities Exchange Act of 1934) as of September 30, 2018, the end of the period covered by this report. Based upon that evaluation, the President and Chief Executive Officer and Senior Vice President and Chief Financial Officer of Puget Energy concluded that these disclosure controls and procedures are effective.
Changes in Internal Control over Financial Reporting
In May 2018, Puget Energy implemented a financial systems modernization project designed to improve the financial processes, tools and methods used throughout our business. The new/updated systems were used in preparing financial information for the three and nine months ended September 30, 2018. Management monitored developments related to the financial systems modernization project, including working with the project team to ensure control impacts around the consolidation process were identified and documented, in order to assist management in evaluating impact to related internal controls. System integration and user acceptance testing were completed to aid management in its evaluations. Additionally, post-implementation reviews of the system implementation and impacted business processes were conducted to enable management to evaluate the design and effectiveness of internal controls around the consolidations process during the period.
Except as previously described, there have been no changes in Puget Energy's internal control over financial reporting during the quarter ended September 30, 2018 that have materially affected, or are reasonably likely to materially affect, its internal control over financial reporting.
Puget Sound Energy
Evaluation of Disclosure Controls and Procedures
Under the supervision and with the participation of PSE’s management, including the President and Chief Executive Officer and Senior Vice President and Chief Financial Officer, PSE has evaluated the effectiveness of its disclosure controls and procedures (as defined in Rule 13a-15(e) under the Securities Exchange Act of 1934) as of September 30, 2018, the end of the period covered by this report. Based upon that evaluation, the President and Chief Executive Officer and Senior Vice President and Chief Financial Officer of PSE concluded that these disclosure controls and procedures are effective.
Changes in Internal Control over Financial Reporting
In May 2018, Puget Energy implemented a financial systems modernization project designed to improve the financial processes, tools and methods used throughout our business. The new/updated systems were used in preparing financial information for the three and nine months ended September 30, 2018. Management monitored developments related to the financial systems modernization project, including working with the project team to ensure control impacts around the consolidation process were identified and documented, in order to assist management in evaluating impact to related internal controls. System integration and user acceptance testing were completed to aid management in its evaluations. Additionally, post-implementation reviews of the system implementation and impacted business processes were conducted to enable management to evaluate the design and effectiveness of internal controls around the consolidations process during the period.
During 2017, PSE implemented internal controls covering the evaluation and assessment of revenue contracts related to the adoption of the new revenue recognition standard as of January 1, 2018.
Except as previously described, there have been no changes in PSE's internal control over financial reporting during the quarter ended September 30, 2018 that have materially affected, or are reasonably likely to materially affect, PSE's internal control over financial reporting.
61
PART II OTHER INFORMATION
Item 1. Legal Proceedings
Contingencies arising out of the Company's normal course of business existed as of September 30, 2018. Litigation is subject to numerous uncertainties and the Company is unable to predict the ultimate outcome of these matters. For details on legal proceedings, see Note 8, "Commitments and Contingencies" in the Combined Notes to Consolidated Financial Statements in Item I.
Item 1A. Risk Factors
There have been no material changes from the risk factors set forth in Part I, Item 1A, "Risk Factors" of the Company's Annual Report on Form 10-K for the period ended December 31, 2017.
Item 6. Exhibits
Included in the Exhibit Index are a list of exhibits filed as part of this Quarterly Report on Form 10-Q.
62
EXHIBIT INDEX
101 | Financial statements from the Quarterly Report on Form 10-Q of Puget Energy, Inc. and Puget Sound Energy, Inc. for the quarter ended September 30, 2018 filed on October 31, 2018 formatted in XBRL: (i) the Consolidated Statement of Income (Unaudited), (ii) the Consolidated Statements of Comprehensive Income (Unaudited), (iii) the Consolidated Balance Sheets (Unaudited), (iv) the Consolidated Statements of Cash Flows (Unaudited), and (v) the Notes to Consolidated Financial Statements (submitted electronically herewith). |
__________________
* | Filed herewith. |
63
SIGNATURES
Pursuant to the requirements of the Securities Exchange Act of 1934, each registrant has duly caused this report to be signed on their behalf by the undersigned thereunto duly authorized.
PUGET ENERGY, INC. PUGET SOUND ENERGY, INC. | ||
/s/ Stephen King | ||
Stephen King Controller & Principal Accounting Officer | ||
Date: | October 31, 2018 | |
64