Attached files
| file | filename |
|---|---|
| 8-K - FORM 8-K - EL PASO ELECTRIC CO /TX/ | form8k09-30x2018.htm |
| EX-99.01 - EARNINGS PRESS RELEASE - EL PASO ELECTRIC CO /TX/ | exh990109-30x2018.htm |

Third Quarter 2018 Earnings Conference Call November 1, 2018
This Safepresentation includes Harbor statements that are forwardStatement-looking statements made pursuant to the safe harbor provisions of the Section 27A of the Securities Act of 1933, as amended, and Section 21E of the Securities Exchange Act of 1934, as amended, including statements regarding 2018 earnings guidance (including the anticipated impact of ASU 2016-01, Financial Instruments-Recognition and Measurement of Financial Assets and Financial Liabilities); statements regarding the impact of the federal legislation commonly referred to as the Tax Cuts and Jobs Act of 2017 (the “TCJA”); statements regarding current regulatory filings and anticipated regulatory filings; statements regarding expected capital expenditures; and statements regarding the adequacy of our liquidity to meet cash requirements. This information may involve risks and uncertainties that could cause actual results to differ materially from such forward-looking statements. Additional information concerning factors that could cause actual results to differ materially from those expressed in forward- looking statements is contained in El Paso Electric Company’s (“EE” or the “Company”) most recently filed periodic reports and in other filings made by EE with the U.S. Securities and Exchange Commission (the "SEC"), and include, but is not limited to: The impact of the TCJA and other U.S. tax reform legislation Increased prices for fuel and purchased power and the possibility that regulators may not permit EE to pass through all such increased costs to customers or to recover previously incurred fuel costs in rates Full and timely recovery of capital investments and operating costs through rates in Texas and New Mexico Uncertainties and instability in the general economy and the resulting impact on EE’s sales and profitability Changes in customers’ demand for electricity as a result of energy efficiency initiatives and emerging competing services and technologies, including distributed generation Unanticipated increased costs associated with scheduled and unscheduled outages of generating plant Unanticipated maintenance, repair, or replacement costs for generation, transmission, or distribution facilities and the recovery of proceeds from insurance policies providing coverage for such costs The size of our construction program and our ability to complete construction on budget and on time Potential delays in our construction schedule due to legal challenges or other reasons Costs at Palo Verde Deregulation and competition in the electric utility industry Possible increased costs of compliance with environmental or other laws, regulations and policies Possible income tax and interest payments as a result of audit adjustments proposed by the Internal Revenue Service or state taxing authorities Uncertainties and instability in the financial markets and the resulting impact on EE’s ability to access the capital and credit markets Actions by credit rating agencies Possible physical or cyber-attacks, intrusions or other catastrophic events Other factors of which we are currently unaware or deem immaterial EE’s filings are available from the SEC or may be obtained through EE’s website, http://www.epelectric.com. Any such forward-looking statement is qualified by reference to these risks and factors. EE cautions that these risks and factors are not exclusive. Management cautions against putting undue reliance on forward-looking statements or projecting any future results based on such statements or present or prior earnings levels. Forward-looking statements speak only as of the date of this presentation, and EE does not undertake to update any forward-looking statement contained herein. 2
Use of Non-GAAP Financial Measures As required by a recent accounting standard, changes in the fair value of equity securities are now recognized in EE’s Statements of Operations. The adoption of this standard added the potential for significant volatility to the reported results of operations as changes in the fair value of equity securities may occur. Accordingly, in addition to disclosing financial results that are determined in accordance with U.S. generally accepted accounting principles (“GAAP”), EE has provided adjusted net income and adjusted basic earnings per share, both of which are non-GAAP financial measures. Management believes that providing this additional information is useful to investors in understanding EE’s core operating performance because each measure removes the effects of variances that are not indicative of fundamental changes in the earnings capacity of EE. Adjusted net income and adjusted basic earnings per share are calculated by excluding the impact of changes in fair value from EE’s equity securities and realized gains (losses) from the sale of both equity and fixed income securities. Adjusted net income and adjusted basic earnings per share are not measures of financial performance under GAAP and should not be considered as an alternative to net income and earnings per share, respectively. Further, EE’s presentation of any non- GAAP financial measure may not be comparable to similarly titled measures used by other companies. Please refer to slide 17 of this presentation for a reconciliation of adjusted net income and adjusted basic earnings per share to the most directly comparable financial measures, net income and earnings per share, respectively, prepared in accordance with GAAP. 3
3rd Quarter and YTD Financial Results GAAP – 3rd Quarter 2018 net income of $73.3 million (or $1.80 per basic share), compared to 3rd Quarter 2017 net income of $59.7 million (or $1.47 per basic share) Non-GAAP – 3rd Quarter 2018 adjusted net income of $66.0 million (or $1.62 per basic share), compared to 3rd Quarter 2017 adjusted net income of $58.3 million (or $1.44 per basic share)(1) GAAP – 2018 YTD net income of $99.6 million (or $2.45 per basic share), compared to 2017 YTD net income of $91.8 million (or $2.26 per basic share) Non-GAAP – 2018 YTD adjusted net income of $91.9 million (or $2.26 per basic share), compared to 2017 YTD adjusted net income of $84.5 million (or $2.08 per basic share)(1) (1) Adjusted net income and adjusted basic earnings per share are non-GAAP financial measures that reflect net income and basic earnings per share, respectively (the most comparable GAAP financial measures) adjusted to exclude the impact of changes in fair value of EE’s equity securities and realized gains (losses) from the sale of both equity and fixed income securities held in the nuclear decommissioning trust funds. Refer to slide 17 for a reconciliation of adjusted net income and adjusted basic earnings per share (non-GAAP) to net income and basic earnings per share, respectively (the comparable GAAP financial measure). 4

Recent Highlights On September 13, 2018, EE entered into a $350 million amended and restated credit agreement On September 29, 2018, EE was awarded the first ever Community Partner Award from the El Paso Neighborhood Association Coalition On October 15, 2018, EE filed for a 6.99 percent reduction in the Texas fixed fuel factor effective November 1, 2018 On October 18, 2018, Holloman Air Force Base Solar Project became commercially operational 5
Current Regulatory Filings EE filed for approval to expand the Texas Community Solar Facility by 2 MW with the Public Utility Commission of Texas (“PUCT”) PUCT hearing is scheduled for December 4, 2018 EE filed for approval of a 2 MW New Mexico Community Solar facility with the New Mexico Public Regulation Commission (“NMPRC”) On October 31, 2018, the NMPRC dismissed the filing without prejudice 6
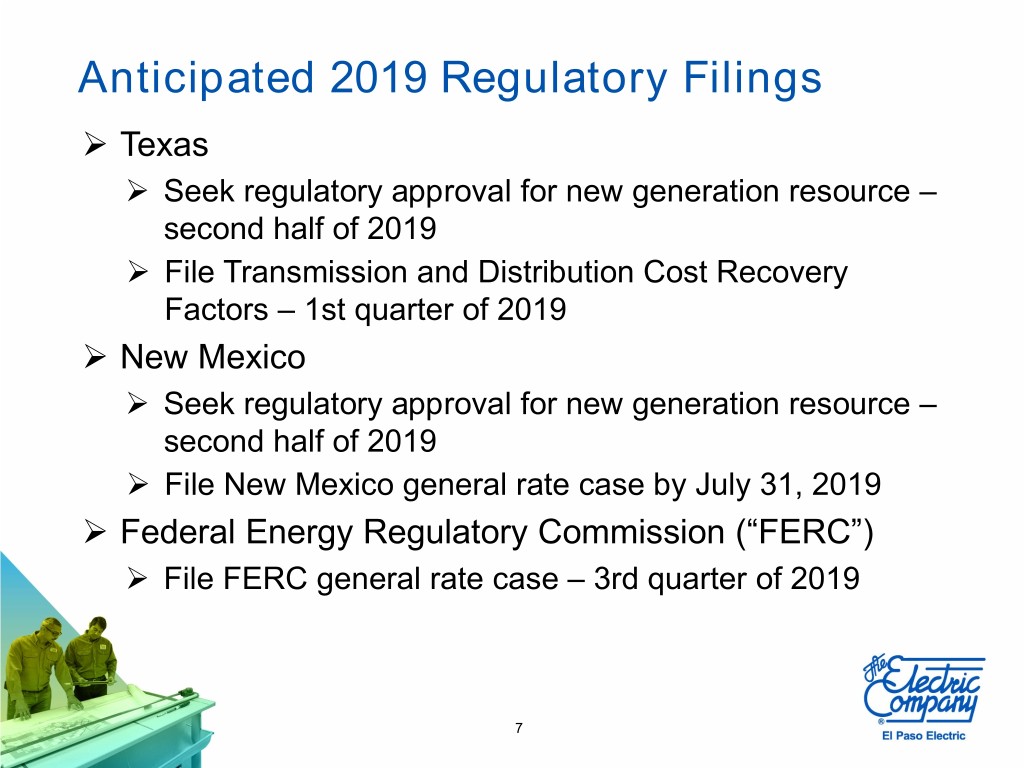
Anticipated 2019 Regulatory Filings Texas Seek regulatory approval for new generation resource – second half of 2019 File Transmission and Distribution Cost Recovery Factors – 1st quarter of 2019 New Mexico Seek regulatory approval for new generation resource – second half of 2019 File New Mexico general rate case by July 31, 2019 Federal Energy Regulatory Commission (“FERC”) File FERC general rate case – 3rd quarter of 2019 7
Smart Community Initiatives Engaging regional stakeholders on smart community initiatives, including the possibility of investing in Advanced Metering Infrastructure Initiatives will help: Improve visibility into the distribution grid Allow for the development of rate more responsive to customer demands In Texas, hope to seek legislative clarification in the first half of 2019 and then begin seeking required regulatory approvals in Texas and New Mexico in early 2020 8
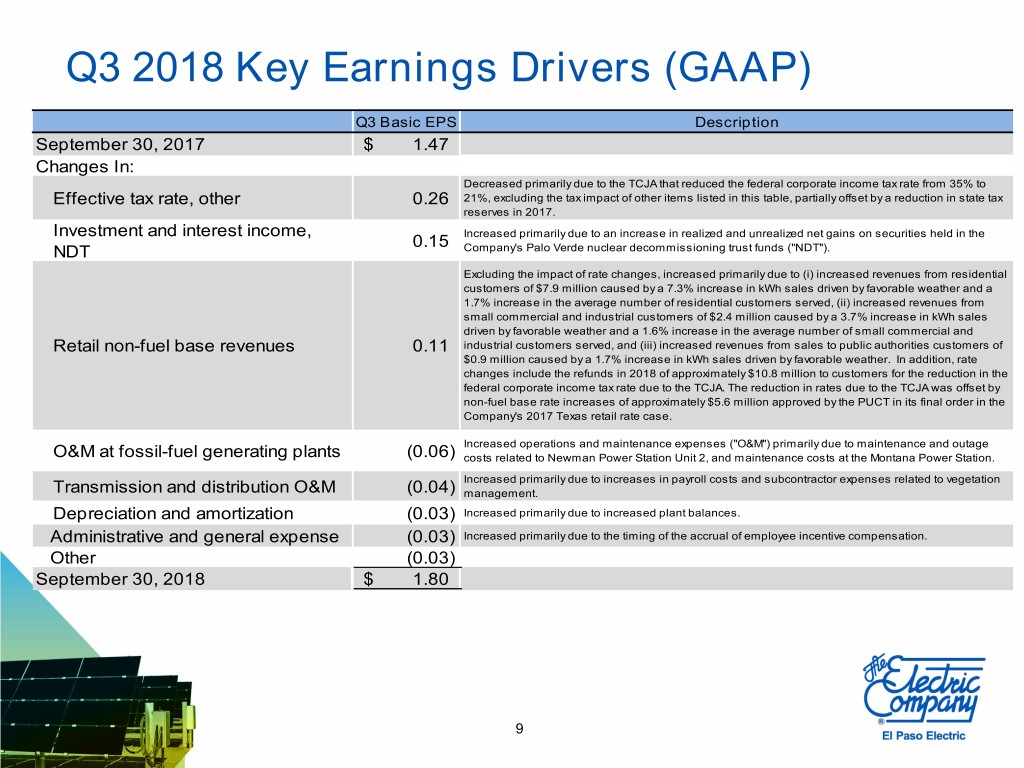
Q3 2018 Key Earnings Drivers (GAAP) Q3 Basic EPS Description September 30, 2017 $ 1.47 Changes In: Decreased primarily due to the TCJA that reduced the federal corporate income tax rate from 35% to Effective tax rate, other 0.26 21%, excluding the tax impact of other items listed in this table, partially offset by a reduction in state tax reserves in 2017. Investment and interest income, Increased primarily due to an increase in realized and unrealized net gains on securities held in the 0.15 NDT Company's Palo Verde nuclear decommissioning trust funds ("NDT"). Excluding the impact of rate changes, increased primarily due to (i) increased revenues from residential customers of $7.9 million caused by a 7.3% increase in kWh sales driven by favorable weather and a 1.7% increase in the average number of residential customers served, (ii) increased revenues from small commercial and industrial customers of $2.4 million caused by a 3.7% increase in kWh sales driven by favorable weather and a 1.6% increase in the average number of small commercial and Retail non-fuel base revenues 0.11 industrial customers served, and (iii) increased revenues from sales to public authorities customers of $0.9 million caused by a 1.7% increase in kWh sales driven by favorable weather. In addition, rate changes include the refunds in 2018 of approximately $10.8 million to customers for the reduction in the federal corporate income tax rate due to the TCJA. The reduction in rates due to the TCJA was offset by non-fuel base rate increases of approximately $5.6 million approved by the PUCT in its final order in the Company's 2017 Texas retail rate case. Increased operations and maintenance expenses ("O&M") primarily due to maintenance and outage O&M at fossil-fuel generating plants (0.06) costs related to Newman Power Station Unit 2, and maintenance costs at the Montana Power Station. Increased primarily due to increases in payroll costs and subcontractor expenses related to vegetation Transmission and distribution O&M (0.04) management. Depreciation and amortization (0.03) Increased primarily due to increased plant balances. Administrative and general expense (0.03) Increased primarily due to the timing of the accrual of employee incentive compensation. Other (0.03) September 30, 2018 $ 1.80 9
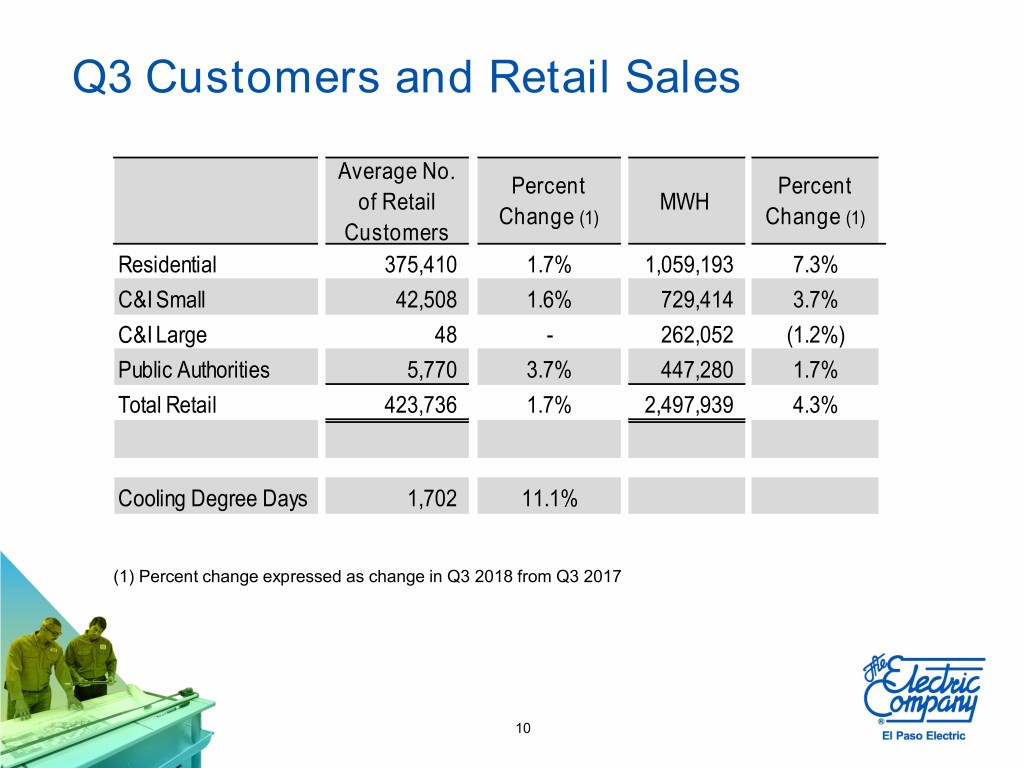
Q3 Customers and Retail Sales Average No. Percent Percent of Retail MWH Change (1) Change (1) Customers Residential 375,410 1.7% 1,059,193 7.3% C&I Small 42,508 1.6% 729,414 3.7% C&I Large 48 - 262,052 (1.2%) Public Authorities 5,770 3.7% 447,280 1.7% Total Retail 423,736 1.7% 2,497,939 4.3% Cooling Degree Days 1,702 11.1% (1) Percent change expressed as change in Q3 2018 from Q3 2017 10

Q3 Historical MWH Sales In Q3 2018, EE established a new record for the most MWH retail sales in any quarter MWH retail sales have grown by approximately 40% since Q3 1998 MWH 2,600,000 2,400,000 2,200,000 2,000,000 1,800,000 1,600,000 1,400,000 1998 1999 2000 2001 2002 2003 2004 2005 2006 2007 2008 2009 2010 2011 2012 2013 2014 2015 2016 2017 2018 11
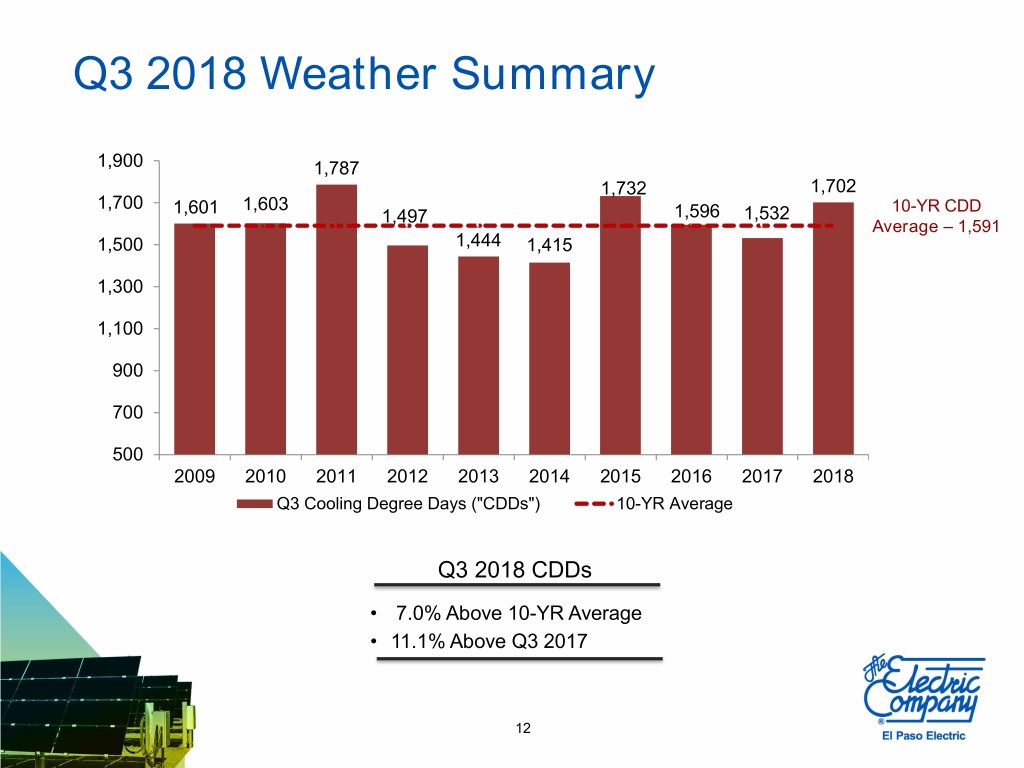
Q3 2018 Weather Summary 1,900 1,787 1,732 1,702 1,700 1,603 10-YR CDD 1,601 1,497 1,596 1,532 Average – 1,591 1,500 1,444 1,415 1,300 1,100 900 700 500 2009 2010 2011 2012 2013 2014 2015 2016 2017 2018 Q3 Cooling Degree Days ("CDDs") 10-YR Average Q3 2018 CDDs • 7.0% Above 10-YR Average • 11.1% Above Q3 2017 12
Capital Requirements and Liquidity On September 30, 2018, EE had liquidity of $346.5 million, including cash and cash equivalents of $16 million and unused capacity under the revolving credit facility Expended $171.4 million for new electric utility plant during the nine months ended September 30, 2018 Capital expenditures for utility plant in 2018 are expected to be approximately $266 million For the nine months ended September 30, 2018, credited approximately $22.6 million to customers for the reduction in the federal corporate income tax rate Paid $42.9 million in cash dividends for the first nine months of the year On July 19, 2018, the Board approved a quarterly cash dividend of $0.36 per share of common stock payable on September 28, 2018 to shareholders of record as of the close of business on September 14, 2018 13

2018 Earnings Guidance EE is adjusting and narrowing guidance: GAAP earnings guidance range to $2.25 - $2.50 per basic share from $2.25 - $2.55 per basic share Non-GAAP earnings guidance range to $2.20 - $2.35 per basic share from $2.05 - $2.30 per basic share GAAP Non - GAAP $2.42 $2.50 $2.35 $2.21 $2.25 $2.20 2017 Basic EPS Actual 2018 Basic EPS 2017 Adjusted Basic 2018 Adjusted Basic Guidance EPS Actual EPS Guidance Guidance assumes normal operations and considers significant variables that may impact earnings, such as weather, expenses, capital expenditures, nuclear decommissioning trust gains/losses, and the impact of the TCJA. The mid-point of the guidance range assumes ten-year average weather (cooling and heating degree days) for the remainder of the year. The GAAP guidance range includes $2.0 million or $0.05 per share to $6.0 million or $0.15 per share, after-tax, of unrealized gains (losses) on equity securities and realized gains (losses) from the sale of both equity and fixed income securities from the Palo Verde decommissioning trust funds. 14
APPENDIX 15
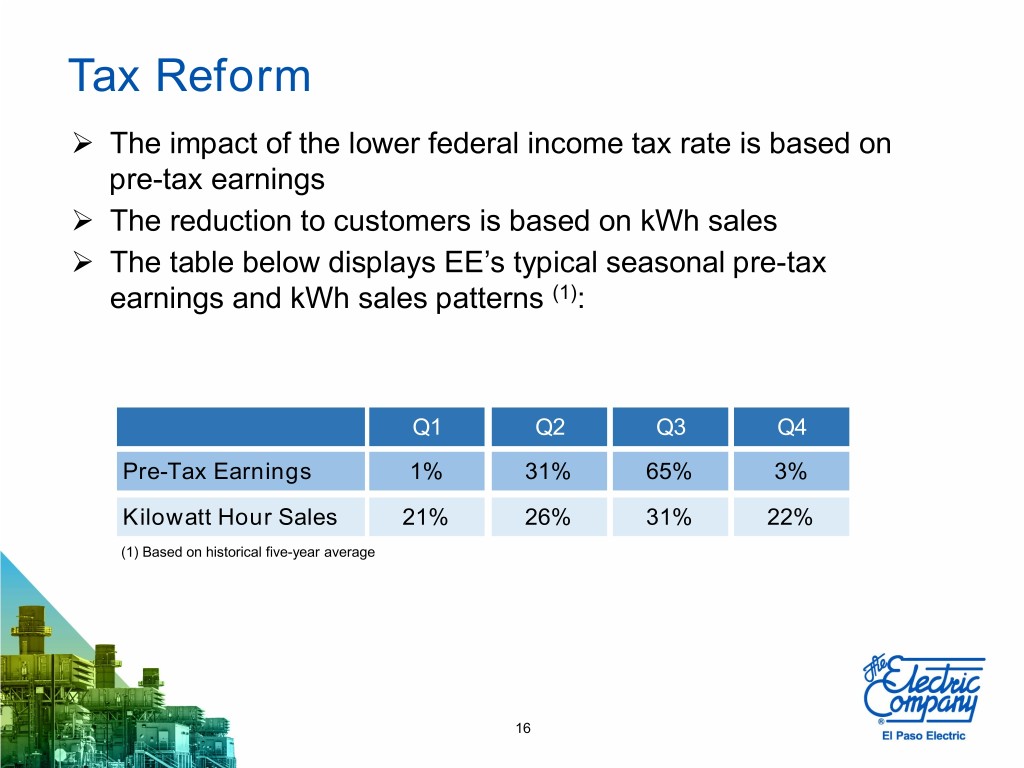
Tax Reform The impact of the lower federal income tax rate is based on pre-tax earnings The reduction to customers is based on kWh sales The table below displays EE’s typical seasonal pre-tax earnings and kWh sales patterns (1): Q1 Q2 Q3 Q4 Pre-Tax Earnings 1% 31% 65% 3% Kilowatt Hour Sales 21% 26% 31% 22% (1) Based on historical five-year average 16
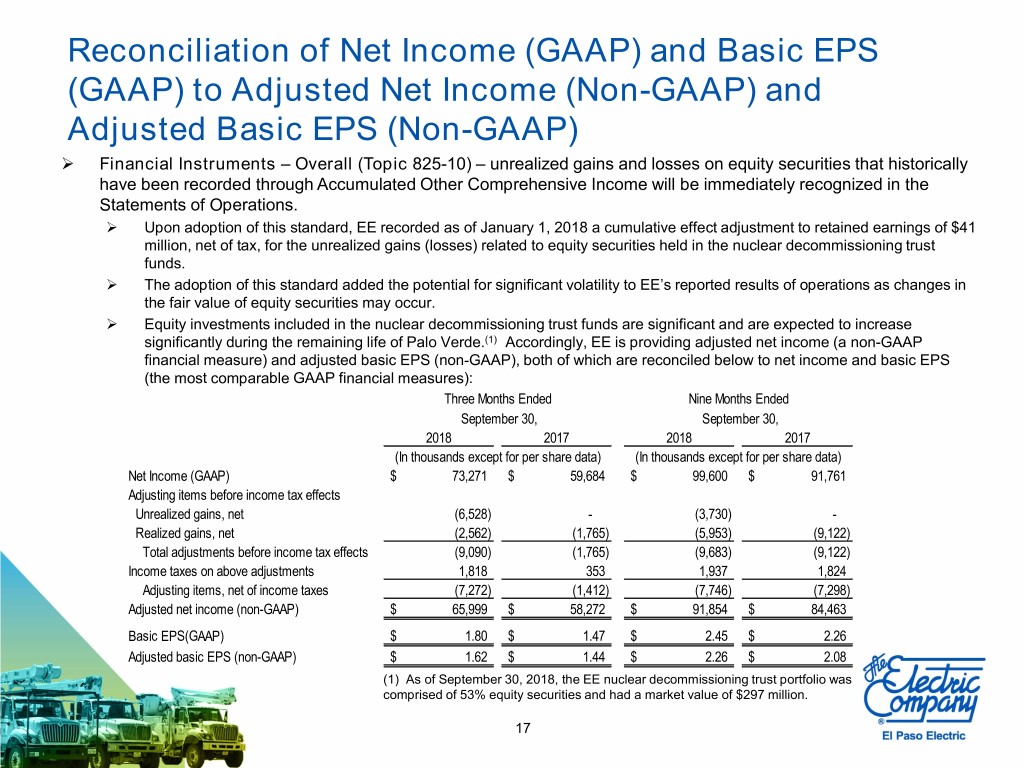
Reconciliation of Net Income (GAAP) and Basic EPS (GAAP) to Adjusted Net Income (Non-GAAP) and Adjusted Basic EPS (Non-GAAP) Financial Instruments – Overall (Topic 825-10) – unrealized gains and losses on equity securities that historically have been recorded through Accumulated Other Comprehensive Income will be immediately recognized in the Statements of Operations. Upon adoption of this standard, EE recorded as of January 1, 2018 a cumulative effect adjustment to retained earnings of $41 million, net of tax, for the unrealized gains (losses) related to equity securities held in the nuclear decommissioning trust funds. The adoption of this standard added the potential for significant volatility to EE’s reported results of operations as changes in the fair value of equity securities may occur. Equity investments included in the nuclear decommissioning trust funds are significant and are expected to increase significantly during the remaining life of Palo Verde.(1) Accordingly, EE is providing adjusted net income (a non-GAAP financial measure) and adjusted basic EPS (non-GAAP), both of which are reconciled below to net income and basic EPS (the most comparable GAAP financial measures): Three Months Ended Nine Months Ended September 30, September 30, 2018 2017 2018 2017 (In thousands except for per share data) (In thousands except for per share data) Net Income (GAAP) $ 73,271 $ 59,684 $ 99,600 $ 91,761 Adjusting items before income tax effects Unrealized gains, net (6,528) - (3,730) - Realized gains, net (2,562) (1,765) (5,953) (9,122) Total adjustments before income tax effects (9,090) (1,765) (9,683) (9,122) Income taxes on above adjustments 1,818 353 1,937 1,824 Adjusting items, net of income taxes (7,272) (1,412) (7,746) (7,298) Adjusted net income (non-GAAP) $ 65,999 $ 58,272 $ 91,854 $ 84,463 Basic EPS(GAAP) $ 1.80 $ 1.47 $ 2.45 $ 2.26 Adjusted basic EPS (non-GAAP) $ 1.62 $ 1.44 $ 2.26 $ 2.08 (1) As of September 30, 2018, the EE nuclear decommissioning trust portfolio was comprised of 53% equity securities and had a market value of $297 million. 17
