Attached files
| file | filename |
|---|---|
| EX-99.2 - EX-99.2 - Destination Maternity Corp | d648391dex992.htm |
| 8-K - FORM 8-K - Destination Maternity Corp | d648391d8k.htm |
Exhibit 99.1

STRATEGIC UPDATE 2018
FORWARD LOOKING STATEMENTS Some of the information in this presentation (as well as information included in oral statements or other written statements made or to be made by us), contains forward-looking statements within the meaning of Section 27A of the Securities Act of 1933, as amended, and Section 21E of the Securities Exchange Act of 1934, as amended. The forward-looking statements involve a number of risks and uncertainties. A number of factors could cause our actual results, performance, achievements or industry results to be materially different from any future results, performance or achievements expressed or implied by these forward-looking statements. These factors include, but are not limited to: the continuation of economic recovery of the retail industry in general and of apparel purchases in particular, our ability to successfully manage our various business initiatives, the success of our international expansion, our ability to successfully manage, retain and expand our leased department and licensed relationships and marketing partnerships, future sales trends in our existing store base and through the Internet, unusual weather patterns, changes in consumer spending patterns, raw material price increases, overall economic conditions and other factors affecting consumer confidence, demographics and other macroeconomic factors that may impact the level of spending for maternity apparel, expense savings initiatives, our ability to anticipate and respond to fashion trends and consumer preferences, unanticipated fluctuations in our operating results, the impact of competition and fluctuations in the price, availability and quality of raw materials and contracted products, availability of suitable store locations, continued availability of capital and financing, our ability to hire and develop senior management and sales associates, our ability to develop and source merchandise, our ability to receive production from foreign sources on a timely basis, potential stock repurchases, potential debt prepayments, the continuation of the regular quarterly cash dividend, the trading liquidity of our common stock, changes in market interest rates, war or acts of terrorism and other factors set forth in the Company’s periodic filings with the Securities and Exchange Commission, or in materials incorporated therein by reference (including those referenced in our Annual Report on Form 10-K under the caption “Risk Factors.”) In addition, these forward-looking statements necessarily depend upon assumptions, estimates and dates that may be incorrect or imprecise and involve known and unknown risks, uncertainties and other factors. Accordingly, any forward-looking statements included in this presentation do not purport to be predictions of future events or circumstances and may not be realized. Forward-looking statements can be identified by, among other things, the use of forward-looking terms such as “believes,” “expects,” “may,” “will,” “should,” “seeks,” “pro forma,” “anticipates,” “intends,” “continues,” “could,” “estimates,” “plans,” “potential,” “predicts,” “goal,” “objective,” or the negative of any of these terms, or comparable terminology, or by discussions of our outlook, plans, goals, strategy or intentions. Forward-looking statements speak only as of the date made. Except as required by applicable law, including the securities laws of the United States and the rules and regulations of the Securities and Exchange Commission, we assume no obligation to update any of these forward-looking statements to reflect actual results, changes in assumptions or changes in other factors affecting these forward-looking statements. 2
CONTENTS SLIDE 4: OUR MISSION SLIDE 5: FINANCIAL OUTLOOK SLIDE 6: DESTINATION -> FORWARD SLIDE 7 & 8: RIGHTSIZING OUR SHIP SLIDE 9 & 10: OPTIMIZING OUR INFRASTRUCTURE SLIDE 11 & 12: PRODUCT INNOVATION AND SOLUTIONS SLIDE 13: ABOUT DESTINATION MATERNITY SLIDE 14: MARKET AND CUSTOMER 3
OUR MISSION TO DELIVER INNOVATIVE SOLUTIONS TO OUR NEW MOMS & MOMS2BE AT THE BUSIEST & MOST JOYFUL TIMES OF THEIR LIVES. OUR MISSION 4
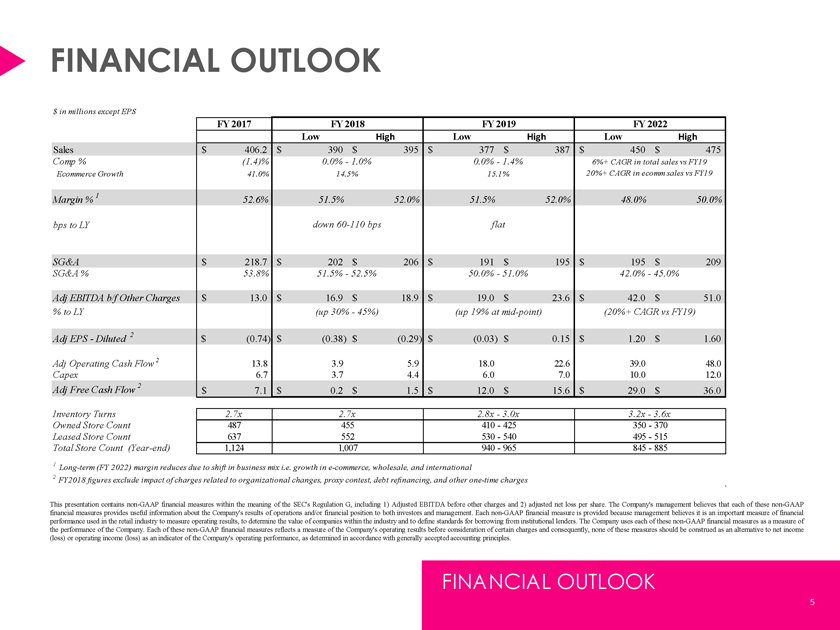
FINANCIAL OUTLOOK $ in millions except EPS FY 2017 FY 2018 FY 2019 FY 2022 Low High Low High Low High Sales $ 406.2 $ 390 $ 395 $ 377 $ 387 $ 450 $ 475 Comp % (1.4)% 0.0% - 1.0% 0.0% - 1.4% 6%+ CAGR in total sales vs FY19 Ecommerce Growth 41.0% 14.5% 15.1% 20%+ CAGR in ecomm sales vs FY19 Margin % 1 52.6% 51.5% 52.0% 51.5% 52.0% 48.0% 50.0% bps to LY down 60-110 bps flat SG&A $ 218.7 $ 202 $ 206 $ 191 $ 195 $ 195 $ 209 SG&A % 53.8% 51.5% - 52.5% 50.0% - 51.0% 42.0% - 45.0% Adj EBITDA b/f Other Charges $ 13.0 $ 16.9 $ 18.9 $ 19.0 $ 23.6 $ 42.0 $ 51.0 % to LY (up 30% - 45%) (up 19% at mid-point) (20%+ CAGR vs FY19) Adj EPS - Diluted 2 $ (0.74) $ (0.38) $ (0.29) $ (0.03) $ 0.15 $ 1.20 $ 1.60 Adj Operating Cash Flow 2 13.8 3.9 5.9 18.0 22.6 39.0 48.0 Capex 6.7 3.7 4.4 6.0 7.0 10.0 12.0 Adj Free Cash Flow 2 $ 7.1 $ 0.2 $ 1.5 $ 12.0 $ 15.6 $ 29.0 $ 36.0 Inventory Turns 2.7x 2.7x 2.8x - 3.0x 3.2x - 3.6x Owned Store Count 487 455 410 - 425 350 - 370 Leased Store Count 637 552 530 - 540 495 - 515 Total Store Count (Year-end) 1,124 1,007 940 - 965 845 - 885 1 Long-term (FY 2022) margin reduces due to shift in business mix i.e. growth in e-commerce, wholesale, and international 2 FY2018 figures exclude impact of charges related to organizational changes, proxy contest, debt refinancing, and other one-time charges This presentation contains non-GAAP financial measures within the meaning of the SEC’s Regulation G, including 1) Adjusted EBITDA before other charges and 2) adjusted net loss per share. The Company’s management believes that each of these non-GAAP financial measures provides useful information about the Company’s results of operations and/or financial position to both investors and management. Each non-GAAP financial measure is provided because management believes it is an important measure of financial performance used in the retail industry to measure operating results, to determine the value of companies within the industry and to define standards for borrowing from institutional lenders. The Company uses each of these non-GAAP financial measures as a measure of the performance of the Company. Each of these non-GAAP financial measures reflects a measure of the Company’s operating results before consideration of certain charges and consequently, none of these measures should be construed as an alternative to net income (loss) or operating income (loss) as an indicator of the Company’s operating performance, as determined in accordance with generally accepted accounting principles. FINANCIAL OUTLOOK 5
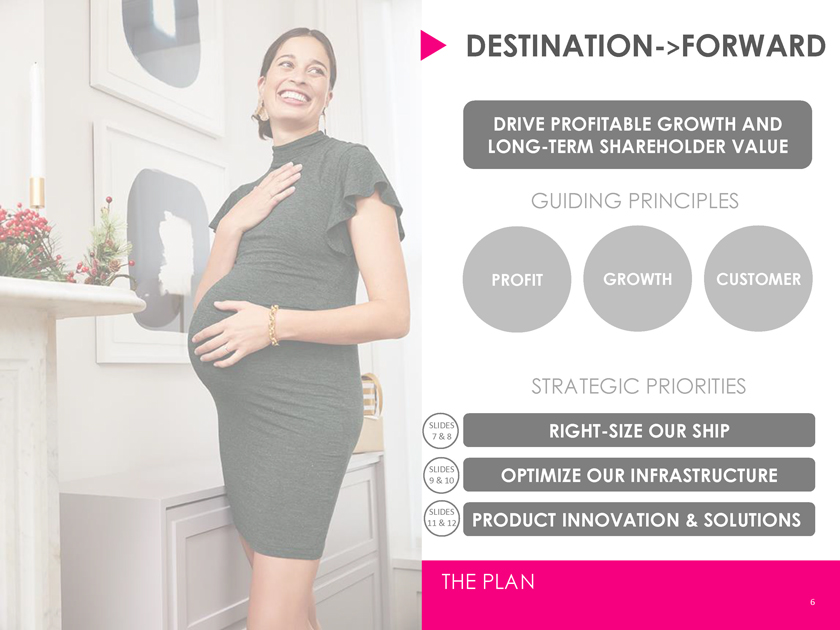
DESTINATION->FORWARD DRIVE PROFITABLE GROWTH AND LONG-TERM SHAREHOLDER VALUE GUIDING PRINCIPLES PROFIT GROWTH CUSTOMER STRATEGIC PRIORITIES SLIDES RIGHT-SIZE OUR SHIP 7 & 8 SLIDES OPTIMIZE OUR INFRASTRUCTURE 9 & 10 SLIDES 11 & 12 PRODUCT INNOVATION & SOLUTIONS THE PLAN 6
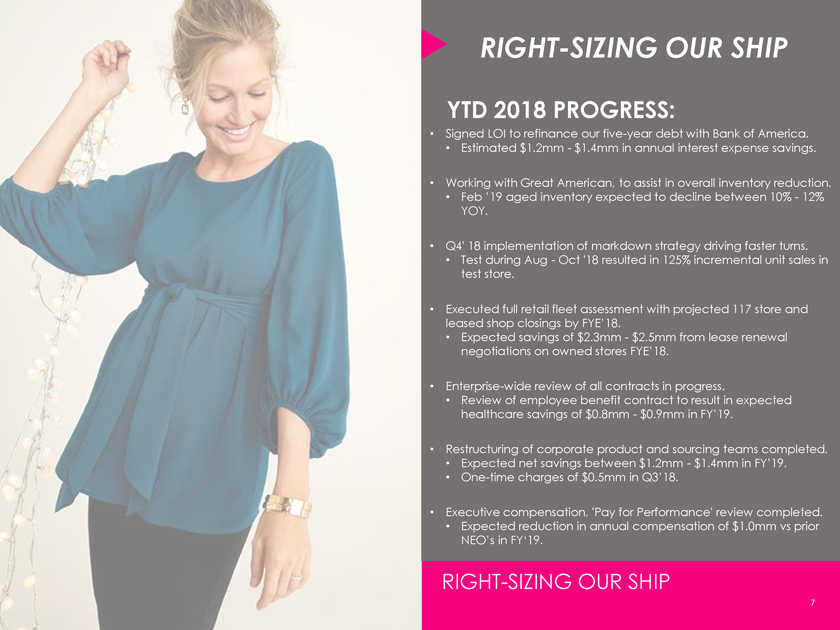
RIGHT-SIZING OUR SHIP YTD 2018 PROGRESS: • Signed LOI to refinance our five-year debt with Bank of America. • Estimated $1.2mm - $1.4mm in annual interest expense savings. • Working with Great American, to assist in overall inventory reduction. • Feb ’19 aged inventory expected to decline between 10% - 12% YOY. • Q4’ 18 implementation of markdown strategy driving faster turns. • Test during Aug - Oct ‘18 resulted in 125% incremental unit sales in test store. • Executed full retail fleet assessment with projected 117 store and leased shop closings by FYE’18. • Expected savings of $2.3mm - $2.5mm from lease renewal negotiations on owned stores FYE’18. • Enterprise-wide review of all contracts in progress. • Review of employee benefit contract to result in expected healthcare savings of $0.8mm - $0.9mm in FY’19. • Restructuring of corporate product and sourcing teams completed. • Expected net savings between $1.2mm - $1.4mm in FY’19. • One-time charges of $0.5mm in Q3’18. • Executive compensation, ‘Pay for Performance’ review completed. • Expected reduction in annual compensation of $1.0mm vs prior NEO’s in FY‘19. RIGHT-SIZING OUR SHIP 7
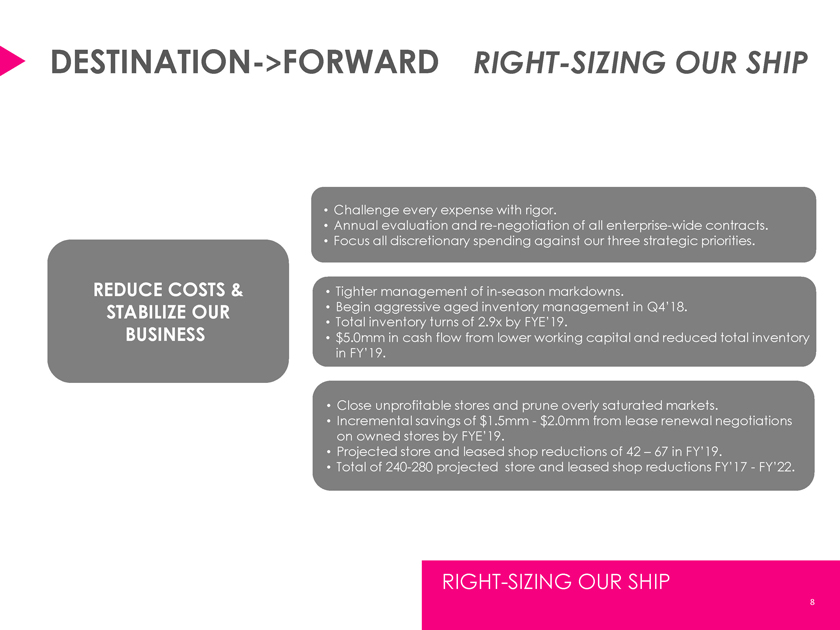
DESTINATION->FORWARD RIGHT-SIZING OUR SHIP • Challenge every expense with rigor. • Annual evaluation and re-negotiation of all enterprise-wide contracts. • Focus all discretionary spending against our three strategic priorities. REDUCE COSTS & • Tighter management of in-season markdowns. STABILIZE OUR • Begin aggressive aged inventory management in Q4’18. • Total inventory turns of 2.9x by FYE’19. BUSINESS • $5.0mm in cash flow from lower working capital and reduced total inventory in FY’19. • Close unprofitable stores and prune overly saturated markets. • Incremental savings of $1.5mm - $2.0mm from lease renewal negotiations on owned stores by FYE’19. • Projected store and leased shop reductions of 42 – 67 in FY’19. • Total of 240-280 projected store and leased shop reductions FY’17 - FY’22. RIGHT-SIZING OUR SHIP 8
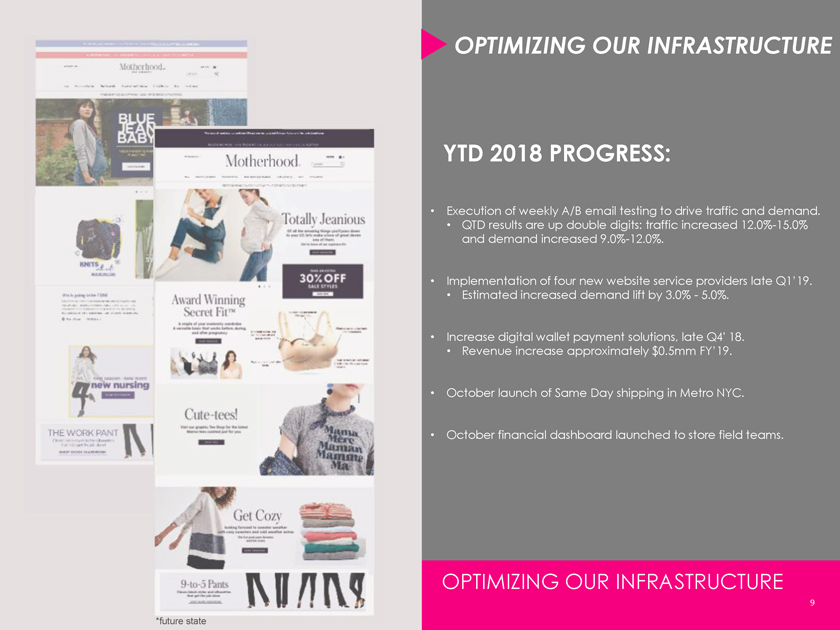
OPTIMIZING OUR INFRASTRUCTURE YTD 2018 PROGRESS: • Execution of weekly A/B email testing to drive traffic and demand. • QTD results are up double digits: traffic increased 12.0%-15.0% and demand increased 9.0%-12.0%. • Implementation of four new website service providers late Q1’19. • Estimated increased demand lift by 3.0% - 5.0%. • Increase digital wallet payment solutions, late Q4’ 18. • Revenue increase approximately $0.5mm FY’19. • October launch of Same Day shipping in Metro NYC. • October financial dashboard launched to store field teams. OPTIMIZING OUR INFRASTRUCTURE 9 *future state
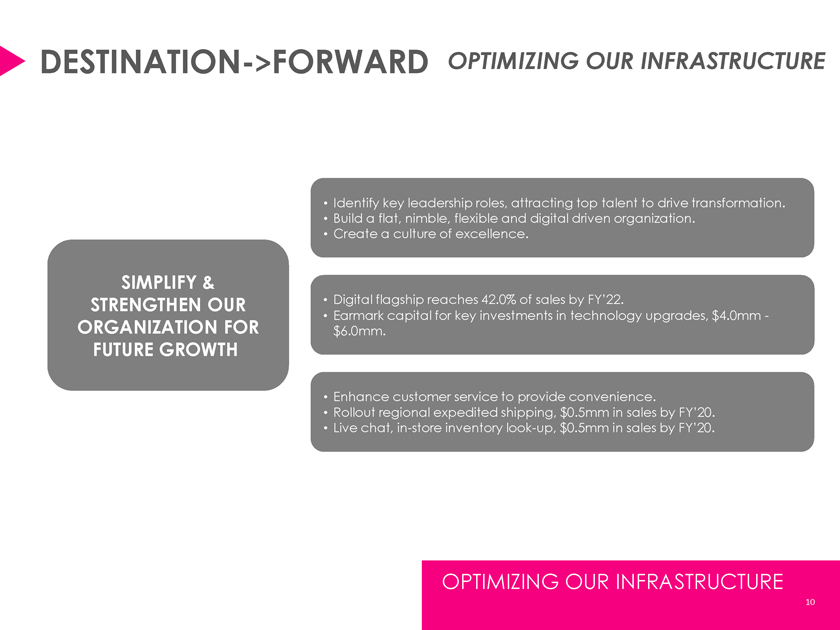
DESTINATION->FORWARD OPTIMIZING OUR INFRASTRUCTURE • Identify key leadership roles, attracting top talent to drive transformation. • Build a flat, nimble, flexible and digital driven organization. • Create a culture of excellence. SIMPLIFY & STRENGTHEN OUR • Digital flagship reaches 42.0% of sales by FY’22. • Earmark capital for key investments in technology upgrades, $4.0mm - ORGANIZATION FOR $6.0mm. FUTURE GROWTH • Enhance customer service to provide convenience. • Rollout regional expedited shipping, $0.5mm in sales by FY’20. • Live chat, in-store inventory look-up, $0.5mm in sales by FY’20. OPTIMIZING OUR INFRASTRUCTURE 10
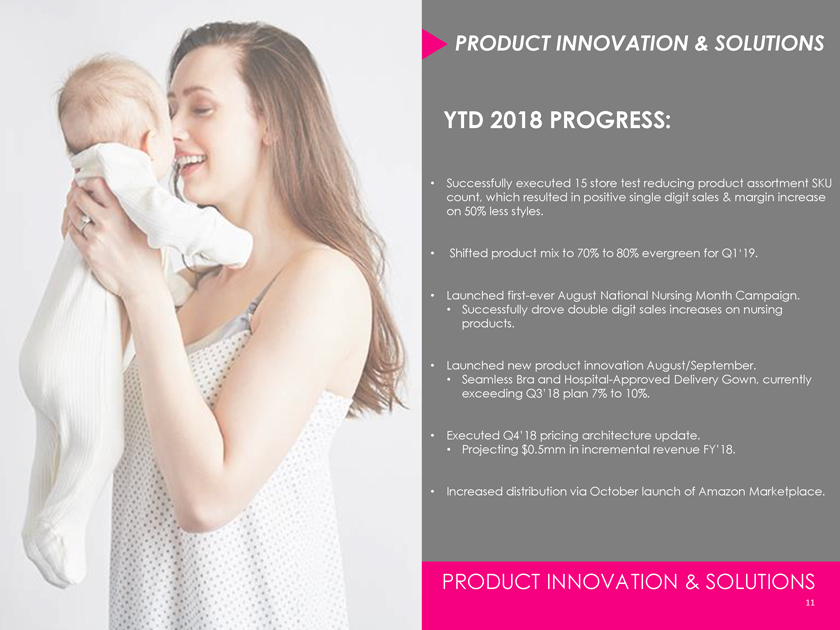
PRODUCT INNOVATION & SOLUTIONS YTD 2018 PROGRESS: • Successfully executed 15 store test reducing product assortment SKU count, which resulted in positive single digit sales & margin increase on 50% less styles. • Shifted product mix to 70% to 80% evergreen for Q1‘19. • Launched first-ever August National Nursing Month Campaign. • Successfully drove double digit sales increases on nursing products. • Launched new product innovation August/September. • Seamless Bra and Hospital-Approved Delivery Gown, currently exceeding Q3’18 plan 7% to 10%. • Executed Q4’18 pricing architecture update. • Projecting $0.5mm in incremental revenue FY’18. • Increased distribution via October launch of Amazon Marketplace. PRODUCT INNOVATION & SOLUTIONS 11
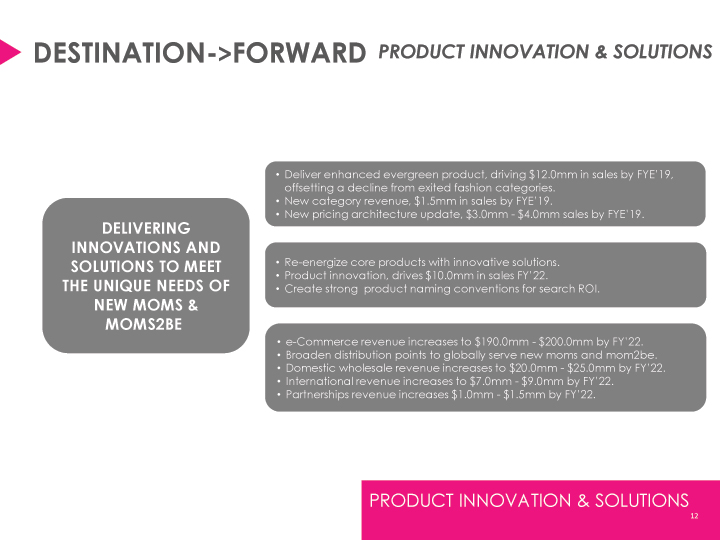
DESTINATION->FORWARD PRODUCT INNOVATION & SOLUTIONS DELIVERING INNOVATIONS AND SOLUTIONS TO MEET THE UNIQUE NEEDS OF NEW MOMS & MOMS2BE • Deliver enhanced evergreen product, driving $12.0mm in sales by FYE’19, offsetting a decline from exited fashion categories. • New category revenue, $1.5mm in sales by FYE’19. • New pricing architecture update, $3.0mm - $4.0mm sales by FYE’19. • Re-energize core products with innovative solutions. • Product innovation, drives $10.0mm in sales FY’22. • Create strong product naming conventions for search ROI. • e-Commerce revenue increases to $190.0mm - $200.0mm by FY’22. • Broaden distribution points to globally serve new moms and mom2be. • Domestic wholesale revenue increases to $20.0mm - $25.0mm by FY’22. • International revenue increases to $7.0mm - $9.0mm by FY’22. • Partnerships revenue increases $1.0mm - $1.5mm by FY’22. PRODUCT INNOVATION & SOLUTIONS 12
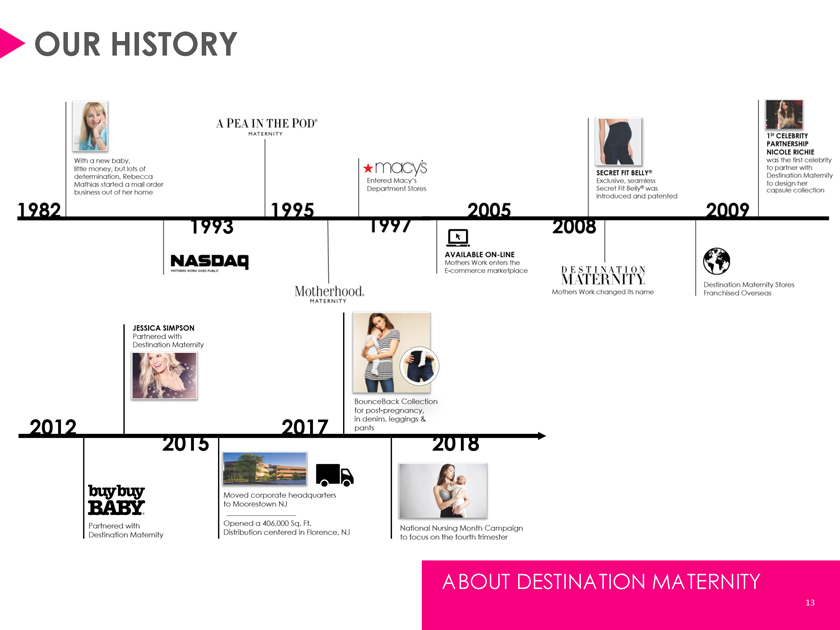
OUR HISTORY ABOUT DESTINATION MATERNITY 13
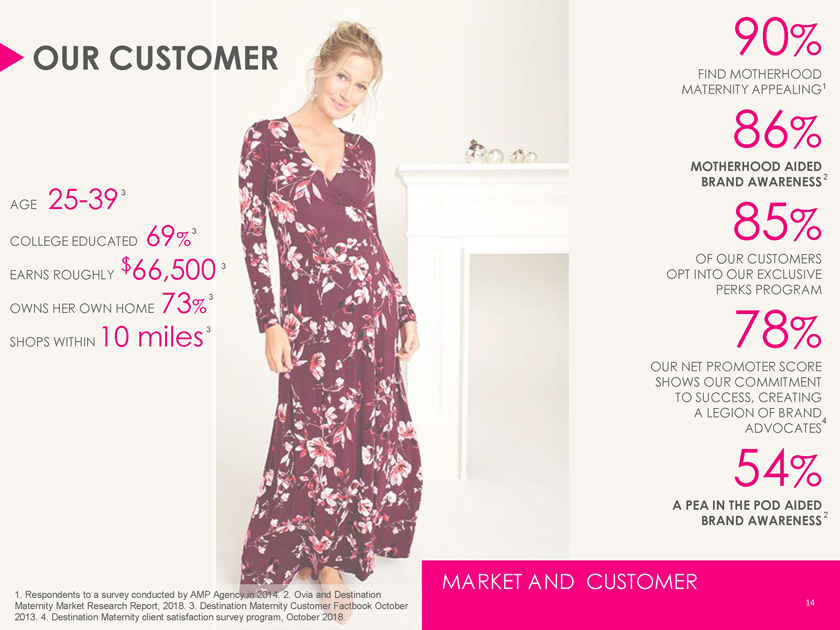
OUR CUSTOMER 25-393 AGE 3 COLLEGE EDUCATED 69% $ 3 EARNS ROUGHLY 66,500 OWNS HER OWN HOME 73%3 miles3 SHOPS WITHIN 10 1. Respondents to a survey conducted by AMP Agency in 2014. 2. Ovia and Destination Maternity Market Research Report, 2018. 3. Destination Maternity Customer Factbook October 2013. 4. Destination Maternity client satisfaction survey program, October 2018. 90% FIND MOTHERHOOD MATERNITY APPEALING1 86% MOTHERHOOD AIDED BRAND AWARENESS2 85% OF OUR CUSTOMERS OPT INTO OUR EXCLUSIVE PERKS PROGRAM 78% OUR NET PROMOTER SCORE SHOWS OUR COMMITMENT TO SUCCESS, CREATING A LEGION OF BRAND 4 ADVOCATES 54% A PEA IN THE POD AIDED BRAND AWARENESS 2 MARKET AND CUSTOMER 14
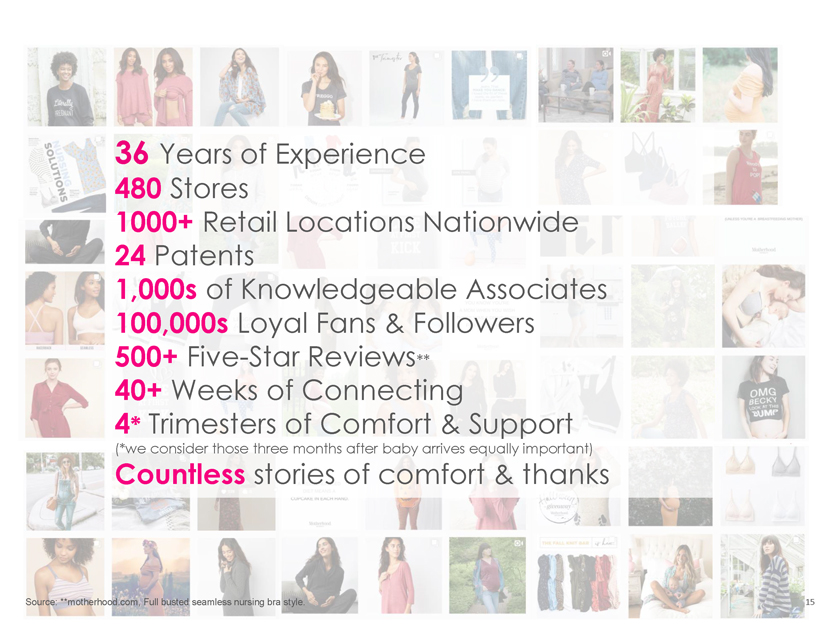
36 Years of Experience 480 Stores 1000+ Retail Locations Nationwide 24 Patents 1,000s of Knowledgeable Associates 100,000s Loyal Fans & Followers 500+ Five-Star Reviews** 40+ Weeks of Connecting 4* Trimesters of Comfort & Support (*we consider those three months after baby arrives equally important) Countless stories of comfort & thanks Source: **motherhood.com, Full busted seamless nursing bra style. 15