Attached files
| file | filename |
|---|---|
| EX-99.1 - TMUS EXHIBIT 99.1 - T-Mobile US, Inc. | tmus09302018ex991.htm |
| 8-K - TMUS FORM 8-K - T-Mobile US, Inc. | tmus09302018form8-k.htm |
EXHIBIT 99.2

1
T-Mobile US, Inc. | ||
Investor Factbook | ||
T-Mobile US Reports Third Quarter 2018 Results | ||
T-Mobile Delivers Its Best Financials Ever and Strong Customer Growth in Q3
Record Service Revenues and Total Revenues, Strong Net Income and Record Adj. EBITDA along with 1.6M Customer Net Additions and Record Low Q3 Postpaid Phone Churn
Record Financial Performance (all percentages year-over-year)
• | Record Service revenues of $8.1 billion, up 6% — led the industry in YoY growth for the 18th consecutive quarter |
• | Record Total revenues of $10.8 billion, up 8% — led the industry in YoY growth once again |
• | Strong Net income of $795 million, up 45% and diluted earnings per share (EPS) of $0.93, up 48% |
• | Record Adjusted EBITDA(1) of $3.2 billion, up 15% |
• | Net cash provided by operating activities(3) of $914 million for Q3 2018 and $2.9 billion for YTD 2018 |
• | Free Cash Flow(1)(3) of $890 million for Q3 2018 and $2.3 billion for YTD 2018 |
Industry-Leading Customer Growth
• | 1.6 million total net additions — 22nd consecutive quarter with more than 1 million net additions |
• | 1.1 million total branded postpaid net additions — led the industry once again |
• | 774,000 branded postpaid phone net additions — led the industry for the 19th consecutive quarter |
• | 35,000 branded prepaid net additions — “MetroTM by T-Mobile” launched on October 8th |
• | Record low Q3 branded postpaid phone churn of 1.02% — down 21 bps YoY compared to down 15 bps in Q2 2018 |
Network Expansion Continues
• | T-Mobile now covers 324 million people with 4G LTE - targeting 325 million people by year-end 2018 |
• | Aggressive deployment of 600 MHz in Q3 2018, reaching more than 1,500 cities and towns in 37 states and Puerto Rico |
• | 21 devices currently compatible with 600 MHz including latest iPhone generation |
• | Fastest 4G LTE network for 19th consecutive quarter based on analysis by Ookla® of Speedtest Intelligence® data |
Continued Strong Outlook for 2018
• | Increased and narrowed target for branded postpaid net customer additions to 3.8 to 4.1 million |
• | Net income is not available on a forward-looking basis(2) |
• | Increased and narrowed Adjusted EBITDA target to $11.8 to $12.0 billion including leasing revenues of $0.6 to $0.7 billion(1) (leasing revenues now expected at the high end of the guidance range) |
• | Cash purchases of property and equipment, excluding capitalized interest, of $4.9 to $5.3 billion, unchanged from the prior target range, still expected to come in at the high end of the range |
• | Three-year compound annual growth rates (CAGRs) for Net cash provided by operating activities and Free Cash Flow from FY 2016 to FY 2019 also unchanged at 7% - 12% and 46% - 48%, respectively(1)(3) |
________________________________________________________________
(1) | Adjusted EBITDA is a non-GAAP financial measure and Free Cash Flow is a non-GAAP financial metric. These non-GAAP financial items should be considered in addition to, but not as a substitute for, the information provided in accordance with GAAP. Reconciliations for these non-GAAP financial items to the most directly comparable financial items based on GAAP as of September 30, 2018 are provided in the Reconciliation of Non-GAAP Financial Measures to GAAP Financial Measures tables. |
(2) | We are not able to forecast net income on a forward-looking basis without unreasonable efforts due to the high variability and difficulty in predicting certain items that affect GAAP net income including, but not limited to, income tax expense, stock based compensation expense and interest expense. Adjusted EBITDA should not be used to predict net income as the difference between the two measures is variable. |
(3) | In Q1 2018, the adoption of the new cash flow accounting standard resulted in a reclassification of cash flows related to the deferred purchase price from securitization transactions from operating activities to investing activities. In addition, cash flows related to debt prepayment and extinguishment costs were reclassified from operating activities to financing activities. In Q1 2018, we redefined Free Cash Flow to reflect the above changes in classification and present cash flows on a consistent basis for investor transparency. The effects of this change are applied retrospectively and are provided in the Reconciliation of Non-GAAP Financial Measures to GAAP Financial Measures tables. |
2
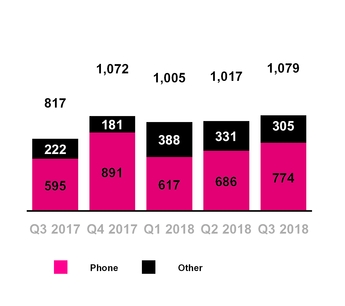
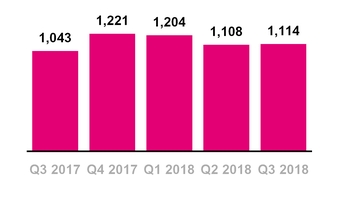
Total Branded Postpaid Net Additions
(in thousands)
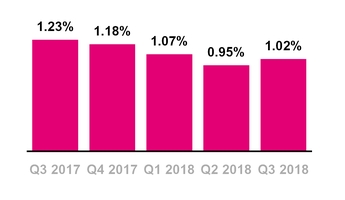
Branded Postpaid Phone Churn
CUSTOMER METRICS
Branded Postpaid Customers
▪ | Branded postpaid phone net customer additions were 774,000 in Q3 2018, compared to 686,000 in Q2 2018 and 595,000 in Q3 2017. This marks the 19th consecutive quarter that T-Mobile led the industry in branded postpaid phone net customer additions. |
▪ | The sequential increase was due to continued growth in existing and Greenfield markets and the growing success of new customer segments such as T-Mobile for Business, T-Mobile ONE Unlimited 55+, and T-Mobile ONE Military as well as higher gross customer additions driven by seasonality. |
▪ | Year-over-year, branded postpaid phone net customer additions increased driven by lower churn, continued growth in existing and Greenfield markets and the growing success of new customer segments such as T-Mobile for Business, T-Mobile ONE Unlimited 55+, and T-Mobile ONE Military. |
▪ | Branded postpaid other net customer additions were 305,000 in Q3 2018, compared to 331,000 in Q2 2018 and 222,000 in Q3 2017. |
▪ | The sequential decrease was due to lower gross customer additions from wearables. |
▪ | The year-over-year increase was primarily due to higher gross customer additions from wearables. |
▪ | Branded postpaid net customer additions were 1,079,000 in Q3 2018, compared to 1,017,000 in Q2 2018 and 817,000 in Q3 2017. |
▪ | Branded postpaid phone churn was a Q3 record-low 1.02% in Q3 2018, up 7 basis points from 0.95% in Q2 2018 and down 21 basis points from 1.23% in Q3 2017. |
▪ | The sequential increase was due to seasonality, partially offset by increased customer satisfaction and loyalty from ongoing improvements to network quality, industry-leading customer service and the overall value of our offerings in the marketplace. |
▪ | The year-over-year decrease in branded postpaid phone churn was primarily from increased customer satisfaction and loyalty from ongoing improvements to network quality, industry-leading customer service and the overall value of our offerings in the marketplace. |
3
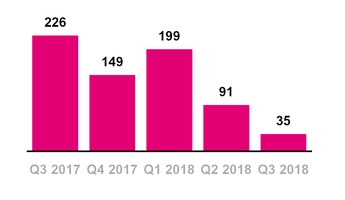
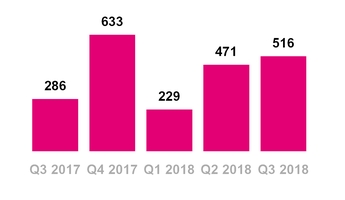
Total Branded Prepaid Net Additions
(in thousands)
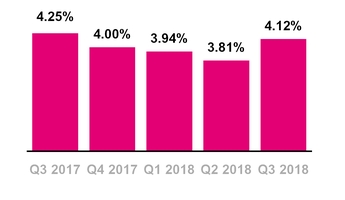
Branded Prepaid Churn
Total Branded Net Additions
(in thousands)
Branded Prepaid Customers
▪ | Branded prepaid net customer additions were 35,000 in Q3 2018, compared to 91,000 in Q2 2018 and 226,000 in Q3 2017. |
▪ | Sequentially, the decrease was primarily due to higher churn from increased competitive activity in the marketplace. |
▪ | The year-over-year decrease was primarily due to increased competitive activity in the marketplace, partially offset by lower migrations to branded postpaid plans. |
▪ | Migrations to branded postpaid plans reduced branded prepaid net customer additions in Q3 2018 by approximately 140,000, up from 135,000 in Q2 2018 and down from 165,000 in Q3 2017. |
▪ | Branded prepaid churn was 4.12% in Q3 2018, compared to 3.81% in Q2 2018 and 4.25% in Q3 2017. |
▪ | On October 8, 2018, MetroPCS was rebranded “Metro by T-Mobile.” This is part of an effort to highlight the links between MetroPCS and T-Mobile in an increasingly competitive prepaid market. As part of the re-branding, Metro by T-Mobile also launched several attractive new unlimited rate plans that include premium features such as Amazon Prime and Google One. |
Total Branded Customers
▪ | Total branded net customer additions were 1,114,000 in Q3 2018, compared to 1,108,000 in Q2 2018 and 1,043,000 in Q3 2017. |
4
Wholesale Net Additions
(in thousands)
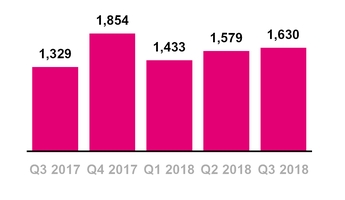
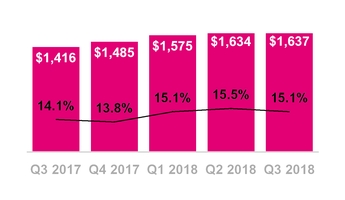
Total Net Additions
(in thousands)
Wholesale Customers
▪ | Wholesale net customer additions were 516,000 in Q3 2018, compared to net additions of 471,000 in Q2 2018 and 286,000 in Q3 2017. |
▪ | Sequentially and year-over-year, the increase was primarily due to higher mobile virtual network operator (“MVNO”) net customer additions. |
Total Customers
▪ | Total net customer additions were 1,630,000 in Q3 2018, compared to 1,579,000 in Q2 2018 and 1,329,000 in Q3 2017. This is the 22nd consecutive quarter in which T-Mobile has added more than one million total net customers. |
▪ | T-Mobile ended Q3 2018 with 77.2 million total customers. |
5
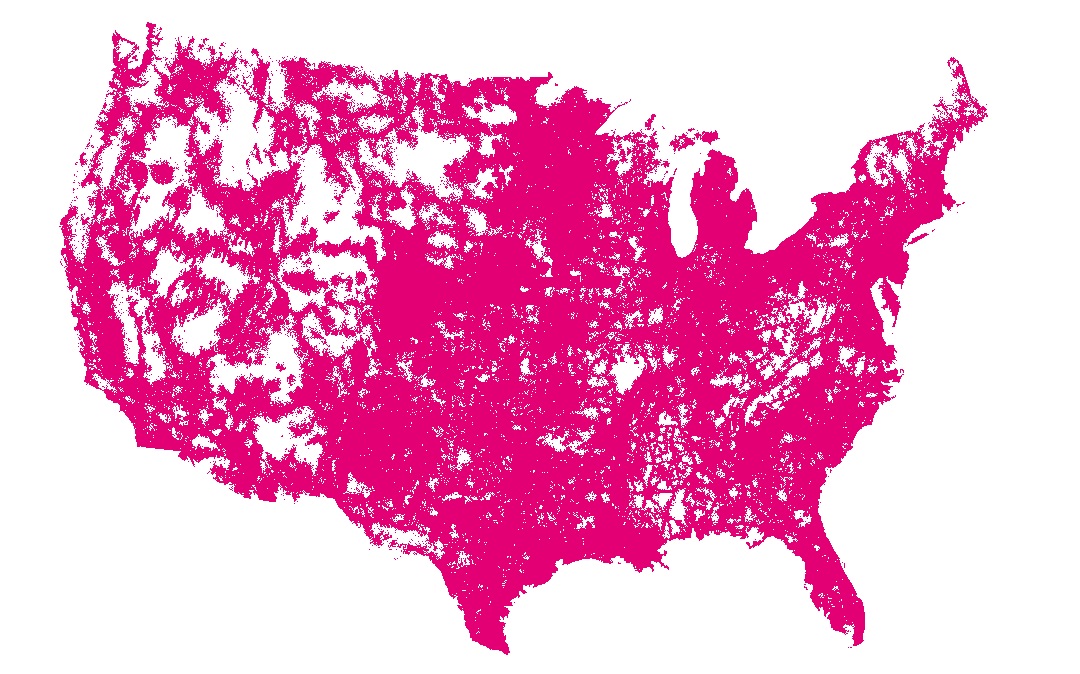
T-Mobile Coverage Map
(as of September 30, 2018)
4G LTE Download Speeds and
Upload Speeds - Q3 2018
(in Mbps, D/L at Base, U/L at Top)
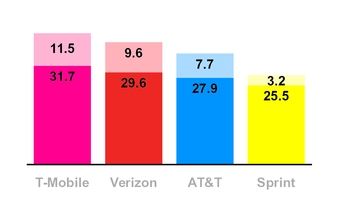
Based on analysis by Ookla® of Speedtest Intelligence® data.
NETWORK
▪ | T-Mobile continues to increase and expand the speed and capacity of our network to better serve our customers. Our advancements in network technology and our spectrum resources ensure we can continue to increase the capabilities of our network as the industry moves towards 5G. |
Spectrum Position
▪ | At the end of Q3 2018, T-Mobile owned an average of 110 MHz of spectrum nationwide. The spectrum comprises an average of 31 MHz in the 600 MHz band, 10 MHz in the 700 MHz band, 29 MHz in the 1900 MHz PCS band and 40 MHz in the AWS band. |
▪ | T-Mobile also owns millimeter wave spectrum that comprises an average of 264 MHz covering over 110 million POPs in the 28 GHz band and 105 MHz covering nearly 45 million POPs in the 39 GHz band. |
▪ | T-Mobile will evaluate future spectrum purchases in upcoming auctions and in the secondary market to augment its current spectrum position. |
Network Coverage Growth
▪ | T-Mobile continues to expand its coverage breadth and now covers 324 million people with 4G LTE. |
▪ | By the end of 2018, we are targeting to cover 325 million people with 4G LTE. |
▪ | To achieve this coverage target, T-Mobile expects to increase the number of macro towers and small cell sites it leases. At the end of Q3 2018, T-Mobile had equipment deployed on approximately 64,000 macro towers and 20,000 small cell/distributed antenna system (“DAS”) sites. We remain on plan to roll out approximately 20,000 small cells through 2019. |
Network Speed Leadership
▪ | We offer the fastest nationwide 4G LTE upload and download speeds in the United States. This is the 19th consecutive quarter we have led the industry in both categories, and this is based on the results of millions of user-generated speed tests. |
▪ | In Q3 2018, T-Mobile’s average 4G LTE download speed was 31.7 Mbps, compared to Verizon at 29.6 Mbps, AT&T at 27.9 Mbps and Sprint at 25.5 Mbps. |
6
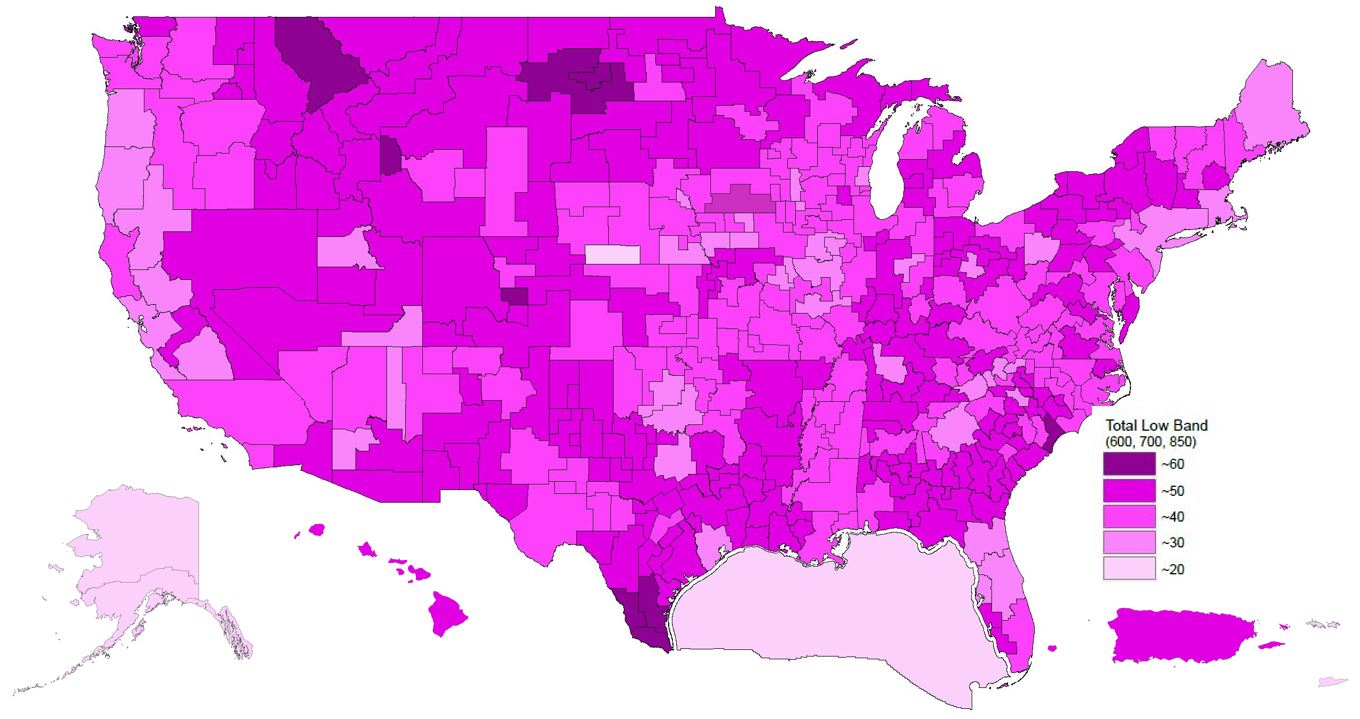
Depth of T-Mobile’s Nationwide Low-Band Spectrum (600 MHz and 700 MHz)
▪ | In Q3 2018, T-Mobile’s average 4G LTE upload speed was 11.5 Mbps, compared to Verizon at 9.6 Mbps, AT&T at 7.7 Mbps and Sprint at 3.2 Mbps. |
600 MHz Spectrum Update
▪ | At the end of Q3 2018, T-Mobile owned a nationwide average of 31 MHz of 600 MHz low-band spectrum. T-Mobile now owns approximately 41 MHz in the low-band (600 MHz and 700 MHz), quadrupling its pre-auction low-band holdings. The purchased spectrum covers 100% of the U.S. |
▪ | T-Mobile has started deployment of 600 MHz spectrum on an aggressive schedule. At the end of Q3 2018, we were live in over 1,500 cities and towns in 37 states and Puerto Rico. Combining 600 and 700 MHz spectrum, we have deployed low band spectrum to 291 million POPs. |
▪ | T-Mobile has actively engaged with broadcasters to accelerate FCC spectrum clearance timelines, entering into 76 agreements with several parties. These agreements are expected to, in the aggregate, accelerate clearing, bringing the total clearing target to approximately 132 million POPs expected by year-end 2018. We expect to reach a clearing target of approximately 265 million POPs by year-end 2019. T-Mobile remains committed to assisting broadcasters occupying 600 MHz spectrum to move to new frequencies. |
▪ | We currently have 21 devices compatible with 600 MHz including the latest iPhone generation. |
▪ | We expect our 600 MHz spectrum holdings will be used to deploy America’s first nationwide 5G network by 2020. 4G LTE radios will be upgradeable to support 5G as it becomes available later this year. |
5G Update
▪ | T-Mobile is building out 5G in six of the Top 10 markets, including New York and Los Angeles, and hundreds of cities across the U.S. in 2018. This network will be ready for the introduction of the first 5G smartphones in 2019. We plan on the delivery of a nationwide 5G network in 2020. |
▪ | In Q3 2018, T-Mobile entered into two multi-year contracts that will support the deployment of a nationwide 5G network. On July 30, 2018, T-Mobile and Nokia entered into a multi-year $3.5 billion contract for Nokia to provide T-Mobile with complete end-to-end 5G technology, software and services. On September 11, 2018, T-Mobile and Ericsson announced a multi-year $3.5 billion contract in which Ericsson will provide T-Mobile with the latest 5G New Radio (NR) hardware and software compliant with 3GPP standards. |
7
Tech Experience Truck Reveals the Wireless Future to Customers

Network Capacity Growth
▪ | T-Mobile continues to expand its capacity through the re-farming of existing spectrum and implementation of new technologies including Voice over LTE (“VoLTE”), Carrier Aggregation, 4x4 MIMO, 256 Quadrature Amplitude Modulation (“QAM”), and License Assisted Access (“LAA”). |
▪ | VoLTE comprised 85% of total voice calls in Q3 2018, compared to 83% in Q2 2018 and up from 75% in Q3 2017. Moving voice traffic to VoLTE frees up spectrum and allows for the transition of spectrum currently used for 2G and 3G to 4G LTE. T-Mobile is leading the U.S. wireless industry in the rate of VoLTE adoption. |
▪ | Carrier aggregation is live for T-Mobile customers in 904 markets. This advanced technology delivers superior speed and performance by bonding multiple discrete spectrum channels together. |
▪ | 4x4 MIMO is currently available in 535 markets. This technology effectively delivers twice the speed and incremental network capacity to customers by doubling the number of data paths between the cell site and a customer’s device. We plan to start deploying massive MIMO (FD-MIMO) in selected locations later in 2018. |
▪ | T-Mobile has rolled out 256 QAM in 984 markets. 256 QAM increases the number of bits delivered per transmission to enable faster speeds. T-Mobile is the first carrier globally to have rolled out the combination of carrier aggregation, 4x4 MIMO and 256 QAM. This trifecta of standards has been rolled out to more than 500 markets. |
▪ | T-Mobile has also started rolling out License Assisted Access, a technology which utilizes unused 5 GHz spectrum to augment available bandwidth. The first LAA small cell went live in New York City in Q4 2017 and the technology has since been rolled out to nearly 1,000 cell sites, the vast majority being small cells. Deployments of LAA have also commenced in more than 25 cities including Los Angeles, Philadelphia, Washington DC, Atlanta, Houston, Las Vegas, San Diego and New Orleans. In areas where LAA has been deployed, customers with capable handsets have observed real-life speeds in excess of 500 Mbps. |
▪ | On July 19, 2018, T-Mobile launched its Narrowband Internet of Things (NB-IoT) service nationwide, making it the first to launch NB-IoT in the U.S. and the first in the world to launch NB-IoT in the guard bands for improved efficiency. Built on the 3GPP standard, NB-IoT is a low power, wide area network (LPWAN) LTE-Advanced technology that provides a pathway to 5G IoT and enables many comparable benefits like low power usage, long battery life and low |
device cost.
8

PROPOSED SPRINT TRANSACTIONS
▪ | On April 29, 2018, T-Mobile announced that it had entered into a Business Combination Agreement with Sprint to merge in an all-stock transaction at a fixed exchange ratio of 0.10256 T-Mobile shares for each Sprint share (or the equivalent of 9.75 Sprint shares for each T-Mobile share). The Merger, and other transactions contemplated by the Business Combination Agreement, are referred to as the “Transactions.” |
▪ | The combined company will be named “T-Mobile” and, as a result of the Merger, is expected to be able to rapidly launch a nationwide 5G network, accelerate innovation and increase competition in the U.S. wireless, video and broadband industries. Neither T-Mobile nor Sprint on its own could generate comparable benefits to consumers. The combined company is expected to trade under the (TMUS) symbol on NASDAQ. |
▪ | The Transactions are subject to customary closing conditions, including regulatory approvals, and are expected to close in the first half of 2019. |
▪ | On June 18, 2018, we filed the Public Interest Statement (“PIS”) and applications for approval of the Transactions with the FCC. On July 18, 2018, the FCC issued a Public Notice formally accepting our applications and establishing a period for public comment. |
▪ | On September 11, 2018, the FCC issued a letter informing the Company it is pausing its informal 180-day transaction shot clock to allow for a thorough review by FCC staff and third parties of newly-submitted and anticipated modeling provided by T-Mobile and Sprint. |
▪ | On July 30, 2018, we filed a registration statement on Form S-4 with the SEC related to the Merger. The registration statement became effective on October 29, 2018 and is available on the New T-Mobile website (newtmobile.com). |
9
Devices Sold or Leased | |||||
(in million units) | |||||
Q3 2017 | Q2 2018 | Q3 2018 | |||
Total Company | |||||
Phones | 8.7 | 7.9 | 8.1 | ||
Mobile broadband and IoT devices | 0.5 | 0.5 | 0.6 | ||
Total Company | 9.2 | 8.4 | 8.7 | ||
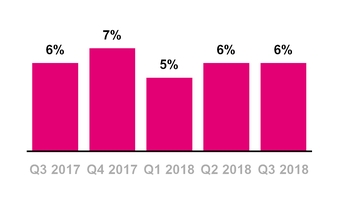
Branded Postpaid Upgrade Rate
DEVICES
▪ | Total devices sold or leased were 8.7 million units in Q3 2018, compared to 8.4 million units in Q2 2018 and 9.2 million units in Q3 2017. |
▪ | Total phones (smartphones and non-smartphones) sold or leased were 8.1 million units in Q3 2018, compared to 7.9 million units in Q2 2018 and 8.7 million units in Q3 2017. |
▪ | The upgrade rate for branded postpaid customers was approximately 6% in Q3 2018, Q2 2018 and Q3 2017. |
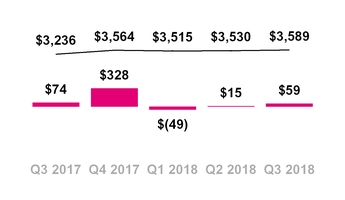
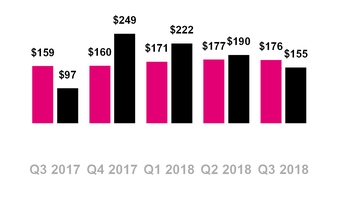
Total EIP Receivables, net and QoQ
Change in Total EIP Receivables
($ in millions)
DEVICE FINANCING
Equipment Installment Plans (EIP)
▪ | T-Mobile provided $1.76 billion in gross EIP device financing to its customers in Q3 2018, up 3.3% from $1.71 billion in Q2 2018 and up 18.5% from $1.49 billion in Q3 2017. |
▪ | Sequentially the increase was primarily due to higher EIP unit sales. |
▪ | Year-over-year the increase was primarily from higher average revenue per device sold. |
▪ | Customers on T-Mobile plans had associated EIP billings of $1.60 billion in Q3 2018, up 1.0% compared to $1.59 billion in Q2 2018 and up 8.1% from $1.48 billion in Q3 2017. EIP billings include prepayments and adjustments. |
▪ | Total EIP receivables, net of imputed discount and allowances for credit losses, were $3.59 billion at the end of Q3 2018, compared to $3.53 billion at the end of Q2 2018 and $3.24 billion at the end of Q3 2017. |
10
Leased Devices Transferred to P&E,
Net and Lease Revenues
($ in millions)
Leasing Plans
▪ | Leased devices transferred to property and equipment from inventory, net was $155 million in Q3 2018, compared to $190 million in Q2 2018 and $97 million in Q3 2017. |
▪ | The sequential decrease was primarily due to a lower number of devices leased. |
▪ | The year-over-year increase was primarily due to fewer lease device buyouts and a higher cost per device due to a decline of affordable devices added to the leasing program, partially offset by a lower number of phones leased. |
▪ | Depreciation expense associated with leased devices was $245 million in Q3 2018, compared to $238 million in Q2 2018 and $189 million in Q3 2017. |
▪ | The sequential increase was primarily due to a higher cost per device added to the leasing program due to a decline of affordable devices leased. |
▪ | The year-over-year increase is due to a higher volume of active leased devices, and a decrease in the useful lives for leased devices, partially offset by a higher mix of affordable phones in the base. |
▪ | Leased devices included in property and equipment, net were $653 million at the end of Q3 2018, compared to $743 million at the end of Q2 2018 and $739 million at the end of Q3 2017. |
▪ | Lease revenues were $176 million in Q3 2018, compared to $177 million in Q2 2018 and $159 million in Q3 2017. |
11
Current Quarter Impact from New revenue standard | |||||||||||
(in millions, except per share and operating metric amounts) | |||||||||||
Increase (decrease) | Previous revenue standard | New revenue standard | Difference | ||||||||
Revenues | |||||||||||
Total service revenues | $ | 8,022 | $ | 8,066 | $ | 44 | |||||
Equipment revenues | 2,286 | 2,391 | 105 | ||||||||
Other revenues | 382 | 382 | — | ||||||||
Total revenues | 10,690 | 10,839 | 149 | ||||||||
Operating expenses | |||||||||||
Cost of services | 1,562 | 1,586 | 24 | ||||||||
Cost of equipment sales | 2,867 | 2,862 | (5 | ) | |||||||
Selling, general and administrative | 3,320 | 3,314 | (6 | ) | |||||||
Depreciation and amortization | 1,637 | 1,637 | — | ||||||||
Total operating expenses | 9,386 | 9,399 | 13 | ||||||||
Operating income | 1,304 | 1,440 | 136 | ||||||||
Other expense, net | (310 | ) | (310 | ) | — | ||||||
Income before income taxes | 994 | 1,130 | 136 | ||||||||
Income tax expense | (300 | ) | (335 | ) | (35 | ) | |||||
Net income | $ | 694 | $ | 795 | $ | 101 | |||||
Earnings per share - basic | $ | 0.82 | $ | 0.94 | $ | 0.12 | |||||
Earnings per share - diluted | $ | 0.81 | $ | 0.93 | $ | 0.12 | |||||
Operating metrics | |||||||||||
Branded postpaid phone ARPU | $ | 46.15 | $ | 46.17 | $ | 0.02 | |||||
Branded postpaid ABPU | $ | 57.68 | $ | 57.69 | $ | 0.01 | |||||
Branded prepaid ARPU | $ | 38.36 | $ | 38.34 | $ | (0.02 | ) | ||||
Non-GAAP financial measures | |||||||||||
Adjusted EBITDA (1) | $ | 3,103 | $ | 3,239 | $ | 136 | |||||
(1) | Adjusted EBITDA is a non-GAAP financial measure. This non-GAAP financial item should be considered in addition to, but not as a substitute for, the information provided in accordance with GAAP. A reconciliation of this non-GAAP financial item to the most directly comparable financial items based on GAAP as of September 30, 2018 is provided in the Reconciliation of Non-GAAP Financial Measures to GAAP Financial Measures tables. |
New Accounting Pronouncements
▪ | The discussion and analysis below reflects the impact from accounting pronouncements adopted during the current year including: |
▪ | ASU 2016-15, “Statement of Cash Flows (Topic 230): Classification of Certain Cash Receipts and Cash Payments,” and |
▪ | ASU 2014-09, “Revenue from Contracts with Customers (Topic 606)” and related amendments (“new revenue standard”). |
▪ | Financial statement results under the new revenue standard, as compared to the previous revenue standard, for the current reporting period are reflected in the table. |
▪ | The most significant impacts to financial statement results as reported under the new revenue standard, as compared to the previous revenue standard, for the current reporting period are as follows: |
▪ | Under the new revenue standard, certain commissions paid to dealers previously recognized as a reduction to Equipment revenues in our Condensed Consolidated Statements of Comprehensive Income are now recorded as commission costs in Selling, general and administrative expense. |
▪ | Contract costs capitalized for new contracts will accumulate in Other assets in our Condensed Consolidated Balance Sheets during 2018. As a result, there will be a net benefit to Selling, general and administrative expense in our Condensed Consolidated Statements of Comprehensive Income during 2018 as capitalization of costs exceeds amortization. As capitalized costs amortize into expense over time, the accretive benefit to Operating income anticipated in 2018 is expected to moderate in 2019 and normalize in 2020. |
▪ | For contracts with promotional bill credits that are contingent on the customer maintaining a service contract that results in an extended service contract, a contract asset is recorded when control of the equipment transfers to the customer and is subsequently recognized as a reduction to Total service revenues in our Condensed Consolidated Statements of Comprehensive Income over the extended contract term. |
▪ | Wholesale revenues are recognized when it is determined to be probable that minimum guaranteed amounts will not be met (guarantee shortfall). |
12
Hurricane Impacts net of reimbursements | ||||||||||||||||||||
(in millions, except per share and operating metric amounts) | ||||||||||||||||||||
Increase (decrease) | Q3 2017 | Q2 2018 | Q3 2018 | |||||||||||||||||
Net | Net | Gross | Reim- bursement | Net | ||||||||||||||||
Revenues | ||||||||||||||||||||
Branded postpaid revenues | $ | (20 | ) | $ | — | $ | — | $ | — | $ | — | |||||||||
Of which, branded postpaid phone revenues | (19 | ) | — | — | — | — | ||||||||||||||
Branded prepaid revenues | (11 | ) | — | — | — | — | ||||||||||||||
Total service revenues | (31 | ) | — | — | — | — | ||||||||||||||
Equipment revenues | (8 | ) | — | — | — | — | ||||||||||||||
Other revenues | — | — | — | 71 | 71 | |||||||||||||||
Total revenues | $ | (39 | ) | $ | — | $ | — | $ | 71 | $ | 71 | |||||||||
Operating expenses | ||||||||||||||||||||
Cost of services | $ | 69 | $ | (70 | ) | $ | 6 | $ | (60 | ) | $ | (54 | ) | |||||||
Cost of equipment sales | 4 | — | — | — | — | |||||||||||||||
Selling, general and administrative | 36 | — | — | (13 | ) | (13 | ) | |||||||||||||
Of which, bad debt expense | 20 | — | — | — | — | |||||||||||||||
Total operating expenses | $ | 109 | $ | (70 | ) | $ | 6 | $ | (73 | ) | $ | (67 | ) | |||||||
Operating income (loss) | $ | (148 | ) | $ | 70 | $ | (6 | ) | $ | 144 | $ | 138 | ||||||||
Net income (loss) | $ | (90 | ) | $ | 45 | $ | (4 | ) | $ | 92 | $ | 88 | ||||||||
Earnings per share - basic | $ | (0.11 | ) | $ | 0.06 | $ | (0.01 | ) | $ | 0.11 | $ | 0.10 | ||||||||
Earnings per share - diluted | $ | (0.10 | ) | $ | 0.06 | $ | (0.01 | ) | $ | 0.11 | $ | 0.10 | ||||||||
Operating metrics | ||||||||||||||||||||
Bad debt expense and losses from sales of receivables as a percentage of total revenues | 0.20 | % | — | % | — | % | — | % | — | % | ||||||||||
Branded postpaid phone ARPU | $ | (0.19 | ) | $ | — | $ | — | $ | — | $ | — | |||||||||
Branded postpaid ABPU | $ | (0.18 | ) | $ | — | $ | — | $ | — | $ | — | |||||||||
Branded prepaid phone ARPU | $ | (0.18 | ) | $ | — | $ | — | $ | — | $ | — | |||||||||
Non-GAAP financial measures | ||||||||||||||||||||
Adjusted EBITDA | $ | (148 | ) | $ | 70 | $ | (6 | ) | $ | 144 | $ | 138 | ||||||||
HURRICANE IMPACTS
▪ | During Q1 2018, T-Mobile recognized $36 million in incremental costs to maintain services in Puerto Rico related to hurricanes that occurred in 2017. Additional costs incurred during Q2 and Q3 2018 related to hurricanes that occurred in 2017 were immaterial and are expected to be immaterial in Q4 2018. |
▪ | T-Mobile received reimbursement payments from its insurance carriers related to hurricanes that occurred in 2017 of $94 million during Q1 2018, previously accrued for as a receivable as of December 31, 2017, $70 million in Q2 2018, and $81 million in Q3 2018. In addition, the Company accrued an additional receivable of $63 million for reimbursement payments agreed to with its insurance carriers as of September 30, 2018, which was received in October 2018. |
▪ | During Q3 2018, T-Mobile’s operations in North Carolina and South Carolina experienced losses related to a hurricane and the Company recognized $6 million in costs associated with these losses. Additional costs related to the hurricane are expected to be immaterial in the fourth quarter of 2018. |
▪ | In October 2018, our operations in Florida experienced immaterial losses related to a hurricane. Additional costs related to the hurricane are expected to be incurred during the remainder of the fourth quarter of 2018. |
13
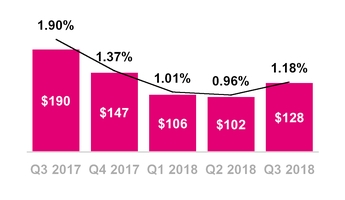
Total Bad Debt Expense and Losses from Sales of Receivables
($ in millions, % of Total Revs)
CUSTOMER QUALITY
▪ | Total bad debt expense and losses from sales of receivables was $128 million in Q3 2018, compared to $102 million in Q2 2018 and $190 million in Q3 2017. |
▪ | As a percentage of total revenues, total bad debt expense and losses from sales of receivables was 1.18% in Q3 2018, compared to 0.96% in Q2 2018 and 1.90% in Q3 2017. |
▪ | Sequentially, total bad debt expense and losses from sales of receivables increased by $26 million. As a percentage of total revenues, bad debt expense and losses from sales of receivables increased by 22 basis points, reflecting typical seasonality trends. |
▪ | Year-over-year, total bad debt expense and losses from sales of receivables decreased by $62 million. As a percentage of total revenues, bad debt expense and losses from sales of receivables decreased by 72 basis points. The decrease reflects our ongoing focus on managing customer quality and losses from hurricanes in Q3 2017. |
▪ | Including the EIP receivables sold, total EIP receivables classified as Prime were 52% of total EIP receivables at the end of Q3 2018, in line with 52% at the end of Q2 2018 and 52% at the end of Q3 2017. |
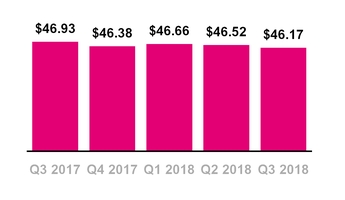
Branded Postpaid Phone ARPU
($ per month)
OPERATING METRICS
Branded Postpaid Phone ARPU
▪ | Branded postpaid phone ARPU was $46.17 in Q3 2018, down 0.8% from $46.52 in Q2 2018 and down 1.6% from $46.93 in Q3 2017. |
▪ | Sequentially, the decrease was primarily due to the continued adoption of tax inclusive plans, including the growing success of new customer segments such as T-Mobile for Business, T-Mobile ONE Unlimited 55+, and T-Mobile ONE Military. |
▪ | Year-over-year, the decrease was primarily due to the continued adoption of tax inclusive plans, including the growing success of new customer segments such as T-Mobile for Business, T-Mobile ONE Unlimited 55+, and T-Mobile ONE Military as well as a reduction in certain non-recurring charges including the noncash net benefit from Data Stash. These decreases were partially offset by a net reduction in service promotional activities. |
14
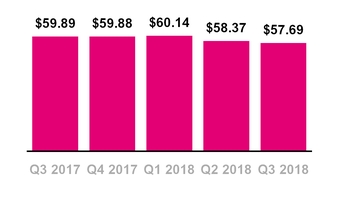
Branded Postpaid ABPU
($ per month)
Branded Postpaid Customers per Account
Branded Prepaid ARPU
($ per month)
▪ | We continue to expect that Branded postpaid phone ARPU in full-year 2018 will be generally stable compared to full-year 2017, excluding the impact from the new revenue standard. |
Branded Postpaid ABPU
▪ | Branded postpaid ABPU was $57.69 in Q3 2018, down 1.2% from $58.37 in Q2 2018 and down 3.7% from $59.89 compared to Q3 2017. |
▪ | The sequential and year-over-year decreases were primarily due to lower branded postpaid phone ARPU, and growth in the branded postpaid other customer base, which has a lower ARPU than branded postpaid phone. |
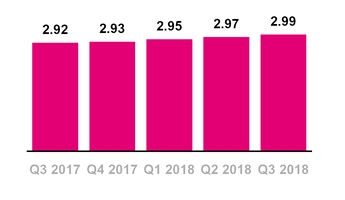
Branded Postpaid Customers per Account
▪ | Branded postpaid customers per account was 2.99 at the end of Q3 2018, compared to 2.97 at the end of Q2 2018 and 2.92 at the end of Q3 2017. |
▪ | The sequential and year-over-year increase was primarily due to promotional activities targeting families and the success of connected devices. |
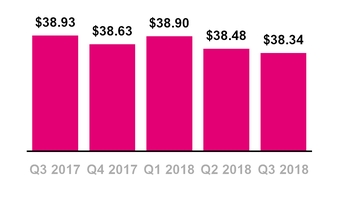
Branded Prepaid ARPU
▪ | Branded prepaid ARPU was $38.34 in Q3 2018, down 0.4% from $38.48 in Q2 2018 and down 1.5% compared to $38.93 in Q3 2017. |
▪ | The sequential and year-over-year decreases were primarily from the dilution from promotional rate plans. |
15
Service Revenues
($ in millions)
REVENUES
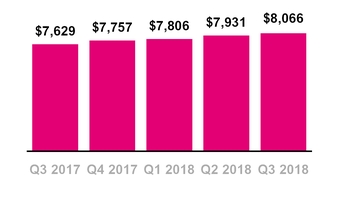
Service Revenues
▪ | T-Mobile led the industry in year-over-year service revenue percentage growth in Q3 2018. This marks the 18th consecutive quarter that T-Mobile has led the industry in this measure. |
▪ | Service revenues were a record-high $8.07 billion in Q3 2018, up 1.7% from $7.93 billion in Q2 2018 and up 5.7% from $7.63 billion in Q3 2017. |
▪ | Sequentially, the increase was primarily due to growth in branded postpaid and wholesale revenues. |
▪ | Branded postpaid revenues increased primarily from growth in our customer base driven by the continued growth in existing and Greenfield markets, the growing success of new customer segments such as T-Mobile for Business, T-Mobile ONE Unlimited 55+, and T-Mobile ONE Military, as well as higher gross customer additions driven by seasonality, partially offset by a lower branded postpaid phone ARPU. |
▪ | Branded prepaid revenues decreased slightly due to lower prepaid ARPU. |
▪ | Wholesale revenues increased primarily from the continued success of our MVNO partnerships and higher minimum commitment revenues. Wholesale revenues for minimum commitments are accelerated under the new revenue standard, with $43 million in shortfalls recognized in Q3 2018. |
▪ | Year-over-year, the increase was primarily due to growth in branded postpaid, branded prepaid and wholesale revenues. |
▪ | Branded postpaid revenues increased primarily from higher average branded postpaid phone customers, primarily from growth in our customer base driven by the continued growth in existing and Greenfield markets, the growing success of new customer segments such as T-Mobile for Business, T-Mobile ONE Unlimited 55+, and T-Mobile ONE Military, along with lower churn, and higher average branded postpaid other customers, driven by higher connected devices, partially offset by lower branded postpaid phone ARPU. |
16
Equipment Revenues
($ in millions)
▪ | Wholesale revenues increased primarily from the continued success of our MVNO partnerships and higher minimum commitment revenues. Wholesale revenues for minimum commitments are accelerated under the new revenue standard, with $43 million in shortfalls recognized in Q3 2018. |
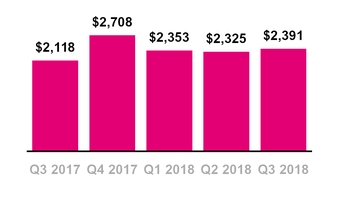
Equipment Revenues
▪ | Equipment revenues were $2.39 billion in Q3 2018, up 2.8% from $2.33 billion in Q2 2018 and up 12.9% from $2.12 billion in Q3 2017. Equipment revenues in Q3 2018 were comprised of lease revenues of $176 million and non-lease revenues of $2.22 billion. |
▪ | Sequentially, the increase was primarily due to: |
▪ | An increase in device sales revenues, excluding purchased lease devices, primarily from: |
◦ | A 7% increase in the number of devices sold excluding purchased lease devices, and |
◦ | A positive impact from the new revenue standard of $105 million in Q3 2018, primarily related to certain commission costs now recorded as Selling, general and administrative expenses compared to a positive impact of $96 million in Q2 2018, partially offset by |
◦ | A slightly lower average revenue per device sold driven by an increase in device commissions including dealer rebates for unsold inventory in Q3 2018, and an increase in promotions; and |
▪ | Increases in device liquidations and accessory revenues, partially offset by |
▪ | Lower volumes of purchased leased devices at the end of the lease term. |
▪ | Year-over-year, the increase was primarily due to: |
▪ | A $394 million increase in device sales revenues, excluding purchased lease devices, primarily from: |
◦ | Higher average revenue per device sold due to an increase in the high-end device mix, and |
◦ | A positive impact from the new revenue standard of $105 million primarily related to certain commission costs now recorded as Selling, general and administrative expenses, partially offset by |
17
Total Revenues
($ in millions)
◦ | A 4% decrease in the number of devices sold, excluding purchased lease devices. |
▪ | This increase was partially offset by: |
◦ | A decrease of $117 million from lower volumes of purchased leased devices at the end of the lease term, and |
◦ | A decrease of $32 million primarily related to lower proceeds from liquidation of returned customer handsets. |
Total Revenues
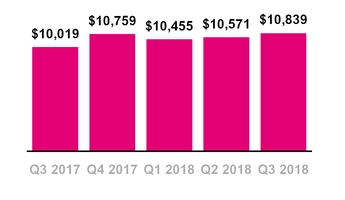
▪ | Total revenues were a record-high $10.84 billion in Q3 2018, up 2.5% from $10.57 billion in Q2 2018 and up 8.2% from $10.02 billion in Q3 2017. |
Cost of Services
($ in millions, % of Service Revs)
OPERATING EXPENSES
Cost of Services
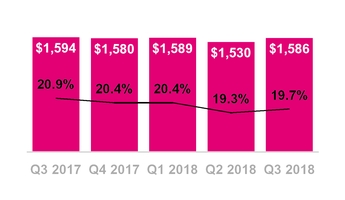
▪ | Cost of services was $1.59 billion in Q3 2018, up 3.7% from $1.53 billion in Q2 2018 and down 0.5% from $1.59 billion in Q3 2017. |
▪ | Sequentially, the increase was primarily due to the impact of the accelerated rollout of low band spectrum. The positive impact of the hurricane-related insurance reimbursement amounted to $54 million in Q3 2018, compared to $70 million in Q2 2018. Cost of services as a percentage of service revenues increased by 40 basis points sequentially. |
▪ | Excluding the impact from hurricanes, cost of services as a percentage of service revenues would have increased by 10 basis points. |
▪ | Year-over-year, the decrease was primarily due to the positive impact of the hurricane-related insurance reimbursement of $54 million in Q3 2018, compared to costs incurred related to hurricanes of $69 million in Q3 2017. These were partially offset by the impact of the accelerated rollout of low band spectrum and the impact from the new revenue standard of $24 million which primarily related to certain costs for customer appreciation programs reclassified to Cost of services from Selling, general and administrative expenses. As a percentage of |
18
Cost of Equipment Sales
($ in millions, % of Equipment Revs)
service revenues, cost of services decreased 120 basis points year-over-year.
▪ | Excluding the impact from hurricanes, cost of services as a percentage of service revenues would have increased by 40 basis points. |
Cost of Equipment Sales
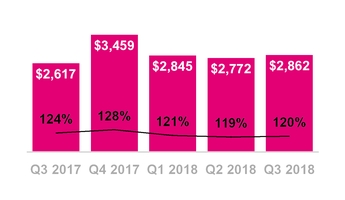
▪ | Cost of equipment sales was $2.86 billion in Q3 2018, up 3.2% from $2.77 billion in Q2 2018 and up 9.4% from $2.62 billion in Q3 2017. |
▪ | Sequentially, the increase was primarily due to: |
▪ | A $96 million increase in device cost of equipment sales, excluding purchased lease devices, primarily from: |
◦ | A 7% increase in the number of devices sold excluding purchased lease devices, partially offset by |
◦ | A slightly lower average cost per device sold driven by a shift in the high-end device mix. |
▪ | This increase was partially offset by lower inventory adjustments and lower volumes of purchased leased devices at the end of the lease term. |
▪ | Year-over-year, the increase was primarily due to: |
▪ | An increase of $386 million in device cost of equipment sales, excluding purchased leased devices, primarily due to: |
◦ | A higher average cost per device sold, primarily due to an increase in the high-end device mix, partially offset by |
◦ | A 4% decrease in the number of devices sold. |
▪ | This increase was partially offset by lower inventory adjustments and lower volumes of purchased lease devices at the end of the lease term. |
19
SG&A Expense
($ in millions, % of Service Revs)
D&A Expense
($ in millions, % of Total Revs)
Selling, General and Admin. (SG&A) Expense
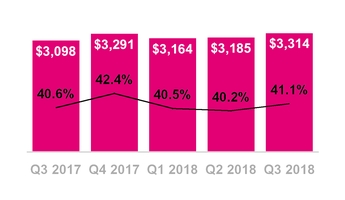
▪ | SG&A expense was $3.31 billion in Q3 2018, up 4.1% from $3.19 billion in Q2 2018 and up 7.0% from $3.10 billion in Q3 2017. |
▪ | Sequentially, the increase was primarily due to higher promotional and advertising costs, higher commissions driven by compensation structure and channel mix changes, increased bad debt expense and losses on sales of receivables, and costs associated with the Transactions of $53 million in Q3 2018 compared to $41 million in Q2 2018. As a percentage of service revenues, SG&A expense increased 90 basis points sequentially. |
▪ | Excluding the impact from the Transactions, SG&A expense as a percentage of service revenues would have increased by 80 basis points. |
▪ | Year-over-year, the increase was primarily due to higher employee-related costs and costs related to managed services, higher commissions driven by compensation structure and channel mix changes, and costs associated with the Transactions of $53 million in Q3 2018. These increases were partially offset by lower bad debt expense, lower promotional and advertising costs and the positive impact from insurance reimbursements related to the hurricanes of $13 million compared to costs incurred related to hurricanes of $36 million in Q3 2017. As a percentage of service revenues, SG&A expense increased 50 basis points year-over-year. |
▪ | Excluding the impact from the Transactions, SG&A expense as a percentage of service revenues would have decreased by 20 basis points. |
Depreciation and Amortization (D&A)
▪ | D&A was $1.64 billion in Q3 2018, up 0.2% from $1.63 billion in Q2 2018 and up 15.6% from $1.42 billion in Q3 2017. |
▪ | D&A related to leased devices was $245 million in Q3 2018, compared to $238 million in Q2 2018 and $189 million in Q3 2017. |
▪ | Non-lease related D&A was $1.39 billion in Q3 2018, compared to $1.40 billion in Q2 2018 and $1.23 billion in Q3 2017. |
20
▪ | The year-over-year increase was primarily due to the continued build-out of our 4G LTE network, the implementation of the first component of our new billing system, and higher depreciation expense related to our JUMP! On Demand program. |
Net Income
($ in millions)
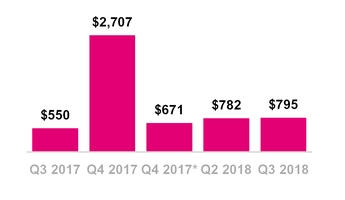
*Q4 2017 Net income includes the impact from the Tax Cuts Jobs Act (“TCJA”) of $2.18 billion.
Diluted Earnings Per Share
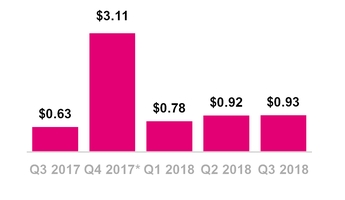
*Q4 2017 EPS includes the impact from the Tax Cuts Jobs Act (“TCJA”) of $(2.50).
NET INCOME AND
DILUTED EARNINGS PER SHARE (“EPS”)
▪ | Net income was $795 million in Q3 2018, up 2% from $782 million in Q2 2018 and up 45% from $550 million in Q3 2017. EPS was $0.93 in Q3 2018, up from $0.92 in Q2 2018 and up from $0.63 in Q3 2017. |
▪ | Sequentially, the increases in net income and EPS were primarily due to a reduction in Other expense, net due to losses on note redemptions in Q2 2018, partially offset by an increase in Income tax expense. Net income and EPS included the following: |
▪ | The positive impact from the new revenue standard on net income and EPS in Q3 2018 of $101 million and $0.12, respectively, compared to $62 million and $0.07 in Q2 2018, respectively. |
▪ | The positive impact from hurricanes, net of insurance recoveries on net income and EPS for Q3 2018 of $88 million and $0.10, respectively, compared to a positive impact of $45 million and $0.06, respectively, for Q2 2018. |
▪ | The negative impact from the Transactions on net income and EPS for Q3 2018 of $53 million and $0.06, respectively, compared to a negative impact of $39 million and $0.05 in Q2 2018, respectively. |
▪ | Year-over-year, the increases in net income and EPS primarily related to increased operating income and interest expense savings. Net income and EPS included the following: |
▪ | The positive impact from the new revenue standard on net income and EPS in Q3 2018 was $101 million and $0.12, respectively. |
▪ | The positive impact from hurricanes, net of insurance recoveries on net income and EPS for Q3 2018 of $88 million and $0.10, respectively compared to a negative impact |
21
▪ | of $90 million and $0.10, respectively for Q3 2017. |
▪ | The negative impact from the Transactions on net income and EPS for Q3 2018 of $53 million and $0.06, respectively. |
▪ | The tax-effected impact from spectrum gains on Net income and EPS was $18 million and $0.02, respectively in Q3 2017. There were no spectrum gains in Q3 2018. |
▪ | Net income margin was 10% in Q3 2018, compared to 10% in Q2 2018 and 7% in Q3 2017. Net income margin is calculated as net income divided by service revenues. |
Adjusted EBITDA
($ in millions)
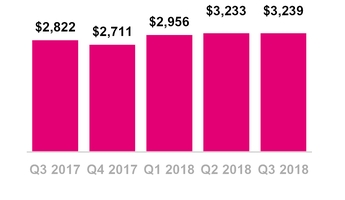
ADJUSTED EBITDA
▪ | Adjusted EBITDA was $3.2 billion in Q3 2018, up 0.2% from $3.2 billion in Q2 2018 and up 14.8% from $2.8 billion in Q3 2017. |
▪ | Sequentially, the increase in Adjusted EBITDA was primarily due to higher total revenues, offset partially by higher costs, especially SG&A expenses. The positive impact from insurance reimbursements related to hurricanes, net of costs, was $138 million in Q3 2018, compared to $70 million in Q2 2018, and the positive impact from the new revenue standard was $136 million in Q3 2018 compared to $84 million in Q2 2018. |
▪ | Year-over-year, the increase in Adjusted EBITDA was primarily due to higher total revenues, the positive impact from insurance reimbursements related to hurricanes, net of costs, of $138 million in Q3 2018, compared to costs incurred related to hurricanes of $148 million in Q3 2017, the positive impact from the new revenue standard of $136 million and lower losses on equipment, partially offset by higher SG&A expenses and no gains on disposal of spectrum licenses in Q3 2018 compared to $29 million Q3 2017. |
▪ | Adjusted EBITDA margin was 40% in Q3 2018, compared to 41% in Q2 2018 and 37% in Q3 2017. Adjusted EBITDA margin is calculated as Adjusted EBITDA divided by service revenues. |
22
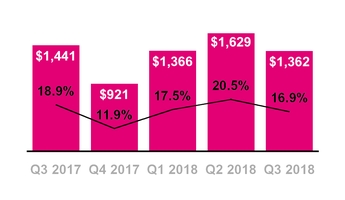
Cash Purchases of Property and Equipment
($ in millions, % of Service Revs)
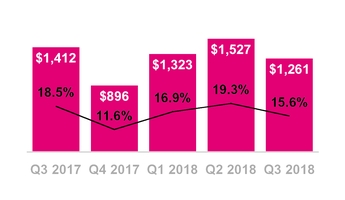
Cash Purchases of Property and Equipment, Excluding Capitalized Interest
($ in millions, % of Service Revs)
CAPITAL EXPENDITURES
▪ | Cash purchases of property and equipment were $1.36 billion in Q3 2018, compared to $1.63 billion in Q2 2018 and $1.44 billion in Q3 2017. |
▪ | Sequentially and year-over-year, the decreases were primarily due to fluctuations in the timing of the build-out of our network, including the build-out of the 600 MHz low-band spectrum. |
▪ | Cash purchases of property and equipment, excluding capitalized interest, were $1.26 billion in Q3 2018, compared to $1.53 billion in Q2 2018 and $1.41 billion in Q3 2017. |
▪ | Capitalized interest included in cash purchases of property and equipment was $101 million in Q3 2018, compared to $102 million in Q2 2018 and $29 million in Q3 2017. |
23
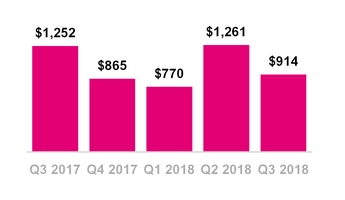
Net Cash Provided by Operating Activities(1)
($ in millions)
(1) | In Q1 2018, the adoption of the new cash flow accounting standard resulted in a reclassification of cash flows related to the deferred purchase price from securitization transactions from operating activities to investing activities. In addition, cash flows related to debt prepayment and extinguishment costs were reclassified from operating activities to financing activities. The effects of this change are applied retrospectively and are provided in the Reconciliation of Non-GAAP Financial Measures to GAAP Financial Measures tables. |
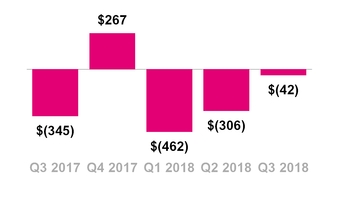
Net Cash Provided by (Used in) Investing Activities(1)
($ in millions)
(1) | In Q1 2018, the adoption of the new cash flow accounting standard resulted in a reclassification of cash flows related to the deferred purchase price from securitization transactions from operating activities to investing activities. In addition, cash flows related to debt prepayment and extinguishment costs were reclassified from operating activities to financing activities. The effects of this change are applied retrospectively and are provided in the Reconciliation of Non-GAAP Financial Measures to GAAP Financial Measures tables. |
CASH FLOW
Operating Activities
▪ | Net cash provided by operating activities was $914 million in Q3 2018, compared to $1.26 billion in Q2 2018 and $1.25 billion in Q3 2017. |
▪ | Sequentially, the decrease was primarily due to higher net cash outflows from working capital changes. |
◦ | The change in working capital was primarily due to a build up of Inventories with the launch of the new iPhone generation, a paydown of Accounts payable and accrued liabilities, and an increase in Accounts receivable, partially offset by Other current and long-term liabilities. |
▪ | Year-over-year, the decrease was primarily due to an increase in net cash outflows from changes in working capital, partially offset by higher Net income and an increase in net non-cash adjustments to Net income. |
◦ | The change in working capital was primarily due to a paydown of Accounts payable and accrued liabilities and a build up of Inventories with the launch of the new iPhone generation and increased Accounts receivable. |
◦ | The change in net non-cash adjustments to Net income was primarily due to higher Depreciation and amortization, partially offset by lower Deferred income tax expense. |
Investing Activities
▪ | Net cash used in investing activities was $42 million in Q3 2018, compared to $306 million in Q2 2018 and $345 million in Q3 2017. |
▪ | Sequentially, the change was primarily due to lower purchases of property and equipment, including capitalized interest. |
▪ | Year-over-year, the change was primarily due to higher proceeds related to our deferred purchase price from securitization transactions and lower purchases of property and equipment, including capitalized interest. |
24
Net Cash Provided by (Used in)
Financing Activities (1)
($ in millions)
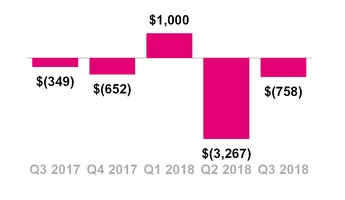
(1) | In Q1 2018, the adoption of the new cash flow accounting standard resulted in a reclassification of cash flows related to the deferred purchase price from securitization transactions from operating activities to investing activities. In addition, cash flows related to debt prepayment and extinguishment costs were reclassified from operating activities to financing activities. The effects of this change are applied retrospectively and are provided in the Reconciliation of Non-GAAP Financial Measures to GAAP Financial Measures tables. |
Free Cash Flow (1)
($ in millions)
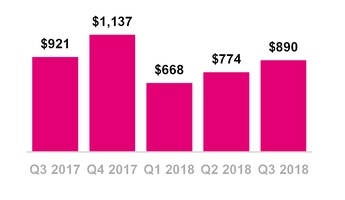
(1) | In Q1 2018, the adoption of the new cash flow accounting standard resulted in a reclassification of cash flows related to the deferred purchase price from securitization transactions from operating activities to investing activities. In addition, cash flows related to debt prepayment and extinguishment costs were reclassified from operating activities to financing activities. In Q1 2018, we redefined Free Cash Flow to reflect the above changes in classification and present cash flows on a consistent basis for investor transparency. The effects of this change are applied retrospectively. |
Financing Activities
▪ | Net cash used in financing activities was $758 million in Q3 2018, compared to an outflow of $3.27 billion in Q2 2018 and $349 million in Q3 2017. |
▪ | Sequentially, the change was primarily due to repayments of long-term debt in Q2 2018 and lower repurchases of common stock, partially offset by lower proceeds from borrowing on revolving credit facility and higher repayments of short-term debt for purchases of inventory, property and equipment, net. |
▪ | Year-over-year, the change was primarily due to proceeds from issuance of long-term debt in Q3 2017, higher repayments of revolving credit facility and higher repayments of short-term debt for purchases of inventory, property and equipment, net, partially offset by higher proceeds from borrowing on revolving credit facility. |
FREE CASH FLOW
▪ | Free Cash Flow was $890 million in Q3 2018, compared to $774 million in Q2 2018 and $921 million in Q3 2017. |
▪ | Sequentially, the increase was due to lower cash purchases of property and equipment and lower cash payments for debt prepayment and debt extinguishment costs, partially offset by lower net cash provided by operating activities, as described above. |
▪ | Year-over-year, the decrease was due to lower net cash provided by operating activities, as described above, partially offset by higher proceeds related to our deferred purchase price from securitization transactions and lower cash purchases of property and equipment. |
▪ | Net cash used for securitization was $18 million in Q3 2018 compared to net cash proceeds from securitization of $25 million in Q2 2018 and net cash proceeds from securitization of $11 million in Q3 2017. |
25
Total Debt and Net Debt (excl. Tower Obligations)
Net Debt to LTM Net Income
Net Debt to LTM Adjusted EBITDA
($ in billions)
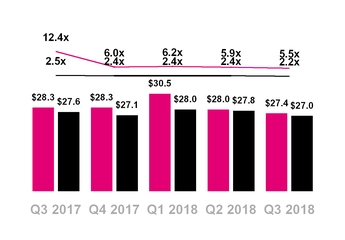
— Net Debt (excl. Tower Obligations) to LTM Net income
— Net Debt (excl. Tower Obligations) to LTM Adj. EBITDA
CAPITAL STRUCTURE
▪ | Total debt, excluding tower obligations, at the end of Q3 2018 was $27.4 billion and was comprised of the following: |
▪ | $0.8 billion of short-term debt, |
▪ | $12.0 billion of long-term debt, and |
▪ | $14.6 billion of long-term debt to affiliates. |
▪ | Net debt, excluding tower obligations, at the end of Q3 2018 was $27.0 billion. |
▪ | The ratio of net debt, excluding tower obligations, to net income for the trailing last twelve months (“LTM”) period was 5.5x at the end of Q3 2018, compared to 5.9x at the end of Q2 2018 and 12.4x at the end of Q3 2017. The ratio of net debt, excluding tower obligations, to net income for the LTM at the end of Q3 2018 and Q2 2018 was primarily impacted by the Q4 2017 income tax benefit. |
▪ | The ratio of net debt, excluding tower obligations, to Adjusted EBITDA for the trailing LTM period was 2.2x at the end of Q3 2018, compared to 2.4x at the end of Q2 2018 and 2.5x at the end of Q3 2017. |
2018 Guidance Outlook | |||||||||||||||
Original | Q1 2018 Update | Q2 2018 Update | Q3 2018 Update | ||||||||||||
Branded Postpaid Net Adds (in millions) | 2.0 | - | 3.0 | 2.6 | - | 3.3 | 3.0 | - | 3.6 | 3.8 | - | 4.1 | |||
Adjusted EBITDA ($ in billions) | $11.3 | - | $11.7 | $11.4 | - | $11.8 | $11.5 | - | $11.9 | $11.8 | - | $12.0 | |||
Cash purchases of prop and equip excl Cap Int ($ in billions) | $4.9 | - | $5.3 | Unchanged | Unchanged | Unchanged | |||||||||
Net cash provided by op act 3-yr CAGR | 16% | - | 18% | 7% | - | 12% | Unchanged | Unchanged | |||||||
Free Cash Flow three-year CAGR | 46% | - | 48% | Unchanged | Unchanged | Unchanged | |||||||||
GUIDANCE
▪ | Branded postpaid net customer additions for the full-year 2018 of 3.8 to 4.1 million, increased and narrowed from the prior target range of 3.0 to 3.6 million. |
▪ | We are not able to forecast net income on a forward-looking basis without unreasonable efforts due to the high variability and difficulty in predicting certain items that affect GAAP net income including, but not limited to, income tax expense, stock based compensation expense and interest expense. Adjusted EBITDA should not be used to predict net income as the difference between the two measures is variable. |
▪ | For the full-year 2018, Adjusted EBITDA is now expected to be in the range of $11.8 to $12.0 billion, an increase from and narrowing of the prior target range of $11.5 to $11.9 billion. This target excludes future spectrum gains, and includes expected leasing revenues of $0.6 - $0.7 billion, which are now expected to be at the high end of the guidance range. Including the estimated impact of the new revenue standard, Adjusted EBITDA is expected to increase by an additional $0.2 - $0.5 billion for a total guidance range of $12.0 - $12.5 billion. |
26
▪ | Cash purchases of property and equipment for the full-year 2018, excluding capitalized interest, are expected to be in the range of $4.9 to $5.3 billion, unchanged from the prior target range, and still expected to come in at the high end of the range. This includes expenditures for 5G deployment. |
▪ | Net cash provided by operating activities three-year CAGR from full-year 2016 to full-year 2019 is expected to be between 7% and 12%, unchanged from the prior guidance range. |
▪ | Free Cash Flow three-year CAGR from full-year 2016 to full-year 2019 is expected to be between 46% and 48%, unchanged from the prior target range. In Q1 2018, we redefined Free Cash Flow upon the adoption of the new cash flow accounting standard. Free cash flow guidance does not assume any material net cash inflows from securitization going forward. |
▪ | We continue to expect that Branded postpaid phone ARPU in full-year 2018 will be generally stable compared to full-year 2017, excluding the impact from the new revenue standard. |
▪ | In Q1 2018, the adoption of the new cash flow accounting standard resulted in a reclassification of cash flows related to the deferred purchase price from securitization transactions from operating activities to investing activities. In addition, cash flows related to debt prepayment and extinguishment costs were reclassified from operating activities to financing activities. In Q1 2018, we redefined Free Cash Flow to reflect the above changes in classification and present cash flows on a consistent basis for investor transparency. The effects of this change are applied retrospectively and are provided in the Reconciliation of Non-GAAP Financial Measures to GAAP Financial Measures tables. |
▪ | Please see our Quarterly Report on Form 10-Q for the quarterly period ended September 30, 2018 for additional information on the adoption of the new revenue standard and the new cash flow accounting standard. |
UPCOMING EVENTS (All dates and attendance tentative)
▪ | Morgan Stanley European Technology, Media & Telecom Conference, November 14-16, 2018, Barcelona, Spain |
▪ | Bank of America Merrill Lynch 2018 Leveraged Finance Conference, December 3-5, 2018, Boca Raton, Florida |
▪ | Citi 2019 Global TMT West Conference, January 8-9, 2019, Las Vegas, Nevada |
27
CONTACT INFORMATION
Press:
Media Relations
T-Mobile US, Inc.
mediarelations@t-mobile.com
http://newsroom.t-mobile.com
Investor Relations:
Nils Paellmann, nils.paellmann@t-mobile.com
Ben Barrett, ben.barrett@t-mobile.com
Jon Perachio, jonathan.perachio@t-mobile.com
Esther Tehrani, esther.tehrani@t-mobile.com
212-358-3210
investor.relations@t-mobile.com
http://investor.t-mobile.com
28
T-Mobile US, Inc.
Condensed Consolidated Balance Sheets
(Unaudited)
(in millions, except share and per share amounts) | September 30, 2018 | December 31, 2017 | |||||
Assets | |||||||
Current assets | |||||||
Cash and cash equivalents | $ | 329 | $ | 1,219 | |||
Accounts receivable, net of allowances of $70 and $86 | 1,652 | 1,915 | |||||
Equipment installment plan receivables, net | 2,366 | 2,290 | |||||
Accounts receivable from affiliates | 12 | 22 | |||||
Inventories | 958 | 1,566 | |||||
Other current assets | 1,969 | 1,903 | |||||
Total current assets | 7,286 | 8,915 | |||||
Property and equipment, net | 22,502 | 22,196 | |||||
Goodwill | 1,901 | 1,683 | |||||
Spectrum licenses | 35,553 | 35,366 | |||||
Other intangible assets, net | 229 | 217 | |||||
Equipment installment plan receivables due after one year, net | 1,223 | 1,274 | |||||
Other assets | 1,488 | 912 | |||||
Total assets | $ | 70,182 | $ | 70,563 | |||
Liabilities and Stockholders' Equity | |||||||
Current liabilities | |||||||
Accounts payable and accrued liabilities | $ | 6,500 | $ | 8,528 | |||
Payables to affiliates | 226 | 182 | |||||
Short-term debt | 783 | 1,612 | |||||
Deferred revenue | 696 | 779 | |||||
Other current liabilities | 367 | 414 | |||||
Total current liabilities | 8,572 | 11,515 | |||||
Long-term debt | 11,993 | 12,121 | |||||
Long-term debt to affiliates | 14,581 | 14,586 | |||||
Tower obligations | 2,565 | 2,590 | |||||
Deferred tax liabilities | 4,370 | 3,537 | |||||
Deferred rent expense | 2,761 | 2,720 | |||||
Other long-term liabilities | 985 | 935 | |||||
Total long-term liabilities | 37,255 | 36,489 | |||||
Commitments and contingencies | |||||||
Stockholders' equity | |||||||
Common Stock, par value $0.00001 per share, 1,000,000,000 shares authorized; 849,890,566 and 860,861,998 shares issued, 848,380,679 and 859,406,651 shares outstanding | — | — | |||||
Additional paid-in capital | 37,956 | 38,629 | |||||
Treasury stock, at cost, 1,509,887 and 1,455,347 shares issued | (7 | ) | (4 | ) | |||
Accumulated other comprehensive income | — | 8 | |||||
Accumulated deficit | (13,594 | ) | (16,074 | ) | |||
Total stockholders' equity | 24,355 | 22,559 | |||||
Total liabilities and stockholders' equity | $ | 70,182 | $ | 70,563 | |||
29
T-Mobile US, Inc.
Condensed Consolidated Statements of Comprehensive Income
(Unaudited)
Three Months Ended | Nine Months Ended September 30, | ||||||||||||||||||
(in millions, except share and per share amounts) | September 30, 2018 | June 30, 2018 | September 30, 2017 | 2018 | 2017 | ||||||||||||||
Revenues | |||||||||||||||||||
Branded postpaid revenues | $ | 5,244 | $ | 5,164 | $ | 4,920 | $ | 15,478 | $ | 14,465 | |||||||||
Branded prepaid revenues | 2,395 | 2,402 | 2,376 | 7,199 | 7,009 | ||||||||||||||
Wholesale revenues | 338 | 275 | 274 | 879 | 778 | ||||||||||||||
Roaming and other service revenues | 89 | 90 | 59 | 247 | 151 | ||||||||||||||
Total service revenues | 8,066 | 7,931 | 7,629 | 23,803 | 22,403 | ||||||||||||||
Equipment revenues | 2,391 | 2,325 | 2,118 | 7,069 | 6,667 | ||||||||||||||
Other revenues | 382 | 315 | 272 | 993 | 775 | ||||||||||||||
Total revenues | 10,839 | 10,571 | 10,019 | 31,865 | 29,845 | ||||||||||||||
Operating expenses | |||||||||||||||||||
Cost of services, exclusive of depreciation and amortization shown separately below | 1,586 | 1,530 | 1,594 | 4,705 | 4,520 | ||||||||||||||
Cost of equipment sales | 2,862 | 2,772 | 2,617 | 8,479 | 8,149 | ||||||||||||||
Selling, general and administrative | 3,314 | 3,185 | 3,098 | 9,663 | 8,968 | ||||||||||||||
Depreciation and amortization | 1,637 | 1,634 | 1,416 | 4,846 | 4,499 | ||||||||||||||
Gains on disposal of spectrum licenses | — | — | (29 | ) | — | (67 | ) | ||||||||||||
Total operating expense | 9,399 | 9,121 | 8,696 | 27,693 | 26,069 | ||||||||||||||
Operating income | 1,440 | 1,450 | 1,323 | 4,172 | 3,776 | ||||||||||||||
Other income (expense) | |||||||||||||||||||
Interest expense | (194 | ) | (196 | ) | (253 | ) | (641 | ) | (857 | ) | |||||||||
Interest expense to affiliates | (124 | ) | (128 | ) | (167 | ) | (418 | ) | (398 | ) | |||||||||
Interest income | 5 | 6 | 2 | 17 | 15 | ||||||||||||||
Other income (expense), net | 3 | (64 | ) | 1 | (51 | ) | (89 | ) | |||||||||||
Total other expense, net | (310 | ) | (382 | ) | (417 | ) | (1,093 | ) | (1,329 | ) | |||||||||
Income before income taxes | 1,130 | 1,068 | 906 | 3,079 | 2,447 | ||||||||||||||
Income tax expense | (335 | ) | (286 | ) | (356 | ) | (831 | ) | (618 | ) | |||||||||
Net income | 795 | 782 | 550 | 2,248 | 1,829 | ||||||||||||||
Dividends on preferred stock | — | — | (13 | ) | — | (41 | ) | ||||||||||||
Net income attributable to common stockholders | $ | 795 | $ | 782 | $ | 537 | $ | 2,248 | $ | 1,788 | |||||||||
Net income | $ | 795 | $ | 782 | $ | 550 | $ | 2,248 | $ | 1,829 | |||||||||
Other comprehensive income, net of tax | |||||||||||||||||||
Unrealized gain (loss) on available-for-sale securities, net of tax effect of $0, $1, $0, $0 and $2 | — | 3 | 1 | — | 3 | ||||||||||||||
Other comprehensive income | — | 3 | 1 | — | 3 | ||||||||||||||
Total comprehensive income | $ | 795 | $ | 785 | $ | 551 | $ | 2,248 | $ | 1,832 | |||||||||
Earnings per share | |||||||||||||||||||
Basic | $ | 0.94 | $ | 0.92 | $ | 0.65 | $ | 2.65 | $ | 2.15 | |||||||||
Diluted | $ | 0.93 | $ | 0.92 | $ | 0.63 | $ | 2.62 | $ | 2.10 | |||||||||
Weighted average shares outstanding | |||||||||||||||||||
Basic | 847,087,120 | 847,660,488 | 831,189,779 | 849,960,290 | 829,974,146 | ||||||||||||||
Diluted | 853,852,764 | 852,040,670 | 871,420,065 | 858,248,568 | 871,735,511 | ||||||||||||||
30
T-Mobile US, Inc.
Condensed Consolidated Statements of Cash Flows (1)
(Unaudited)
Three Months Ended | Nine Months Ended September 30, | ||||||||||||||||||
(in millions) | September 30, 2018 | June 30, 2018 | September 30, 2017 | 2018 | 2017 | ||||||||||||||
Operating activities | |||||||||||||||||||
Net income | $ | 795 | $ | 782 | $ | 550 | $ | 2,248 | $ | 1,829 | |||||||||
Adjustments to reconcile net income to net cash provided by operating activities | |||||||||||||||||||
Depreciation and amortization | 1,637 | 1,634 | 1,416 | 4,846 | 4,499 | ||||||||||||||
Stock-based compensation expense | 115 | 112 | 82 | 324 | 221 | ||||||||||||||
Deferred income tax expense | 284 | 272 | 347 | 762 | 595 | ||||||||||||||
Bad debt expense | 80 | 75 | 123 | 209 | 298 | ||||||||||||||
Losses from sales of receivables | 48 | 27 | 67 | 127 | 242 | ||||||||||||||
Deferred rent expense | 10 | 7 | 21 | 21 | 61 | ||||||||||||||
Losses on redemption of debt | — | 90 | — | 122 | 86 | ||||||||||||||
Gains on disposal of spectrum licenses | — | — | (29 | ) | — | (67 | ) | ||||||||||||
Changes in operating assets and liabilities | |||||||||||||||||||
Accounts receivable | (1,238 | ) | (1,136 | ) | (1,022 | ) | (3,247 | ) | (2,676 | ) | |||||||||
Equipment installment plan receivables | (335 | ) | (286 | ) | (355 | ) | (843 | ) | (1,148 | ) | |||||||||
Inventories | (115 | ) | 125 | 113 | 43 | (28 | ) | ||||||||||||
Other current and long-term assets | (193 | ) | (248 | ) | (184 | ) | (309 | ) | (330 | ) | |||||||||
Accounts payable and accrued liabilities | (265 | ) | (79 | ) | (12 | ) | (1,372 | ) | (607 | ) | |||||||||
Other current and long-term liabilities | 39 | (105 | ) | 60 | (21 | ) | (84 | ) | |||||||||||
Other, net | 52 | (9 | ) | 75 | 35 | 75 | |||||||||||||
Net cash provided by operating activities | 914 | 1,261 | 1,252 | 2,945 | 2,966 | ||||||||||||||
Investing activities | |||||||||||||||||||
Purchases of property and equipment, including capitalized interest of $101, $102, $29, $246 and $111 | (1,362 | ) | (1,629 | ) | (1,441 | ) | (4,357 | ) | (4,316 | ) | |||||||||
Purchases of spectrum licenses and other intangible assets | (22 | ) | (28 | ) | (15 | ) | (101 | ) | (5,820 | ) | |||||||||
Proceeds related to beneficial interests in securitization transactions | 1,338 | 1,323 | 1,110 | 3,956 | 3,126 | ||||||||||||||
Acquisition of companies, net of cash acquired | — | (5 | ) | — | (338 | ) | — | ||||||||||||
Other, net | 4 | 33 | 1 | 30 | (2 | ) | |||||||||||||
Net cash used in investing activities | (42 | ) | (306 | ) | (345 | ) | (810 | ) | (7,012 | ) | |||||||||
Financing activities | |||||||||||||||||||
Proceeds from issuance of long-term debt | — | — | 500 | 2,494 | 10,480 | ||||||||||||||
Payments of consent fees related to long-term debt | — | (38 | ) | — | (38 | ) | — | ||||||||||||
Proceeds from borrowing on revolving credit facility | 1,810 | 2,070 | 1,055 | 6,050 | 2,910 | ||||||||||||||
Repayments of revolving credit facility | (2,130 | ) | (2,195 | ) | (1,735 | ) | (6,050 | ) | (2,910 | ) | |||||||||
Repayments of capital lease obligations | (181 | ) | (155 | ) | (141 | ) | (508 | ) | (350 | ) | |||||||||
Repayments of short-term debt for purchases of inventory, property and equipment, net | (246 | ) | — | (4 | ) | (246 | ) | (296 | ) | ||||||||||
Repayments of long-term debt | — | (2,350 | ) | — | (3,349 | ) | (10,230 | ) | |||||||||||
Repurchases of common stock | — | (405 | ) | — | (1,071 | ) | — | ||||||||||||
Tax withholdings on share-based awards | (5 | ) | (10 | ) | (6 | ) | (89 | ) | (101 | ) | |||||||||
Dividends on preferred stock | — | — | (13 | ) | — | (41 | ) | ||||||||||||
Cash payments for debt prepayment or debt extinguishment costs | — | (181 | ) | — | (212 | ) | (188 | ) | |||||||||||
Other, net | (6 | ) | (3 | ) | (5 | ) | (6 | ) | 11 | ||||||||||
Net cash (used in) provided by financing activities | (758 | ) | (3,267 | ) | (349 | ) | (3,025 | ) | (715 | ) | |||||||||
Change in cash and cash equivalents | 114 | (2,312 | ) | 558 | (890 | ) | (4,761 | ) | |||||||||||
Cash and cash equivalents | |||||||||||||||||||
Beginning of period | 215 | 2,527 | 181 | 1,219 | 5,500 | ||||||||||||||
End of period | $ | 329 | $ | 215 | $ | 739 | $ | 329 | $ | 739 | |||||||||
Supplemental disclosure of cash flow information | |||||||||||||||||||
Interest payments, net of amounts capitalized | $ | 366 | $ | 559 | $ | 343 | $ | 1,303 | $ | 1,565 | |||||||||
Income tax payments | 29 | 10 | 2 | 40 | 23 | ||||||||||||||
Noncash beneficial interest obtained in exchange for securitized receivables | 1,263 | 1,205 | 972 | 3,596 | 2,980 | ||||||||||||||
Noncash investing and financing activities | |||||||||||||||||||
Changes in accounts payable for purchases of property and equipment | $ | 78 | $ | (386 | ) | $ | (141 | ) | $ | (672 | ) | $ | (458 | ) | |||||
Leased devices transferred from inventory to property and equipment | 229 | 280 | 262 | 813 | 775 | ||||||||||||||
Returned leased devices transferred from property and equipment to inventory | (74 | ) | (90 | ) | (165 | ) | (246 | ) | (635 | ) | |||||||||
Issuance of short-term debt for financing of property and equipment | — | 54 | 1 | 291 | 291 | ||||||||||||||
Assets acquired under capital lease obligations | 133 | 176 | 138 | 451 | 735 | ||||||||||||||
(1) | In Q1 2018, the adoption of the new cash flow accounting standard resulted in a reclassification of cash flows related to the deferred purchase price from securitization transactions from operating activities to investing activities. In addition, cash flows related to debt prepayment and extinguishment costs were reclassified from operating activities to financing activities. The effects of this change are applied retrospectively and are provided in the Reconciliation of Non-GAAP Financial Measures to GAAP Financial Measures tables. |
31
T-Mobile US, Inc. Supplementary Operating and Financial Data
Quarter | Nine Months Ended September 30, | |||||||||||||||||||||||||
(in thousands) | Q1 2017 | Q2 2017 | Q3 2017 | Q4 2017 | Q1 2018 | Q2 2018 | Q3 2018 | 2017 | 2018 | |||||||||||||||||
Customers, end of period | ||||||||||||||||||||||||||
Branded postpaid phone customers (1) (2) | 32,095 | 32,628 | 33,223 | 34,114 | 34,744 | 35,430 | 36,204 | 33,223 | 36,204 | |||||||||||||||||
Branded postpaid other customers (2) | 3,246 | 3,530 | 3,752 | 3,933 | 4,321 | 4,652 | 4,957 | 3,752 | 4,957 | |||||||||||||||||
Total branded postpaid customers | 35,341 | 36,158 | 36,975 | 38,047 | 39,065 | 40,082 | 41,161 | 36,975 | 41,161 | |||||||||||||||||
Branded prepaid customers (1) | 20,199 | 20,293 | 20,519 | 20,668 | 20,876 | 20,967 | 21,002 | 20,519 | 21,002 | |||||||||||||||||
Total branded customers | 55,540 | 56,451 | 57,494 | 58,715 | 59,941 | 61,049 | 62,163 | 57,494 | 62,163 | |||||||||||||||||
Wholesale customers (3) | 17,057 | 13,111 | 13,237 | 13,870 | 14,099 | 14,570 | 15,086 | 13,237 | 15,086 | |||||||||||||||||
Total customers, end of period | 72,597 | 69,562 | 70,731 | 72,585 | 74,040 | 75,619 | 77,249 | 70,731 | 77,249 | |||||||||||||||||
Adjustments to wholesale customers (3) | — | (4,368 | ) | (160 | ) | — | — | — | — | (4,528 | ) | — | ||||||||||||||
(1) | As a result of the acquisition of Iowa Wireless Services, LLC (IWS), we included an adjustment of 13,000 branded postpaid phone and 4,000 branded prepaid IWS customers in our reported subscriber base as of January 1, 2018. Additionally, as a result of the acquisition of Layer3 TV, we included an adjustment of 5,000 branded prepaid customers in our reported subscriber base as of January 22, 2018. |
(2) | During the third quarter of 2017, we retitled our “Branded postpaid mobile broadband customers” category to “Branded postpaid other customers” and reclassified 253,000 DIGITS customers from our “Branded postpaid phone customers” category for the second quarter of 2017, when the DIGITS product was released. |
(3) | We believe current and future regulatory changes have made the Lifeline program offered by our wholesale partners uneconomical. We will continue to support our wholesale partners offering the Lifeline program, but have excluded the Lifeline customers from our reported wholesale subscriber base resulting in the removal of 4,368,000 and 160,000 reported wholesale customers as of the beginning of Q2 2017 and Q3 2017, respectively. |
Quarter | Nine Months Ended September 30, | |||||||||||||||||||||||||
(in thousands) | Q1 2017 | Q2 2017 | Q3 2017 | Q4 2017 | Q1 2018 | Q2 2018 | Q3 2018 | 2017 | 2018 | |||||||||||||||||
Net customer additions (losses) | ||||||||||||||||||||||||||
Branded postpaid phone customers (1) (2) | 798 | 533 | 595 | 891 | 617 | 686 | 774 | 1,926 | 2,077 | |||||||||||||||||
Branded postpaid other customers (2) | 116 | 284 | 222 | 181 | 388 | 331 | 305 | 622 | 1,024 | |||||||||||||||||
Total branded postpaid customers | 914 | 817 | 817 | 1,072 | 1,005 | 1,017 | 1,079 | 2,548 | 3,101 | |||||||||||||||||
Branded prepaid customers (1) | 386 | 94 | 226 | 149 | 199 | 91 | 35 | 706 | 325 | |||||||||||||||||
Total branded customers | 1,300 | 911 | 1,043 | 1,221 | 1,204 | 1,108 | 1,114 | 3,254 | 3,426 | |||||||||||||||||
Wholesale customers (3) | (158 | ) | 422 | 286 | 633 | 229 | 471 | 516 | 550 | 1,216 | ||||||||||||||||
Total net customer additions | 1,142 | 1,333 | 1,329 | 1,854 | 1,433 | 1,579 | 1,630 | 3,804 | 4,642 | |||||||||||||||||
Adjustments to branded postpaid phone customers (2) | — | (253 | ) | — | — | — | — | — | (253 | ) | — | |||||||||||||||
Adjustments to branded postpaid other customers (2) | — | 253 | — | — | — | — | — | 253 | — | |||||||||||||||||
(1) | As a result of the acquisition of IWS and Layer3 TV, customer activity post acquisition was included in our net customer additions beginning in the first quarter of 2018. |
(2) | During the third quarter of 2017, we retitled our “Branded postpaid mobile broadband customers” category to “Branded postpaid other customers” and reclassified 253,000 DIGITS customer net additions from our “Branded postpaid phone customers” category for the second quarter of 2017, when the DIGITS product was released. |
(3) | Net customer activity for Lifeline was excluded beginning in the second quarter of 2017 due to our determination based upon changes in the applicable government regulations that the Lifeline program offered by our wholesale partners is uneconomical. |
Quarter | Nine Months Ended September 30, | |||||||||||||||||||||||||
Q1 2017 | Q2 2017 | Q3 2017 | Q4 2017 | Q1 2018 | Q2 2018 | Q3 2018 | 2017 | 2018 | ||||||||||||||||||
Branded postpaid phone churn | 1.18 | % | 1.10 | % | 1.23 | % | 1.18 | % | 1.07 | % | 0.95 | % | 1.02 | % | 1.18 | % | 1.02 | % | ||||||||
Branded prepaid churn | 4.01 | % | 3.91 | % | 4.25 | % | 4.00 | % | 3.94 | % | 3.81 | % | 4.12 | % | 4.06 | % | 3.95 | % | ||||||||
32
T-Mobile US, Inc. Supplementary Operating and Financial Data (continued)
Quarter | Nine Months Ended September 30, | ||||||||||||||||
Q1 2017 | Q2 2017 | Q3 2017 | Q4 2017 | Q1 2018 | Q2 2018 | Q3 2018 | 2017 | 2018 | |||||||||
Financial Metrics | |||||||||||||||||
Service revenues (in millions) | $7,329 | $7,445 | $7,629 | $7,757 | $7,806 | $7,931 | $8,066 | $22,403 | $23,803 | ||||||||
Total revenues (in millions) | $9,613 | $10,213 | $10,019 | $10,759 | $10,455 | $10,571 | $10,839 | $29,845 | $31,865 | ||||||||
Net income (in millions) | $698 | $581 | $550 | $2,707 | $671 | $782 | $795 | $1,829 | $2,248 | ||||||||
Net income margin | 10% | 8% | 7% | 35% | 9% | 10% | 10% | 8% | 9% | ||||||||
Adjusted EBITDA (in millions) | $2,668 | $3,012 | $2,822 | $2,711 | $2,956 | $3,233 | $3,239 | $8,502 | $9,428 | ||||||||
Adjusted EBITDA margin | 36% | 40% | 37% | 35% | 38% | 41% | 40% | 38% | 40% | ||||||||
Cash purchases of property and equipment including capitalized interest (in millions) | $1,528 | $1,347 | $1,441 | $921 | $1,366 | $1,629 | $1,362 | $4,316 | $4,357 | ||||||||
Capitalized Interest (in millions) | $48 | $34 | $29 | $25 | $43 | $102 | $101 | $111 | $246 | ||||||||
Cash purchases of property and equipment excluding capitalized interest (in millions) | $1,480 | $1,313 | $1,412 | $896 | $1,323 | $1,527 | $1,261 | $4,205 | $4,111 | ||||||||
Net cash provided by operating activities (in millions) (1) | $608 | $1,106 | $1,252 | $865 | $770 | $1,261 | $914 | $2,966 | $2,945 | ||||||||
Net cash provided by (used in) investing activities (in millions) (1) | $(416) | $(6,251) | $(345) | $267 | $(462) | $(306) | $(42) | $(7,012) | $(810) | ||||||||
Net cash provided by (used in) financing activities (in millions) (1) | $1,809 | $(2,175) | $(349) | $(652) | $1,000 | $(3,267) | $(758) | $(715) | $(3,025) | ||||||||
Free Cash Flow (in millions) (1) | $185 | $482 | $921 | $1,137 | $668 | $774 | $890 | $1,588 | $2,332 | ||||||||
Net cash proceeds from securitization | $(144) | $66 | $11 | $95 | $(150) | $25 | $(18) | $(67) | $(143) | ||||||||
Operating Metrics | |||||||||||||||||
Branded postpaid phone ARPU (2) | $47.53 | $47.07 | $46.93 | $46.38 | $46.66 | $46.52 | $46.17 | $47.17 | $46.44 | ||||||||
Branded postpaid ABPU | $61.89 | $60.40 | $59.89 | $59.88 | $60.14 | $58.37 | $57.69 | $60.71 | $58.71 | ||||||||
Branded prepaid ARPU | $38.53 | $38.65 | $38.93 | $38.63 | $38.90 | $38.48 | $38.34 | $38.71 | $38.57 | ||||||||
Branded postpaid accounts, end of period (in thousands) | 12,275 | 12,432 | 12,668 | 12,990 | 13,237 | 13,498 | 13,753 | 12,668 | 13,753 | ||||||||
Branded postpaid customers per account | 2.88 | 2.91 | 2.92 | 2.93 | 2.95 | 2.97 | 2.99 | 2.92 | 2.99 | ||||||||
Device Sales and Leased Devices | |||||||||||||||||
Phones (in millions) | 8.6 | 8.3 | 8.7 | 9.7 | 8.7 | 7.9 | 8.1 | 25.6 | 24.7 | ||||||||
Branded postpaid handset upgrade rate | 7% | 7% | 6% | 7% | 5% | 6% | 6% | 20% | 18% | ||||||||
Device Financing | |||||||||||||||||
Gross EIP financed (in millions) | $1,339 | $1,657 | $1,487 | $2,090 | $1,572 | $1,705 | $1,762 | $4,483 | $5,039 | ||||||||
EIP billings (in millions) | $1,402 | $1,402 | $1,481 | $1,581 | $1,698 | $1,585 | $1,601 | $4,285 | $4,884 | ||||||||
EIP receivables, net (in millions) | $2,855 | $3,162 | $3,236 | $3,564 | $3,515 | $3,530 | $3,589 | $3,236 | $3,589 | ||||||||
Lease revenues (in millions) | $324 | $234 | $159 | $160 | $171 | $177 | $176 | $717 | $524 | ||||||||
Leased devices transferred from inventory to property and equipment (in millions) | $243 | $270 | $262 | $356 | $304 | $280 | $229 | $775 | $813 | ||||||||
Returned leased devices transferred from property and equipment to inventory (in millions) | $(197) | $(273) | $(165) | $(107) | $(82) | $(90) | $(74) | $(635) | $(246) | ||||||||
Customer Quality | |||||||||||||||||
EIP receivables classified as prime | 43% | 43% | 43% | 44% | 43% | 42% | 42% | 43% | 42% | ||||||||
EIP receivables classified as prime (including EIP receivables sold) | 53% | 52% | 52% | 54% | 53% | 52% | 52% | 52% | 52% | ||||||||
Total bad debt expense and losses from sales of receivables (in millions) | $188 | $162 | $190 | $147 | $106 | $102 | $128 | $540 | $336 | ||||||||
(1) | In Q1 2018, the adoption of the new cash flow accounting standard resulted in a reclassification of cash flows related to the deferred purchase price from securitization transactions from operating activities to investing activities. In addition, cash flows related to debt prepayment and extinguishment costs were reclassified from operating activities to financing activities. In Q1 2018, we redefined Free Cash Flow to reflect the above changes in classification and present cash flows on a consistent basis for investor transparency. The effects of this change are applied retrospectively and are provided in the Reconciliation of Non-GAAP Financial Measures to GAAP Financial Measures tables. |
(2) | Branded postpaid phone ARPU includes the reclassification of 43,000 DIGITS average customers and the related revenue to the branded postpaid other customer category for the second quarter of 2017. |
33
T-Mobile US, Inc.
Reconciliation of Non-GAAP Financial Measures to GAAP Financial Measures
(Unaudited)
This Investor Factbook includes non-GAAP financial measures. The non-GAAP financial measures should be considered in addition to, but not as a substitute for, the information provided in accordance with GAAP. Reconciliations for the non-GAAP financial measures to the most directly comparable GAAP financial measures are provided below. T-Mobile is not able to forecast net income on a forward-looking basis without unreasonable efforts due to the high variability and difficulty in predicting certain items that affect GAAP net income including, but not limited to, income tax expense, stock-based compensation expense and interest expense. Adjusted EBITDA should not be used to predict net income as the difference between the two measures is variable.
Adjusted EBITDA is reconciled to net income as follows:
Quarter | Nine Months Ended September 30, | ||||||||||||||||||||||||||||||||||
(in millions) | Q1 2017 | Q2 2017 | Q3 2017 | Q4 2017 | Q1 2018 | Q2 2018 | Q3 2018 | 2017 | 2018 | ||||||||||||||||||||||||||
Net income | $ | 698 | $ | 581 | $ | 550 | $ | 2,707 | $ | 671 | $ | 782 | $ | 795 | $ | 1,829 | $ | 2,248 | |||||||||||||||||
Adjustments: | |||||||||||||||||||||||||||||||||||
Interest expense | 339 | 265 | 253 | 254 | 251 | 196 | 194 | 857 | 641 | ||||||||||||||||||||||||||
Interest expense to affiliates | 100 | 131 | 167 | 162 | 166 | 128 | 124 | 398 | 418 | ||||||||||||||||||||||||||
Interest income | (7 | ) | (6 | ) | (2 | ) | (2 | ) | (6 | ) | (6 | ) | (5 | ) | (15 | ) | (17 | ) | |||||||||||||||||
Other (income) expense, net | (2 | ) | 92 | (1 | ) | (16 | ) | (10 | ) | 64 | (3 | ) | 89 | 51 | |||||||||||||||||||||
Income tax expense (benefit) | (91 | ) | 353 | 356 | (1,993 | ) | 210 | 286 | 335 | 618 | 831 | ||||||||||||||||||||||||
Operating income | 1,037 | 1,416 | 1,323 | 1,112 | 1,282 | 1,450 | 1,440 | 3,776 | 4,172 | ||||||||||||||||||||||||||
Depreciation and amortization | 1,564 | 1,519 | 1,416 | 1,485 | 1,575 | 1,634 | 1,637 | 4,499 | 4,846 | ||||||||||||||||||||||||||
Stock-based compensation (1) | 67 | 72 | 83 | 85 | 96 | 106 | 102 | 222 | 304 | ||||||||||||||||||||||||||
Cost associated with the Transactions | — | — | — | — | — | 41 | 53 | — | 94 | ||||||||||||||||||||||||||
Other, net (2) | — | 5 | — | 29 | 3 | 2 | 7 | 5 | 12 | ||||||||||||||||||||||||||
Adjusted EBITDA | $ | 2,668 | $ | 3,012 | $ | 2,822 | $ | 2,711 | $ | 2,956 | $ | 3,233 | $ | 3,239 | $ | 8,502 | $ | 9,428 | |||||||||||||||||
(1) | Stock-based compensation includes payroll tax impacts and may not agree to stock-based compensation expense in the condensed consolidated financial statements. Additionally, certain stock-based compensation expenses associated with the Transactions have been included in Cost associated with the Transactions. |
(2) | Other, net may not agree to the Condensed Consolidated Statements of Comprehensive Income primarily due to certain non-routine operating activities, such as other special items that would not be expected to reoccur, and are therefore excluded in Adjusted EBITDA. |
34
T-Mobile US, Inc.
Reconciliation of Non-GAAP Financial Measures to GAAP Financial Measures (continued)
(Unaudited)
Net debt (excluding Tower obligations) to last twelve months Net income and Adjusted EBITDA ratios are calculated as follows:
(in millions, except net debt ratio) | Mar 31, 2017 | Jun 30, 2017 | Sep 30, 2017 | Dec 31, 2017 | Mar 31, 2018 | Jun 30, 2018 | Sep 30, 2018 | ||||||||||||||||||||
Short-term debt | $ | 7,542 | $ | 522 | $ | 558 | $ | 1,612 | $ | 3,320 | $ | 1,004 | $ | 783 | |||||||||||||
Short-term debt to affiliates | — | 680 | — | — | 445 | 320 | — | ||||||||||||||||||||
Long-term debt | 13,105 | 13,206 | 13,163 | 12,121 | 12,127 | 12,065 | 11,993 | ||||||||||||||||||||
Long-term debt to affiliates | 9,600 | 14,086 | 14,586 | 14,586 | 14,586 | 14,581 | 14,581 | ||||||||||||||||||||
Less: Cash and cash equivalents | (7,501 | ) | (181 | ) | (739 | ) | (1,219 | ) | (2,527 | ) | (215 | ) | (329 | ) | |||||||||||||
Net debt (excluding Tower Obligations) | $ | 22,746 | $ | 28,313 | $ | 27,568 | $ | 27,100 | $ | 27,951 | $ | 27,755 | $ | 27,028 | |||||||||||||
Divided by: Last twelve months Net income | $ | 1,679 | $ | 2,035 | $ | 2,219 | $ | 4,536 | $ | 4,509 | $ | 4,710 | $ | 4,955 | |||||||||||||
Net Debt (excluding Tower Obligations) to last twelve months Net income | 13.5 | 13.9 | 12.4 | 6.0 | 6.2 | 5.9 | 5.5 | ||||||||||||||||||||
Divided by: Last twelve months Adjusted EBITDA | $ | 10,493 | $ | 10,976 | $ | 11,109 | $ | 11,213 | $ | 11,501 | $ | 11,722 | $ | 12,139 | |||||||||||||
Net Debt (excluding Tower Obligations) to last twelve months Adjusted EBITDA Ratio | 2.2 | 2.6 | 2.5 | 2.4 | 2.4 | 2.4 | 2.2 | ||||||||||||||||||||
Free Cash Flow (1) is calculated as follows:
Quarter | Nine Months Ended September 30, | ||||||||||||||||||||||||||||||||||
(in millions) | Q1 2017 | Q2 2017 | Q3 2017 | Q4 2017 | Q1 2018 | Q2 2018 | Q3 2018 | 2017 | 2018 | ||||||||||||||||||||||||||
Net cash provided by operating activities | $ | 608 | $ | 1,106 | $ | 1,252 | $ | 865 | $ | 770 | $ | 1,261 | $ | 914 | $ | 2,966 | $ | 2,945 | |||||||||||||||||
Cash purchases of property and equipment | (1,528 | ) | (1,347 | ) | (1,441 | ) | (921 | ) | (1,366 | ) | (1,629 | ) | (1,362 | ) | (4,316 | ) | (4,357 | ) | |||||||||||||||||
Proceeds related to beneficial interests in securitization transactions | 1,134 | 882 | 1,110 | 1,193 | 1,295 | 1,323 | 1,338 | 3,126 | 3,956 | ||||||||||||||||||||||||||
Cash payments for debt prepayment or debt extinguishment costs | (29 | ) | (159 | ) | — | — | (31 | ) | (181 | ) | — | (188 | ) | (212 | ) | ||||||||||||||||||||
Free Cash Flow | $ | 185 | $ | 482 | $ | 921 | $ | 1,137 | $ | 668 | $ | 774 | $ | 890 | $ | 1,588 | $ | 2,332 | |||||||||||||||||
Net cash (used in) provided by investing activities | $ | (416 | ) | $ | (6,251 | ) | $ | (345 | ) | $ | 267 | $ | (462 | ) | $ | (306 | ) | $ | (42 | ) | $ | (7,012 | ) | $ | (810 | ) | |||||||||
Net cash provided by (used in) financing activities | $ | 1,809 | $ | (2,175 | ) | $ | (349 | ) | $ | (652 | ) | $ | 1,000 | $ | (3,267 | ) | $ | (758 | ) | $ | (715 | ) | $ | (3,025 | ) | ||||||||||
(1) | In Q1 2018, the adoption of the new cash flow accounting standard resulted in a reclassification of cash flows related to the deferred purchase price from securitization transactions from operating activities to investing activities. In addition, cash flows related to debt prepayment and extinguishment costs were reclassified from operating activities to financing activities. In Q1 2018, we redefined Free Cash Flow to reflect the above changes in classification and present cash flows on a consistent basis for investor transparency. The effects of this change are applied retrospectively. |
Free Cash Flow (1) three-year CAGR is calculated as follows:
FY | FY | ||||||||||||||||
(in millions, except CAGR Range) | 2016 | 2019 Guidance Range | CAGR Range | ||||||||||||||
Net cash provided by operating activities | $ | 2,779 | $ | 3,405 | $ | 3,855 | 7 | % | 12 | % | |||||||
Cash purchases of property and equipment | (4,702 | ) | (5,100 | ) | (5,400 | ) | 3 | % | 5 | % | |||||||
Proceeds related to beneficial interests in securitization transactions | 3,356 | 6,195 | 6,195 | ||||||||||||||
Cash payments for debt prepayment or debt extinguishment costs | — | — | (50 | ) | |||||||||||||
Free Cash Flow | $ | 1,433 | $ | 4,500 | $ | 4,600 | 46 | % | 48 | % | |||||||
(1) | In Q1 2018, the adoption of the new cash flow accounting standard resulted in a reclassification of cash flows related to the deferred purchase price from securitization transactions from operating activities to investing activities. In addition, cash flows related to debt prepayment and extinguishment costs were reclassified from operating activities to financing activities. In Q1 2018, we redefined Free Cash Flow to reflect the above changes in classification and present cash flows on a consistent basis for investor transparency. The effects of this change are applied retrospectively. |
35
T-Mobile US, Inc.
Reconciliation of Operating Measures to Service Revenues
(Unaudited)
The following tables illustrate the calculation of our operating measures ARPU and ABPU and reconcile these measures to the related service revenues:
(in millions, except average number of customers, ARPU and ABPU) | Quarter | Nine Months Ended September 30, | |||||||||||||||||||||||||||||||||
Q1 2017 | Q2 2017 | Q3 2017 | Q4 2017 | Q1 2018 | Q2 2018 | Q3 2018 | 2017 | 2018 | |||||||||||||||||||||||||||
Calculation of Branded Postpaid Phone ARPU | |||||||||||||||||||||||||||||||||||
Branded postpaid service revenues | $ | 4,725 | $ | 4,820 | $ | 4,920 | $ | 4,983 | $ | 5,070 | $ | 5,164 | $ | 5,244 | $ | 14,465 | $ | 15,478 | |||||||||||||||||
Less: Branded postpaid other revenues | (225 | ) | (255 | ) | (294 | ) | (303 | ) | (259 | ) | (272 | ) | (289 | ) | (774 | ) | (820 | ) | |||||||||||||||||
Branded postpaid phone service revenues | $ | 4,500 | $ | 4,565 | $ | 4,626 | $ | 4,680 | $ | 4,811 | $ | 4,892 | $ | 4,955 | $ | 13,691 | $ | 14,658 | |||||||||||||||||
Divided by: Average number of branded postpaid phone customers (in thousands) and number of months in period | 31,564 | 32,329 | 32,852 | 33,640 | 34,371 | 35,051 | 35,779 | 32,248 | 35,067 | ||||||||||||||||||||||||||
Branded postpaid phone ARPU (1) | $ | 47.53 | $ | 47.07 | $ | 46.93 | $ | 46.38 | $ | 46.66 | $ | 46.52 | $ | 46.17 | $ | 47.17 | $ | 46.44 | |||||||||||||||||
Calculation of Branded Postpaid ABPU | |||||||||||||||||||||||||||||||||||
Branded postpaid service revenues | $ | 4,725 | $ | 4,820 | $ | 4,920 | $ | 4,983 | $ | 5,070 | $ | 5,164 | $ | 5,244 | $ | 14,465 | $ | 15,478 | |||||||||||||||||
EIP billings | 1,402 | 1,402 | 1,481 | 1,581 | 1,698 | 1,585 | 1,601 | 4,285 | 4,884 | ||||||||||||||||||||||||||
Lease revenues | 324 | 234 | 159 | 160 | 171 | 177 | 176 | 717 | 524 | ||||||||||||||||||||||||||
Total billings for branded postpaid customers | $ | 6,451 | $ | 6,456 | $ | 6,560 | $ | 6,724 | $ | 6,939 | $ | 6,926 | $ | 7,021 | $ | 19,467 | $ | 20,886 | |||||||||||||||||
Divided by: Average number of branded postpaid customers (in thousands) and number of months in period | 34,740 | 35,636 | 36,505 | 37,436 | 38,458 | 39,559 | 40,561 | 35,627 | 39,526 | ||||||||||||||||||||||||||
Branded postpaid ABPU | $ | 61.89 | $ | 60.40 | $ | 59.89 | $ | 59.88 | $ | 60.14 | $ | 58.37 | $ | 57.69 | $ | 60.71 | $ | 58.71 | |||||||||||||||||
Calculation of Branded Prepaid ARPU | |||||||||||||||||||||||||||||||||||
Branded prepaid service revenues | $ | 2,299 | $ | 2,334 | $ | 2,376 | $ | 2,371 | $ | 2,402 | $ | 2,402 | $ | 2,395 | $ | 7,009 | $ | 7,199 | |||||||||||||||||
Divided by: Average number of branded prepaid customers (in thousands) and number of months in period | 19,889 | 20,131 | 20,336 | 20,461 | 20,583 | 20,806 | 20,820 | 20,119 | 20,737 | ||||||||||||||||||||||||||
Branded prepaid ARPU | $ | 38.53 | $ | 38.65 | $ | 38.93 | $ | 38.63 | $ | 38.90 | $ | 38.48 | $ | 38.34 | $ | 38.71 | $ | 38.57 | |||||||||||||||||
(1) | Branded postpaid phone ARPU includes the reclassification of 43,000 DIGITS average customers and related revenue to the “Branded postpaid other customers” category for the second quarter of 2017. |
36
Definitions of Terms
Operating and financial measures are utilized by T-Mobile’s management to evaluate its operating performance and, in certain cases, its ability to meet liquidity requirements. Although companies in the wireless industry may not define measures in precisely the same way, T-Mobile believes the measures facilitate key operating performance comparisons with other companies in the wireless industry to provide management, investors and analysts with useful information to assess and evaluate past performance and assist in forecasting future performance.
1. | Customer - SIM number with a unique T-Mobile mobile identifier which is associated with an account that generates revenue. Branded customers generally include customers that are qualified either for postpaid service, where they generally pay after incurring service, or prepaid service, where they generally pay in advance. Wholesale customers include Machine-to-Machine (M2M) and Mobile Virtual Network Operator (MVNO) customers that operate on T-Mobile’s network, but are managed by wholesale partners. |
2. | Churn - Number of customers whose service was disconnected as a percentage of the average number of customers during the specified period. The number of customers whose service was disconnected is presented net of customers that subsequently have their service restored within a certain period of time. |
3. | Customers per account - The number of branded postpaid customers as of the end of the period divided by the number of branded postpaid accounts as of the end of the period. An account may include branded postpaid phone, mobile broadband, and DIGITS customers. |
4. | Average Revenue Per User (ARPU) - Average monthly service revenue earned from customers. Service revenues for the specified period divided by the average customers during the period, further divided by the number of months in the period. |
Branded postpaid phone ARPU excludes mobile broadband and DIGITS customers and related revenues.
Average Billings per User (ABPU) - Average monthly branded postpaid service revenue earned from customers plus monthly EIP billings and lease revenues divided by the average branded postpaid customers during the period, further divided by the number of months in the period. T-Mobile believes branded postpaid ABPU is indicative of estimated cash collections, including device financing payments, from T-Mobile’s postpaid customers each month.
Service revenues - Branded postpaid, including handset insurance, branded prepaid, wholesale, and roaming and other service revenues.
5. | Cost of services - Costs directly attributable to providing wireless service through the operation of T-Mobile’s network, including direct switch and cell site costs, such as rent, network access and transport costs, utilities, maintenance, associated labor costs, long distance costs, regulatory program costs, roaming fees paid to other carriers and data content costs. |
Cost of equipment sales - Costs of devices and accessories sold to customers and dealers, device costs to fulfill insurance and warranty claims, write-downs of inventory related to shrinkage and obsolescence, and shipping and handling costs.
Selling, general and administrative expenses - Costs not directly attributable to providing wireless service for the operation of sales, customer care and corporate activities. These include all commissions paid to dealers and retail employees for activations and upgrades, labor and facilities costs associated with retail sales force and administrative space, marketing and promotional costs, customer support and billing, bad debt expense and administrative support activities.
6. | Net income margin - Margin % calculated as net income divided by service revenues. |
7. | Adjusted EBITDA - Earnings before interest expense, net of interest income, income tax expense, depreciation and amortization expense, non-cash stock-based compensation and certain expenses not reflective of T-Mobile’s ongoing operating performance. Adjusted EBITDA margin represents Adjusted EBITDA divided by service revenues. Adjusted EBITDA is a non-GAAP financial measure utilized by T-Mobile’s management to monitor the financial performance of our operations. T-Mobile uses Adjusted EBITDA internally as a metric to evaluate and compensate its personnel and management for their performance, and as a benchmark to evaluate T-Mobile’s operating performance in comparison to its competitors. Management believes analysts and investors use Adjusted EBITDA as a supplemental measure to evaluate overall operating performance and facilitate comparisons with other wireless communications companies because it is indicative of T-Mobile’s ongoing operating performance and trends by excluding the impact of interest expense from financing, non-cash depreciation and amortization from capital investments, non-cash stock-based compensation, network decommissioning costs and costs related to the Transactions, as they are not indicative of T-Mobile’s ongoing operating performance, as well as certain other nonrecurring income and expenses. Adjusted EBITDA has limitations as an analytical tool and should not be considered in isolation or as a substitute for income from operations, net income or any other measure of financial performance reported in accordance with U.S. Generally Accepted Accounting Principles (“GAAP”). |
8. | Adjusted EBITDA Margin - Margin % calculated as Adjusted EBITDA divided by service revenues. |
9. | Smartphones - UMTS/HSPA/HSPA+ 21/HSPA+ 42/4G LTE enabled converged devices, which integrate voice and data services. |
10. | Free Cash Flow - Net cash provided by operating activities less cash purchases of property and equipment, including proceeds related to beneficial interests in securitization transactions and less cash payments for debt prepayment or debt extinguishment costs. Free Cash Flow is utilized by T-Mobile’s management, investors, and analysts to evaluate cash available to pay debt and provide further investment in the business. The reconciliation of Free Cash Flow to net cash provided by operating activities is detailed in the Reconciliation of Non-GAAP Financial Measures to GAAP Financial Measures schedule. In Q1 2018, we made an accounting change to reduce net cash provided by operating activities by the deferred purchase price less payments for debt prepayment or debt extinguishment costs, as a result of the adoption of ASU 2016-15. Free Cash Flow has been redefined to reflect the changes in classification and present cash flows on a consistent basis for investor transparency. |
11. | Net debt - Short-term debt, short-term debt to affiliates, long-term debt, and long-term debt (excluding tower obligations) to affiliates, less cash and cash equivalents. |
37
Cautionary Statement Regarding Forward-Looking Statements
This communication includes forward-looking statements within the meaning of the Private Securities Litigation Reform Act of 1995. All statements other than statements of historical fact, including information concerning T-Mobile US, Inc.’s future results of operations, are forward-looking statements. These forward-looking statements are generally identified by the words “anticipate,” “expect,” “believe,” “intend,” “may,” “could,” or similar expressions. Forward-looking statements are based on current expectations and assumptions, which are subject to risks and uncertainties and may cause actual results to differ materially from the forward-looking statements. Important factors that could affect future results and cause those results to differ materially from those expressed in the forward-looking statements include, among others, the following: the failure to obtain, or delays in obtaining, required regulatory approvals the Transactions and the risk that such approvals may result in the imposition of conditions that could adversely affect the combined company or the expected benefits of the Transactions, or the failure to satisfy any of the other conditions to the Transactions on a timely basis or at all; the occurrence of events that may give rise to a right of one or both of the parties to terminate the Business Combination Agreement with Sprint; adverse effects on the market price of our common stock or on our or Sprint’s operating results because of a failure to complete the Transactions in the anticipated timeframe or at all; inability to obtain the financing contemplated to be obtained in connection with the Transactions on the expected terms or timing or at all; the ability of us, Sprint and the combined company to make payments on debt or to repay existing or future indebtedness when due or to comply with the covenants contained therein; adverse changes in the ratings of our or Sprint’s debt securities or adverse conditions in the credit markets; negative effects of the announcement, pendency or consummation of the Transactions on the market price of our common stock and on our or Sprint’s operating results, including as a result of changes in key customer, supplier, employee or other business relationships; significant costs related to the Transactions, including financing costs, and unknown liabilities of Sprint or that may arise; failure to realize the expected benefits and synergies of the Transactions in the expected timeframes or at all; costs or difficulties related to the integration of Sprint’s network and operations into our network and operations; the risk of litigation or regulatory actions related to the Transactions; the inability of us, Sprint or the combined company to retain and hire key personnel; the risk that certain contractual restrictions contained in the Business Combination Agreement with Sprint during the pendency of the Transactions could adversely affect our or Sprint’s ability to pursue business opportunities or strategic transactions; adverse economic or political conditions in the U.S. and international markets; competition, industry consolidation, and changes in the market for wireless services, which could negatively affect our ability to attract and retain customers; the effects of any future merger, investment, or acquisition involving us, as well as the effects of mergers, investments, or acquisitions in the technology, media and telecommunications industry; challenges in implementing our business strategies or funding our operations, including payment for additional spectrum or network upgrades; the possibility that we may be unable to renew our spectrum licenses on attractive terms or acquire new spectrum licenses at reasonable costs and terms; difficulties in managing growth in wireless data services, including network quality; material changes in available technology and the effects of such changes, including product substitutions and deployment costs and performance; the timing, scope and financial impact of our deployment of advanced network and business technologies; the impact on our networks and business from major technology equipment failures; breaches of our and/or our third-party vendors’ networks, information technology and data security, resulting in unauthorized access to customer confidential information; natural disasters, terrorist attacks or similar incidents; unfavorable outcomes of existing or future litigation; any changes in the regulatory environments in which we operate, including any increase in restrictions on the ability to operate our networks and data privacy laws; any disruption or failure of our third parties’ or key suppliers’ provisioning of products or services; material adverse changes in labor matters, including labor campaigns, negotiations or additional organizing activity, and any resulting financial, operational and/or reputational impact; changes in accounting assumptions that regulatory agencies, including the SEC, may require, which could result in an impact on earnings; changes in tax laws, regulations and existing standards and the resolution of disputes with any taxing jurisdictions; the possibility that the reset process under our trademark license with Deutsche Telekom AG results in changes to the royalty rates for our trademarks; and other risks described in our filings with the U.S. Securities and Exchange Commission (“SEC”), all of which are available at www.sec.gov and www.t-mobile.com. You should not place undue reliance on these forward-looking statements. We do not undertake to update forward-looking statements, whether as a result of new information, future events or otherwise, except as required by law.
Important Additional Information
In connection with the Transactions, T-Mobile US, Inc. (“T-Mobile”) has filed a registration statement on Form S-4 (File No. 333-226435), which contains a joint consent solicitation statement of T-Mobile and Sprint Corporation (“Sprint”), that also constitutes a prospectus of T-Mobile (the “joint consent solicitation statement/prospectus”), and each party will file other documents regarding the Transactions with the SEC. The registration statement on Form S-4 was declared effective by the SEC on October 29, 2018, and T-Mobile and Sprint commenced mailing the joint consent solicitation statement/prospectus to their respective stockholders on October 29, 2018. INVESTORS AND SECURITY HOLDERS ARE URGED TO READ THE JOINT CONSENT SOLICITATION STATEMENT/PROSPECTUS AND OTHER RELEVANT DOCUMENTS FILED WITH THE SEC WHEN THEY BECOME AVAILABLE BECAUSE THEY WILL CONTAIN IMPORTANT INFORMATION. Investors and security holders may obtain these documents free of charge from the SEC’s website or from T-Mobile or Sprint. The documents filed by T-Mobile may be obtained free of charge at T-Mobile’s website, at www.t-mobile.com, or at the SEC’s website, at www.sec.gov, or from T-Mobile by requesting them by mail at T-Mobile US, Inc., Investor Relations, 1 Park Avenue, 14th Floor, New York, NY 10016, or by telephone at 212-358-3210. The documents filed by Sprint may be obtained free of charge at Sprint’s website, at www.sprint.com, or at the SEC’s website, at www.sec.gov, or from Sprint by requesting them by mail at Sprint Corporation, Shareholder Relations, 6200 Sprint Parkway, Mailstop KSOPHF0302-3B679, Overland Park, Kansas 66251, or by telephone at 913-794-1091.
Participants in the Solicitation
T-Mobile and Sprint and their respective directors and executive officers and other members of management and employees may be deemed to be participants in the solicitation of consents in respect of the Transactions. Information about T-Mobile’s directors and executive officers is available in T-Mobile’s proxy statement dated April 26, 2018, for its 2018 Annual Meeting of Stockholders. Information about Sprint’s directors and executive officers is available in Sprint’s proxy statement dated June 26, 2018, for its 2018 Annual Meeting of Stockholders, and in Sprint’s subsequent Current Report on Form 8-K filed with the SEC on July 2, 2018. Other information regarding the participants in the consent solicitation and a description of their direct and indirect interests, by security holdings or otherwise, is contained in the joint consent solicitation statement/prospectus. Investors should read the joint consent solicitation statement/prospectus carefully before making any voting or investment decisions. You may obtain free copies of these documents from T-Mobile or Sprint as indicated above.
38
No Offer or Solicitation
This communication shall not constitute an offer to sell or the solicitation of an offer to buy any securities, nor shall there be any sale of securities in any jurisdiction in which such offer, solicitation or sale would be unlawful prior to registration or qualification under the securities laws of any such jurisdiction. No offering of securities shall be made except by means of a prospectus meeting the requirements of Section 10 of the U.S. Securities Act of 1933, as amended.
About T-Mobile US, Inc.
As America’s Un-carrier, T-Mobile US, Inc. (NASDAQ: TMUS) is redefining the way consumers and businesses buy wireless services through leading product and service innovation. Our advanced nationwide 4G LTE network delivers outstanding wireless experiences to 77.2 million customers who are unwilling to compromise on quality and value. Based in Bellevue, Washington, T-Mobile US provides services through its subsidiaries and operates its flagship brands, T-Mobile and MetroPCS. For more information, please visit http://www.T-Mobile.com or join the conversation on Twitter using $TMUS.
39