Attached files
| file | filename |
|---|---|
| EX-99.1 - EXHIBIT 99.1 - Shutterstock, Inc. | a2018-q3_exx991.htm |
| 8-K - 8-K - Shutterstock, Inc. | a2018-q3_8xkdocument.htm |

Third Quarter 2018 October 30, 2018 Please remember this information is confidential.

Forward-Looking Statements This presentation contains “forward-looking” statements within the meaning of the Private Securities Litigation Reform Act of 1995 that are based on our management’s beliefs and assumptions and on information currently available to management. Forward-looking statements include information concerning Shutterstock, Inc.’s (the “Company’s”) current expectations and guidance for the full year 2018. Forward-looking statements include all statements that are not historical facts and can be identified by terms such as “anticipates,” “believes,” “could,” “estimates,” “expects,” “guidance,” “intends,” “may,” “plans,” “potential,” “predicts,” “projects,” “seeks,” “should,” “will,” “would” or similar expressions and the negatives of those terms. Forward-looking statements are subject to known and unknown risks, uncertainties and other factors that may cause our actual results, performance or achievements to be materially different from any future results, performance or achievements expressed or implied by the forward-looking statements. Forward- looking statements represent our management’s beliefs and assumptions only as of the date made, and readers are cautioned not to place undue reliance on such statements. You should read our public filings with the Securities and Exchange Commission, including the Risk Factors set forth therein, for additional information regarding factors that may cause actual results to materially differ. Except as required by law, we assume no obligation to update these forward-looking statements publicly, or to update the reasons actual results could differ materially from those anticipated in the forward-looking statements, even if new information becomes available in the future. 2

Non-GAAP Financial Measures In addition to reporting financial results in accordance with accounting principles generally accepted in the United States (GAAP), we also refer to adjusted EBITDA, adjusted net income, revenue growth on a constant currency basis, revenue excluding the impact of Webdam, adjusted EBITDA margin, and free cash flow. We define adjusted EBITDA as net income adjusted for foreign currency transaction gains and losses, expenses related to long-term incentives and contingent consideration related to acquisitions, the gain on the Sale of Webdam, impairment charges related to long-term investments, interest income and expense, income taxes, depreciation, amortization, disposals and non-cash equity-based compensation; adjusted net income as net income excluding the impact of one-time tax charges related to the enactment of the Tax Cuts and Jobs Act (TCJA), the impact of non-cash equity-based compensation, the amortization of acquisition-related intangible assets, the gain on the Sale of Webdam, impairment charges related to long-term investments and expenses related to long-term incentives and contingent consideration related to acquisitions and the estimated tax impact of such adjustments; revenue growth on a constant currency basis (expressed as a percentage) as the increase in current period revenues over prior period revenues, utilizing fixed exchange rates for translating foreign currency revenues for both periods; revenue excluding the impact of Webdam as total Company revenue for each period presented, less the amount of revenue generated by the Webdam business during that period; adjusted EBITDA margin (expressed as a percentage) as the ratio of adjusted EBITDA to revenue; and free cash flow as cash provided by operating activities adjusted for capital expenditures and content acquisition. These figures have not been calculated in accordance with GAAP and should be considered in addition to results prepared in accordance with GAAP, and should not be considered as a substitute for, or superior to, GAAP results. We caution investors that non-GAAP financial measures are not based on any standardized methodology prescribed by GAAP and are not necessarily comparable to similarly-titled measures presented by other companies. We believe that adjusted EBITDA, adjusted net income, revenue excluding the impact of Webdam, revenue growth on a constant currency basis and adjusted EBITDA margin are useful to investors to provide them with disclosures of our operating results on the same basis as that used by management. Additionally, we believe that adjusted EBITDA and adjusted net income provide useful information to investors about the performance of the Company’s overall business because such measures eliminate the effects of unusual or other infrequent charges that are not directly attributable to our underlying operating performance; with respect to revenue growth on a constant currency basis, provide useful information to investors by eliminating the effect of foreign currency fluctuations that are not directly attributable to Shutterstock’s business; and with respect to revenue excluding the impact of Webdam, provide useful information to investors by eliminating the impact of a historical revenue source that is not part of our current business. Additionally, we believe that providing these non-GAAP financial measures enhances the comparability for investors in assessing our financial reporting. We believe that free cash flow is useful for investors because it provides them with an important perspective on the cash available for strategic measures, after making necessary capital investments in property and equipment to support the Company’s ongoing business operations, and provides them with the same measures that we use as the basis for making resource allocation decisions. We also use the non-GAAP financial measures adjusted EBITDA, adjusted net income, revenue excluding the impact of Webdam, revenue growth on a constant currency basis, adjusted EBITDA margin, and free cash flow, in conjunction with GAAP financial measures, as an integral part of managing the business and to: (i) monitor and evaluate the performance of Shutterstock’s business operations, financial performance and overall liquidity; (ii) facilitate management’s internal comparisons of the historical operating performance of its business operations; (iii) facilitate management’s external comparisons of the results of its overall business to the historical operating performance of other companies that may have different capital structures and debt levels; (iv) review and assess the operating performance of Shutterstock’s management team and, together with other operational objectives, as a measure in evaluating employee compensation and bonuses; (v) analyze and evaluate financial and strategic planning decisions regarding future operating investments; and (vi) plan for and prepare future annual operating budgets and determine appropriate levels of operating investments. Please refer to the reconciliation of the differences between adjusted EBITDA, adjusted net income, revenue excluding the impact of Webdam and free cash flow, and the most comparable financial measure calculated and presented in accordance with GAAP, presented under the heading “Reconciliation of Non-GAAP Financial Information to GAAP” immediately following the Consolidated Balance Sheets in today’s earnings release, which is available in the Investor Relations section of our website. We do not provide a reconciliation of adjusted EBITDA guidance to net income guidance, as the impact of net non-operating foreign currency exchange gains or losses which are excluded from adjusted EBITDA is inherently uncertain and difficult to estimate and is unavailable without unreasonable efforts. In addition, we believe such reconciliations would imply a degree of precision that would be confusing or misleading to investors. 3

Third Quarter 2018 Financial Highlights Compared to Third Quarter 2017: • Revenue increased 7.5% to $151.6 million primarily driven by growth in new customers across our enterprise and e-commerce channels and an increase in paid download activity. • Revenue increased 8.0% on a constant currency basis. • Revenue increased 10.7% excluding the impact of Webdam. • Revenue increased 11.3% excluding the impact of Webdam and on a constant currency basis. • Income from Operations increased 20.3% to $6.7 million. • Net income increased 48.9% to $7.4 million. • Adjusted net income increased 23.3% to $13.4 million. • Adjusted EBITDA increased 8.1% to $25.1 million. • Free cash flow was $22.4 million in 2018 compared to $18.2 million in 2017. 4

Third Quarter 2018 Operating Highlights Compared to Third Quarter 2017: • Paid downloads of 43.9 million, up 4.9%. • Image library expanded to approximately 221 million images, up 42%. • Video library expanded to approximately 12 million video clips, up 44%. • More than 550,000 contributors made their images, video clips & music tracks available on Shutterstock’s platform. • Nearly 1.9 million customers contributed to revenue over past 12 months, an increase of 5.1%. 5

Liquidity and Capital Allocation • Cash and Cash Equivalents of $206.4 million as of September 30, 2018, compared to $253.4 million as of December 31, 2017. • In the nine months ended September 30, 2018: ◦ Cash generated by operations of $68.5 million. ◦ Proceeds from the Sale of Webdam of $41.8 million. ◦ Net cash taxes paid of $0.4 million in 2018 compared to $4.1 million in 2017. ◦ Paid special non-recurring cash dividend of $104.9 million in August 2018. ◦ Free cash flow of $36.1 million in 2018, an increase of 15% from 2017. 6

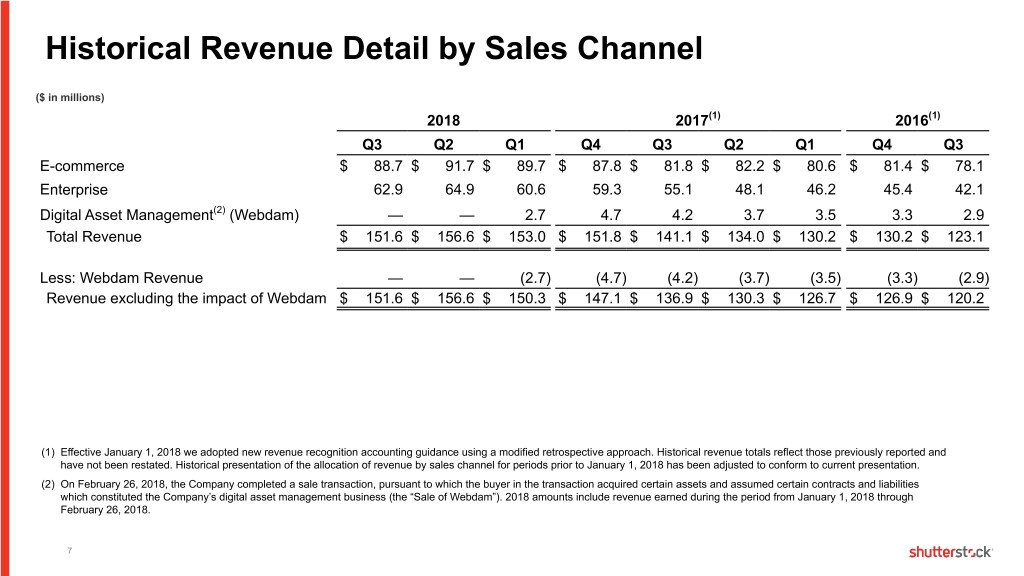
Historical Revenue Detail by Sales Channel ($ in millions) 2018 2017(1) 2016(1) Q3 Q2 Q1 Q4 Q3 Q2 Q1 Q4 Q3 E-commerce $ 88.7 $ 91.7 $ 89.7 $ 87.8 $ 81.8 $ 82.2 $ 80.6 $ 81.4 $ 78.1 Enterprise 62.9 64.9 60.6 59.3 55.1 48.1 46.2 45.4 42.1 Digital Asset Management(2) (Webdam) — — 2.7 4.7 4.2 3.7 3.5 3.3 2.9 Total Revenue $ 151.6 $ 156.6 $ 153.0 $ 151.8 $ 141.1 $ 134.0 $ 130.2 $ 130.2 $ 123.1 Less: Webdam Revenue — — (2.7) (4.7) (4.2) (3.7) (3.5) (3.3) (2.9) Revenue excluding the impact of Webdam $ 151.6 $ 156.6 $ 150.3 $ 147.1 $ 136.9 $ 130.3 $ 126.7 $ 126.9 $ 120.2 (1) Effective January 1, 2018 we adopted new revenue recognition accounting guidance using a modified retrospective approach. Historical revenue totals reflect those previously reported and have not been restated. Historical presentation of the allocation of revenue by sales channel for periods prior to January 1, 2018 has been adjusted to conform to current presentation. (2) On February 26, 2018, the Company completed a sale transaction, pursuant to which the buyer in the transaction acquired certain assets and assumed certain contracts and liabilities which constituted the Company’s digital asset management business (the “Sale of Webdam”). 2018 amounts include revenue earned during the period from January 1, 2018 through February 26, 2018. 7

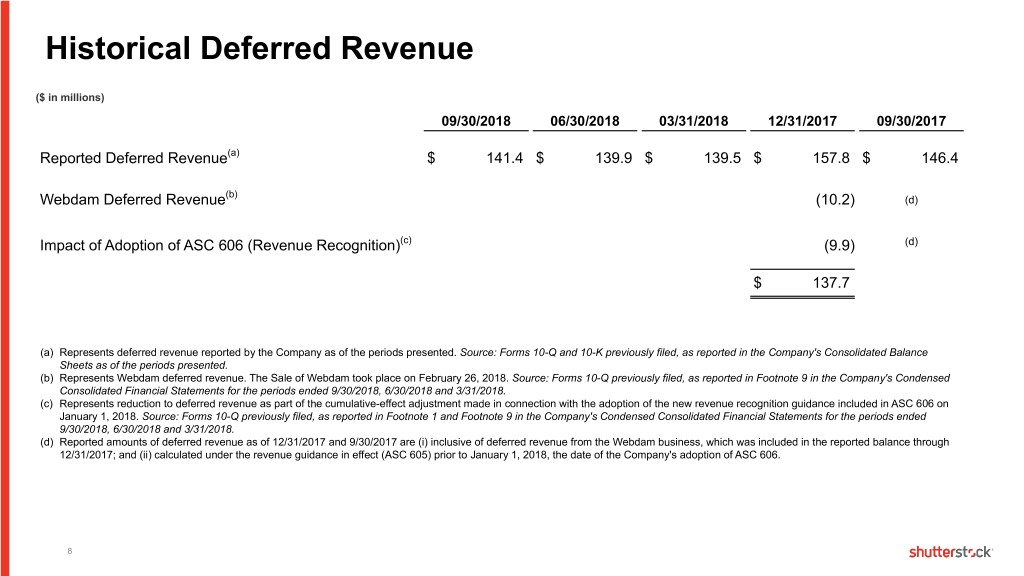
Historical Deferred Revenue ($ in millions) 09/30/2018 06/30/2018 03/31/2018 12/31/2017 09/30/2017 Reported Deferred Revenue(a) $ 141.4 $ 139.9 $ 139.5 $ 157.8 $ 146.4 (b) Webdam Deferred Revenue (10.2) (d) Impact of Adoption of ASC 606 (Revenue Recognition)(c) (9.9) (d) $ 137.7 (a) Represents deferred revenue reported by the Company as of the periods presented. Source: Forms 10-Q and 10-K previously filed, as reported in the Company's Consolidated Balance Sheets as of the periods presented. (b) Represents Webdam deferred revenue. The Sale of Webdam took place on February 26, 2018. Source: Forms 10-Q previously filed, as reported in Footnote 9 in the Company's Condensed Consolidated Financial Statements for the periods ended 9/30/2018, 6/30/2018 and 3/31/2018. (c) Represents reduction to deferred revenue as part of the cumulative-effect adjustment made in connection with the adoption of the new revenue recognition guidance included in ASC 606 on January 1, 2018. Source: Forms 10-Q previously filed, as reported in Footnote 1 and Footnote 9 in the Company's Condensed Consolidated Financial Statements for the periods ended 9/30/2018, 6/30/2018 and 3/31/2018. (d) Reported amounts of deferred revenue as of 12/31/2017 and 9/30/2017 are (i) inclusive of deferred revenue from the Webdam business, which was included in the reported balance through 12/31/2017; and (ii) calculated under the revenue guidance in effect (ASC 605) prior to January 1, 2018, the date of the Company's adoption of ASC 606. 8

Adjusted EBITDA ($ in millions) Three Months Ended September 30, 2018 2017 % Δ Total Revenues $ 151.6 $ 141.1 7 % Total Expenses 144.2 136.1 6 % Net Income 7.4 5.0 NM Plus: Depreciation & Amortization 11.7 10.2 15 % Plus: Equity-Based Compensation 6.0 6.9 (13)% Plus: Other Adjustments (1) 0.5 0.4 NM Plus: Provision for Income Taxes (0.5) 0.7 NM Adjusted EBITDA $ 25.1 $ 23.2 8 % Adjusted EBITDA Margin 16.5% 16.4% Capitalized Labor $ 6.4 $ 11.2 (43)% (1) Other adjustments include foreign currency translation gains and losses, interest income, expenses related to long-term incentives and contingent consideration related to acquisitions and impairment charges related to the long-term investment in SHM. 9

Free Cash Flow ($ in millions) Three Months Ended September 30, 2018 2017 Net Cash From Operations $ 30.5 $ 31.1 Less: Capital Expenditures (6.5) (11.9) Less: Content Acquisitions (1.6) (1.0) Free Cash Flow $ 22.4 $ 18.2 10

Adjusted Net Income (in millions, except per share data) Three Months Ended September 30, 2018 2017 Net Income $ 7.4 $ 5.0 Add: Non-Cash Equity-Based Comp 6.0 6.9 Add: Acquisition-Related Amortization 0.9 1.9 Add: Acquisition-Related Long-Term Incentives and Contingent Consideration 0.7 0.5 Add: Impairment of Long-Term Investment in SHM — — Add: Tax Effect of Adjustments (1.6) (3.4) Adjusted Net Income $ 13.4 $ 10.9 Diluted Shares Outstanding 35.6 35.2 Adjusted Net Income per Diluted Share $ 0.38 $ 0.31 11

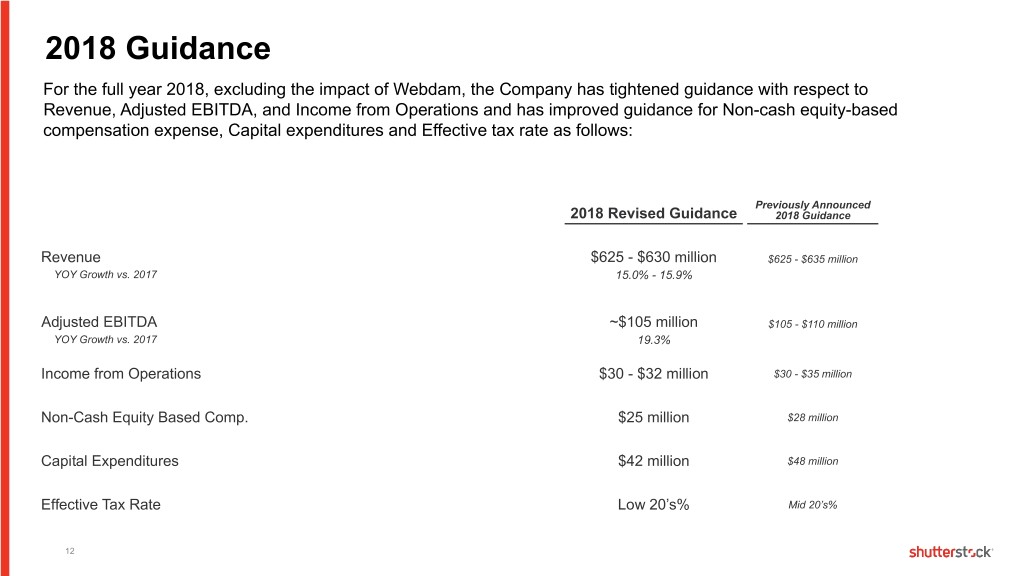
2018 Guidance For the full year 2018, excluding the impact of Webdam, the Company has tightened guidance with respect to Revenue, Adjusted EBITDA, and Income from Operations and has improved guidance for Non-cash equity-based compensation expense, Capital expenditures and Effective tax rate as follows: Previously Announced 2018 Revised Guidance 2018 Guidance Revenue $625 - $630 million $625 - $635 million YOY Growth vs. 2017 15.0% - 15.9% Adjusted EBITDA ~$105 million $105 - $110 million YOY Growth vs. 2017 19.3% Income from Operations $30 - $32 million $30 - $35 million Non-Cash Equity Based Comp. $25 million $28 million Capital Expenditures $42 million $48 million Effective Tax Rate Low 20’s% Mid 20’s% 12

© 2018Please Shutterstock, remember this Inc. information All rights is reserved. confidential.
