Attached files
| file | filename |
|---|---|
| EX-99.2 - EX-99.2 - META FINANCIAL GROUP INC | d644773dex992.htm |
| EX-99.1 - EX-99.1 - META FINANCIAL GROUP INC | d644773dex991.htm |
| 8-K - 8-K - META FINANCIAL GROUP INC | d644773d8k.htm |
Quarterly Investor UpdateFourth Quarter and Fiscal Year End 2018 Exhibit 99.3
Forward Looking Statements Meta Financial Group, Inc.® (the “Company”) and its wholly-owned subsidiary, MetaBank® (the “Bank”), may from time to time make written or oral “forward-looking statements,” including statements contained in this investor update, the Company’s filings with the Securities and Exchange Commission (“SEC”), the Company’s reports to stockholders, and in other communications by the Company and the Bank, which are made in good faith by the Company pursuant to the “safe harbor” provisions of the Private Securities Litigation Reform Act of 1995. You can identify forward-looking statements by words such as “may,” “hope,” “will,” “should,” “expect,” “plan,” “anticipate,” “intend,” “believe,” “estimate,” “predict,” “potential,” “continue,” “could,” “future,” or the negative of those terms, or other words of similar meaning or similar expressions. You should carefully read statements that contain these words because they discuss our future expectations or state other “forward-looking” information. These forward-looking statements are based on information currently available to us and assumptions about future events, and include statements with respect to the Company’s beliefs, expectations, estimates, and intentions, which are subject to significant risks and uncertainties, and are subject to change based on various factors, some of which are beyond the Company’s control. Such risks, uncertainties and other factors may cause our actual growth, results of operations, financial condition, cash flows, performance and business prospects and opportunities to differ materially from those expressed in or implied by these forward-looking statements. Such statements address, among others, the following subjects: future operating results; customer retention; loan and other product demand; important components of the Company's statements of financial condition and operations; growth and expansion; new products and services, such as those offered by the Bank or MPS, a division of the Bank; credit quality and adequacy of reserves; technology; and the Company's employees. The following factors, among others, could cause the Company's financial performance and results of operations to differ materially from the expectations, estimates, and intentions expressed in such forward-looking statements: risks relating to the recently-announced management transition; the expected growth opportunities, beneficial synergies and/or operating efficiencies from the Crestmark acquisition may not be fully realized or may take longer to realize than expected; customer losses and business disruption related to the Crestmark acquisition; unanticipated or unknown losses and liabilities may be incurred by the Company following the completion of the Crestmark acquisition; maintaining our executive management team; the strength of the United States' economy, in general, and the strength of the local economies in which the Company conducts operations; the effects of, and changes in, trade, monetary, and fiscal policies and laws, including interest rate policies of the Board of Governors of the Federal Reserve System (the “Federal Reserve”), as well as efforts of the United States Treasury in conjunction with bank regulatory agencies to stimulate the economy and protect the financial system; inflation, interest rate, market, and monetary fluctuations; the timely development and acceptance of new products and services offered by the Company or its strategic partners, as well as risks (including reputational and litigation) attendant thereto, and the perceived overall value of these products and services by users; the risks of dealing with or utilizing third parties, including, in connection with the Company’s refund advance business, the risks of reduced volume of refund advance loans as a result of reduced customer demand for or acceptance or usage of Meta’s strategic partners’ refund advance products; any actions which may be initiated by our regulators in the future; the impact of changes in financial services laws and regulations, including, but not limited to, laws and regulations relating to the tax refund industry and the insurance premium finance industry; our relationship with our primary regulators, the Office of the Comptroller of the Currency and the Federal Reserve, as well as the Federal Deposit Insurance Corporation, which insures the Bank’s deposit accounts up to applicable limits; technological changes, including, but not limited to, the protection of electronic files or databases; acquisitions; litigation risk, in general, including, but not limited to, those risks involving the Bank's divisions; the growth of the Company’s business (including in light of any future acquisitions), as well as expenses related thereto; continued maintenance by the Bank of its status as a well-capitalized institution, particularly in light of our growing deposit base, a portion of which has been characterized as “brokered;" changes in consumer spending and saving habits; and the success of the Company at maintaining its high-quality asset level and managing and collecting assets of borrowers in default should problem assets increase. The foregoing list of factors is not exclusive. We caution you not to place undue reliance on these forward-looking statements. The forward-looking statements included herein speak only as of the date of this investor update. All subsequent written and oral forward-looking statements attributable to us or any person acting on our behalf are expressly qualified in their entirety by the cautionary statements contained or referred to in this cautionary note. Additional discussions of factors affecting the Company’s business and prospects are reflected under the caption “Risk Factors” and in other sections of the Company’s Annual Report on Form 10-K for the Company's fiscal year ended September 30, 2017 and in other periodic filings made with the SEC. The Company expressly disclaims any intent or obligation to update any forward-looking statements, whether written or oral, that may be made from time to time by or on behalf of the Company or its subsidiaries, whether as a result of new information, changed circumstances or future events or for any other reason.
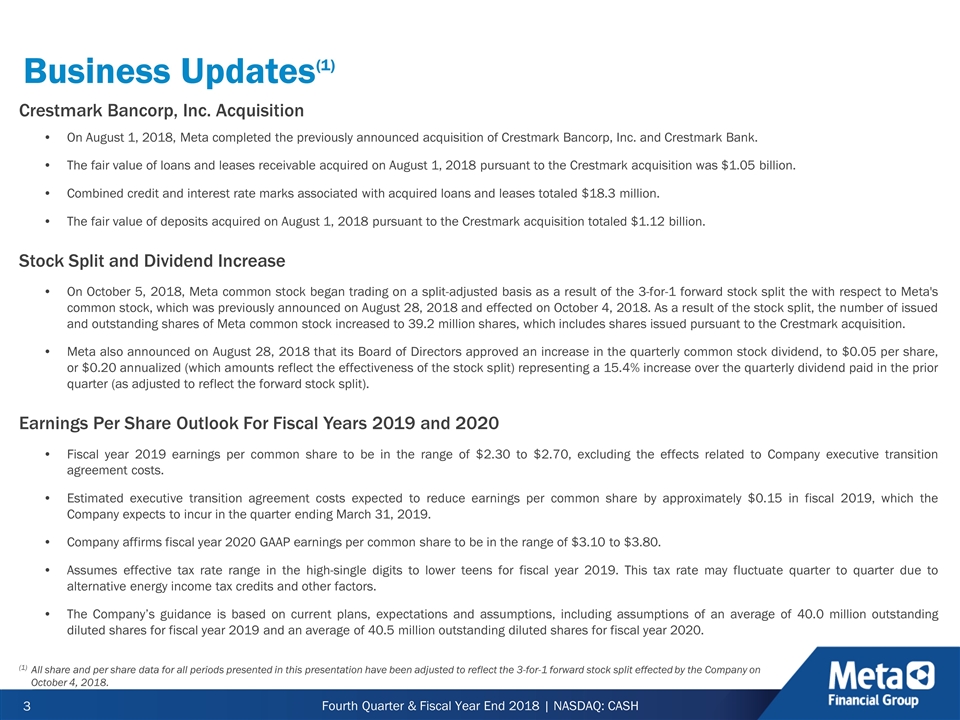
Business Updates Crestmark Bancorp, Inc. Acquisition On August 1, 2018, Meta completed the previously announced acquisition of Crestmark Bancorp, Inc. and Crestmark Bank. The fair value of loans and leases receivable acquired on August 1, 2018 pursuant to the Crestmark acquisition was $1.05 billion. Combined credit and interest rate marks associated with acquired loans and leases totaled $18.3 million. The fair value of deposits acquired on August 1, 2018 pursuant to the Crestmark acquisition totaled $1.12 billion. Stock Split and Dividend Increase On October 5, 2018, Meta common stock began trading on a split-adjusted basis as a result of the 3-for-1 forward stock split the with respect to Meta's common stock, which was previously announced on August 28, 2018 and effected on October 4, 2018. As a result of the stock split, the number of issued and outstanding shares of Meta common stock increased to 39.2 million shares, which includes shares issued pursuant to the Crestmark acquisition. Meta also announced on August 28, 2018 that its Board of Directors approved an increase in the quarterly common stock dividend, to $0.05 per share, or $0.20 annualized (which amounts reflect the effectiveness of the stock split) representing a 15.4% increase over the quarterly dividend paid in the prior quarter (as adjusted to reflect the forward stock split). Earnings Per Share Outlook For Fiscal Years 2019 and 2020 Fiscal year 2019 earnings per common share to be in the range of $2.30 to $2.70, excluding the effects related to Company executive transition agreement costs. Estimated executive transition agreement costs expected to reduce earnings per common share by approximately $0.15 in fiscal 2019, which the Company expects to incur in the quarter ending March 31, 2019. Company affirms fiscal year 2020 GAAP earnings per common share to be in the range of $3.10 to $3.80. Assumes effective tax rate range in the high-single digits to lower teens for fiscal year 2019. This tax rate may fluctuate quarter to quarter due to alternative energy income tax credits and other factors. The Company’s guidance is based on current plans, expectations and assumptions, including assumptions of an average of 40.0 million outstanding diluted shares for fiscal year 2019 and an average of 40.5 million outstanding diluted shares for fiscal year 2020. (1) All share and per share data for all periods presented in this presentation have been adjusted to reflect the 3-for-1 forward stock split effected by the Company on October 4, 2018. (1)
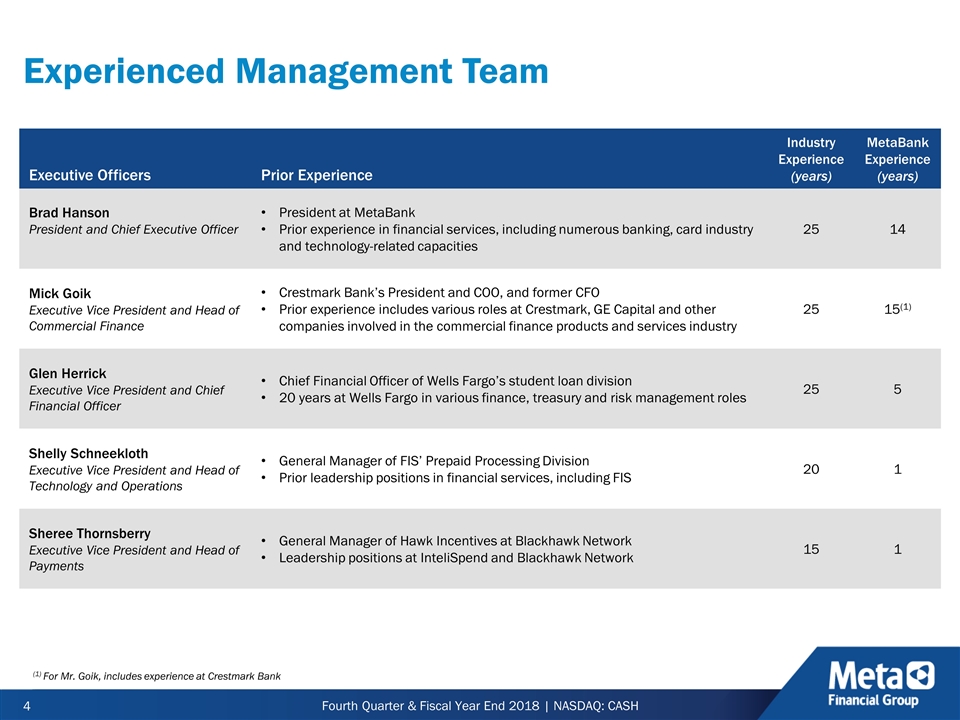
Experienced Management Team Executive Officers Prior Experience Industry Experience (years) MetaBank Experience (years) Brad Hanson President and Chief Executive Officer President at MetaBank Prior experience in financial services, including numerous banking, card industry and technology-related capacities 25 14 Mick Goik Executive Vice President and Head of Commercial Finance Crestmark Bank’s President and COO, and former CFO Prior experience includes various roles at Crestmark, GE Capital and other companies involved in the commercial finance products and services industry 25 15(1) Glen Herrick Executive Vice President and Chief Financial Officer Chief Financial Officer of Wells Fargo’s student loan division 20 years at Wells Fargo in various finance, treasury and risk management roles 25 5 Shelly Schneekloth Executive Vice President and Head of Technology and Operations General Manager of FIS’ Prepaid Processing Division Prior leadership positions in financial services, including FIS 20 1 Sheree Thornsberry Executive Vice President and Head of Payments General Manager of Hawk Incentives at Blackhawk Network Leadership positions at InteliSpend and Blackhawk Network 15 1 (1) For Mr. Goik, includes experience at Crestmark Bank
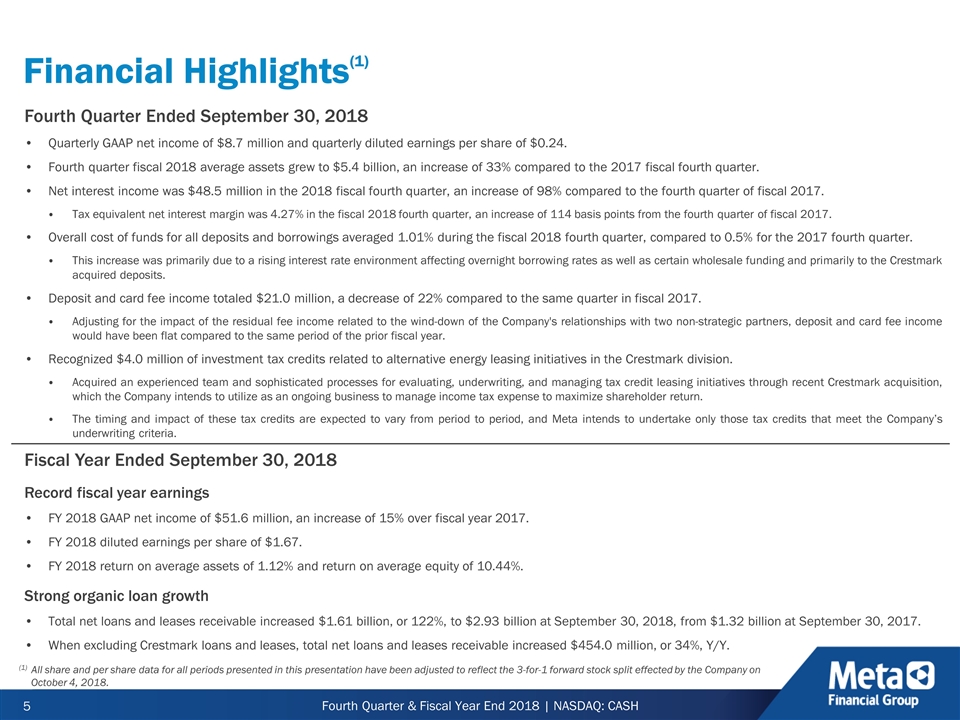
Fourth Quarter Ended September 30, 2018 Quarterly GAAP net income of $8.7 million and quarterly diluted earnings per share of $0.24. Fourth quarter fiscal 2018 average assets grew to $5.4 billion, an increase of 33% compared to the 2017 fiscal fourth quarter. Net interest income was $48.5 million in the 2018 fiscal fourth quarter, an increase of 98% compared to the fourth quarter of fiscal 2017. Tax equivalent net interest margin was 4.27% in the fiscal 2018 fourth quarter, an increase of 114 basis points from the fourth quarter of fiscal 2017. Overall cost of funds for all deposits and borrowings averaged 1.01% during the fiscal 2018 fourth quarter, compared to 0.5% for the 2017 fourth quarter. This increase was primarily due to a rising interest rate environment affecting overnight borrowing rates as well as certain wholesale funding and primarily to the Crestmark acquired deposits. Deposit and card fee income totaled $21.0 million, a decrease of 22% compared to the same quarter in fiscal 2017. Adjusting for the impact of the residual fee income related to the wind-down of the Company's relationships with two non-strategic partners, deposit and card fee income would have been flat compared to the same period of the prior fiscal year. Recognized $4.0 million of investment tax credits related to alternative energy leasing initiatives in the Crestmark division. Acquired an experienced team and sophisticated processes for evaluating, underwriting, and managing tax credit leasing initiatives through recent Crestmark acquisition, which the Company intends to utilize as an ongoing business to manage income tax expense to maximize shareholder return. The timing and impact of these tax credits are expected to vary from period to period, and Meta intends to undertake only those tax credits that meet the Company’s underwriting criteria. Fiscal Year Ended September 30, 2018 Record fiscal year earnings FY 2018 GAAP net income of $51.6 million, an increase of 15% over fiscal year 2017. FY 2018 diluted earnings per share of $1.67. FY 2018 return on average assets of 1.12% and return on average equity of 10.44%. Strong organic loan growth Total net loans and leases receivable increased $1.61 billion, or 122%, to $2.93 billion at September 30, 2018, from $1.32 billion at September 30, 2017. When excluding Crestmark loans and leases, total net loans and leases receivable increased $454.0 million, or 34%, Y/Y. Financial Highlights (1) (1) All share and per share data for all periods presented in this presentation have been adjusted to reflect the 3-for-1 forward stock split effected by the Company on October 4, 2018.
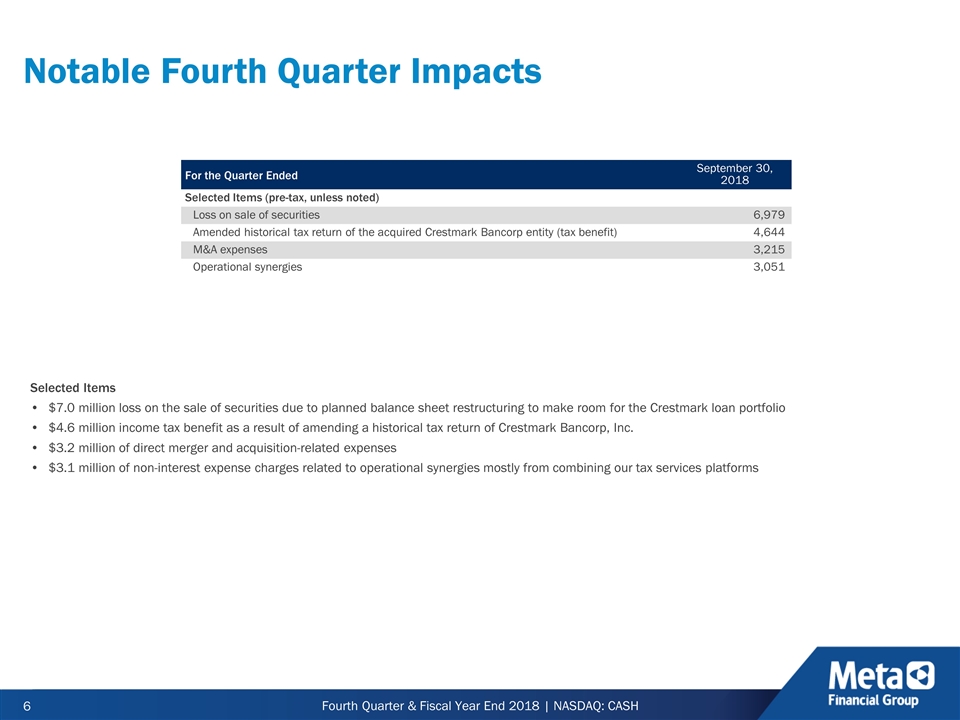
Notable Fourth Quarter Impacts For the Quarter Ended September 30, 2018 Selected Items (pre-tax, unless noted) Loss on sale of securities 6,979 Amended historical tax return of the acquired Crestmark Bancorp entity (tax benefit) 4,644 M&A expenses 3,215 Operational synergies 3,051 Selected Items $7.0 million loss on the sale of securities due to planned balance sheet restructuring to make room for the Crestmark loan portfolio $4.6 million income tax benefit as a result of amending a historical tax return of Crestmark Bancorp, Inc. $3.2 million of direct merger and acquisition-related expenses $3.1 million of non-interest expense charges related to operational synergies mostly from combining our tax services platforms
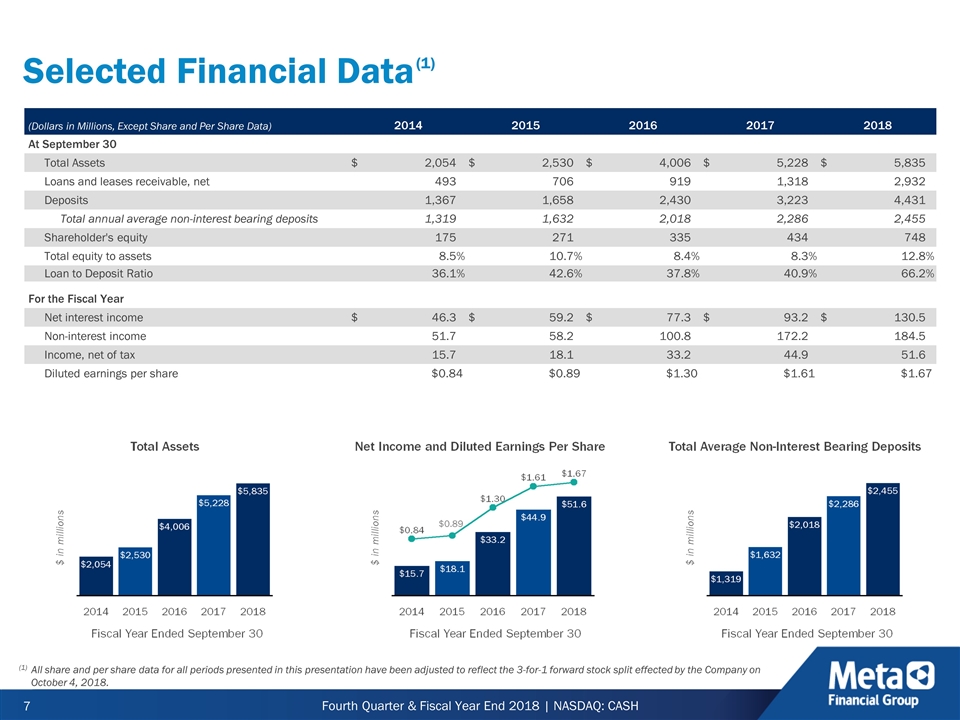
Selected Financial Data (Dollars in Millions, Except Share and Per Share Data) 2014 2014 2015 2015 2016 2016 2017 2017 2018 2018 At September 30 Total Assets $ 2,054 $ 2,530 $ 4,006 $ 5,228 $ 5,835 Loans and leases receivable, net 493 706 919 1,318 2,932 Deposits 1,367 1,658 2,430 3,223 4,431 Total annual average non-interest bearing deposits 1,319 1,632 2,018 2,286 2,455 Shareholder's equity 175 271 335 434 748 Total equity to assets 8.5 % 10.7 % 8.4 % 8.3 % 12.8 % Loan to Deposit Ratio 36.1 % 42.6 % 37.8 % 40.9 % 66.2 % For the Fiscal Year Net interest income $ 46.3 $ 59.2 $ 77.3 $ 93.2 $ 130.5 Non-interest income 51.7 58.2 100.8 172.2 184.5 Income, net of tax 15.7 18.1 33.2 44.9 51.6 Diluted earnings per share $0.84 $0.84 $0.89 $0.89 $1.30 $1.30 $1.61 $1.61 $1.67 $1.67 (1) (1) All share and per share data for all periods presented in this presentation have been adjusted to reflect the 3-for-1 forward stock split effected by the Company on October 4, 2018. $0.89
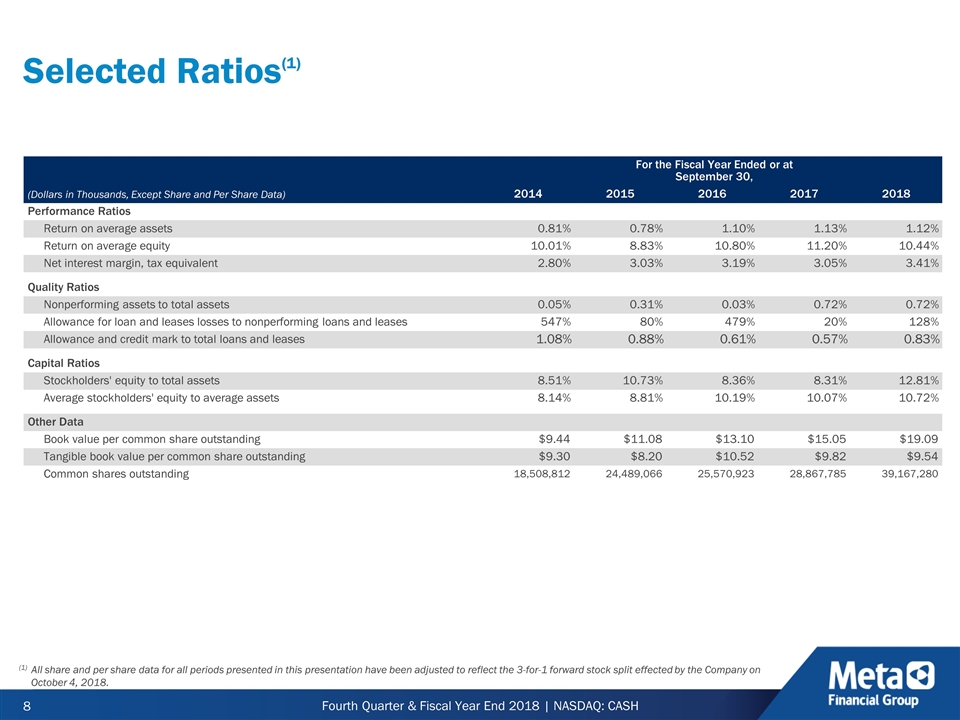
Selected Ratios For the Fiscal Year Ended or at September 30, (Dollars in Thousands, Except Share and Per Share Data) 2014 2015 2016 2017 2018 Performance Ratios Return on average assets 0.81 % 0.78 % 1.10 % 1.13 % 1.12 % Return on average equity 10.01 % 8.83 % 10.80 % 11.20 % 10.44 % Net interest margin, tax equivalent 2.80 % 3.03 % 3.19 % 3.05 % 3.41 % Quality Ratios Nonperforming assets to total assets 0.05 % 0.31 % 0.03 % 0.72 % 0.72 % Allowance for loan and leases losses to nonperforming loans and leases 547 % 80 % 479 % 20 % 128 % Allowance and credit mark to total loans and leases 1.08 % 0.88 % 0.61 % 0.57 % 0.83 % Capital Ratios Stockholders' equity to total assets 8.51 % 10.73 % 8.36 % 8.31 % 12.81 % Average stockholders' equity to average assets 8.14 % 8.81 % 10.19 % 10.07 % 10.72 % Other Data Book value per common share outstanding $9.44 $11.08 $13.10 $15.05 $19.09 Tangible book value per common share outstanding $9.30 $8.20 $10.52 $9.82 $9.54 Common shares outstanding 18,508,812 24,489,066 25,570,923 28,867,785 39,167,280 (1) (1) All share and per share data for all periods presented in this presentation have been adjusted to reflect the 3-for-1 forward stock split effected by the Company on October 4, 2018.
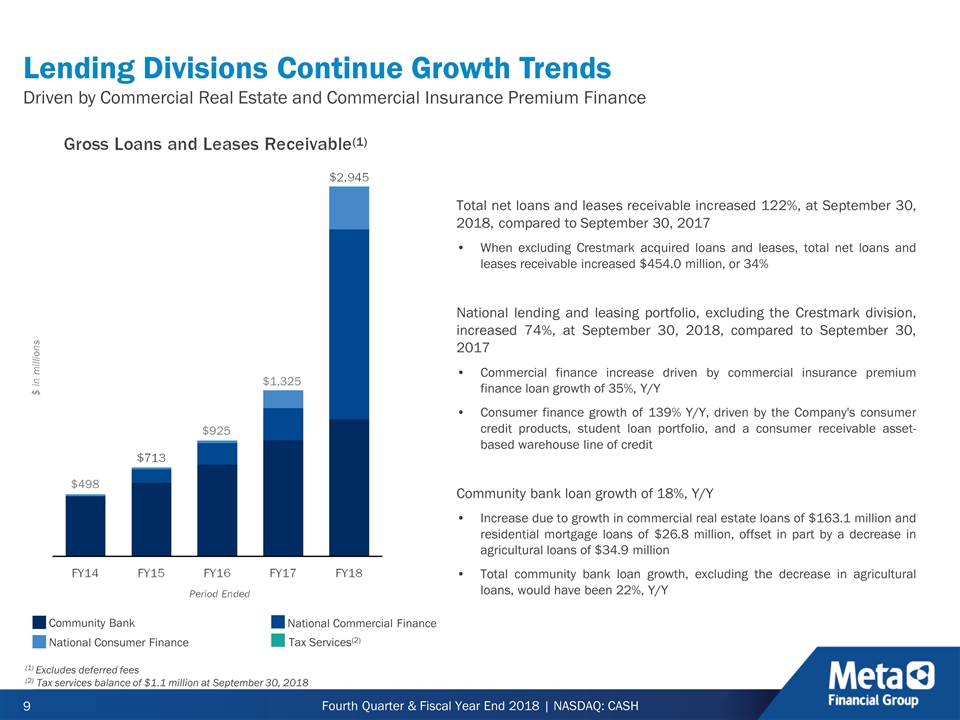
Lending Divisions Continue Growth Trends Driven by Commercial Real Estate and Commercial Insurance Premium Finance Total net loans and leases receivable increased 122%, at September 30, 2018, compared to September 30, 2017 When excluding Crestmark acquired loans and leases, total net loans and leases receivable increased $454.0 million, or 34% National lending and leasing portfolio, excluding the Crestmark division, increased 74%, at September 30, 2018, compared to September 30, 2017 Commercial finance increase driven by commercial insurance premium finance loan growth of 35%, Y/Y Consumer finance growth of 139% Y/Y, driven by the Company's consumer credit products, student loan portfolio, and a consumer receivable asset-based warehouse line of credit Community bank loan growth of 18%, Y/Y Increase due to growth in commercial real estate loans of $163.1 million and residential mortgage loans of $26.8 million, offset in part by a decrease in agricultural loans of $34.9 million Total community bank loan growth, excluding the decrease in agricultural loans, would have been 22%, Y/Y (1) Community Bank Tax Services(2) National Commercial Finance National Consumer Finance (1) Excludes deferred fees (2) Tax services balance of $1.1 million at September 30, 2018 $498 $925 $1,325
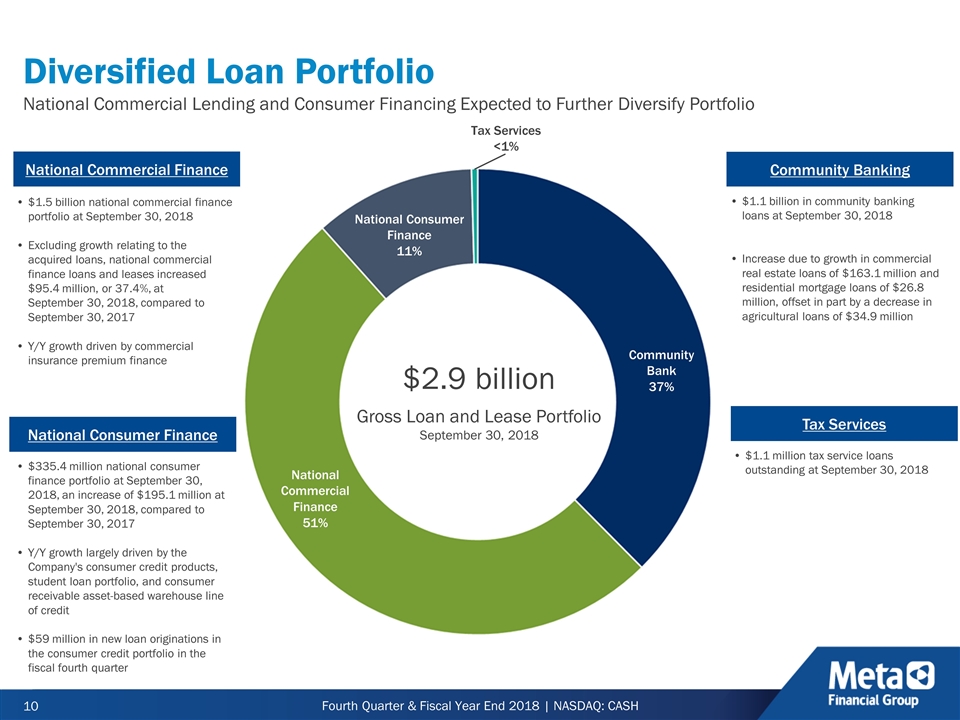
Diversified Loan Portfolio National Commercial Lending and Consumer Financing Expected to Further Diversify Portfolio National Commercial Finance 51% Community Bank 37% Community Banking $1.1 billion in community banking loans at September 30, 2018 Increase due to growth in commercial real estate loans of $163.1 million and residential mortgage loans of $26.8 million, offset in part by a decrease in agricultural loans of $34.9 million $1.5 billion national commercial finance portfolio at September 30, 2018 Excluding growth relating to the acquired loans, national commercial finance loans and leases increased $95.4 million, or 37.4%, at September 30, 2018, compared to September 30, 2017 Y/Y growth driven by commercial insurance premium finance National Commercial Finance National Consumer Finance Tax Services National Consumer Finance 11% $335.4 million national consumer finance portfolio at September 30, 2018, an increase of $195.1 million at September 30, 2018, compared to September 30, 2017 Y/Y growth largely driven by the Company's consumer credit products, student loan portfolio, and consumer receivable asset-based warehouse line of credit $59 million in new loan originations in the consumer credit portfolio in the fiscal fourth quarter $1.1 million tax service loans outstanding at September 30, 2018 $2.9 billion Gross Loan and Lease Portfolio September 30, 2018 Tax Services <1%
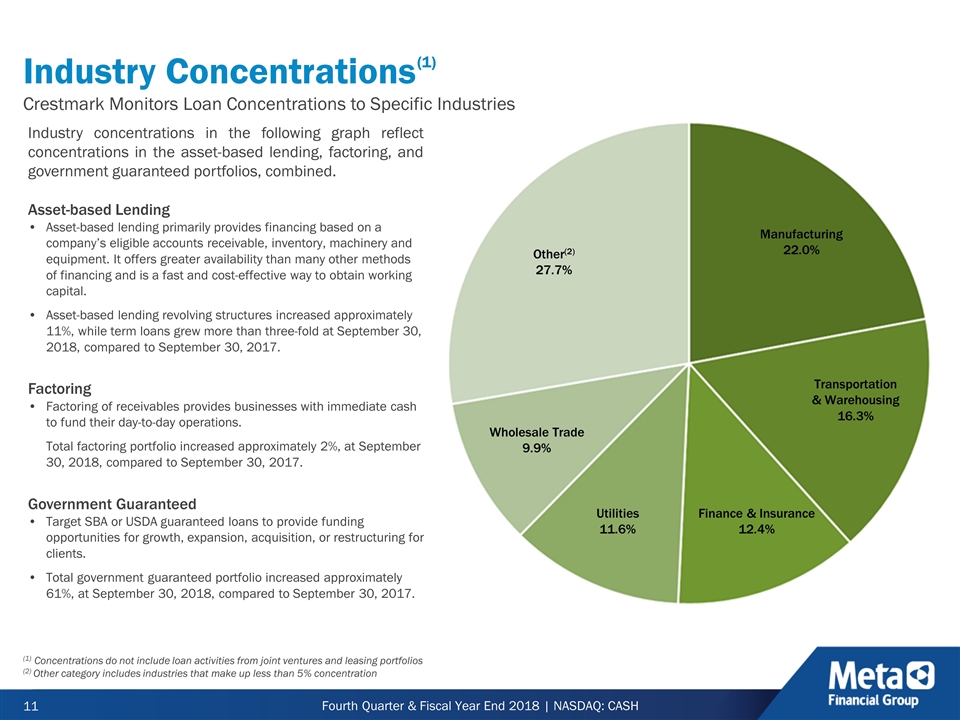
Industry Concentrations Crestmark Monitors Loan Concentrations to Specific Industries Industry concentrations in the following graph reflect concentrations in the asset-based lending, factoring, and government guaranteed portfolios, combined. Asset-based Lending Asset-based lending primarily provides financing based on a company’s eligible accounts receivable, inventory, machinery and equipment. It offers greater availability than many other methods of financing and is a fast and cost-effective way to obtain working capital. Asset-based lending revolving structures increased approximately 11%, while term loans grew more than three-fold at September 30, 2018, compared to September 30, 2017. Factoring Factoring of receivables provides businesses with immediate cash to fund their day-to-day operations. Total factoring portfolio increased approximately 2%, at September 30, 2018, compared to September 30, 2017. Government Guaranteed Target SBA or USDA guaranteed loans to provide funding opportunities for growth, expansion, acquisition, or restructuring for clients. Total government guaranteed portfolio increased approximately 61%, at September 30, 2018, compared to September 30, 2017. Other(2) 27.7% Manufacturing 22.0% Transportation & Warehousing 16.3% Finance & Insurance 12.4% Wholesale Trade 9.9% (1) Concentrations do not include loan activities from joint ventures and leasing portfolios (2) Other category includes industries that make up less than 5% concentration Utilities 11.6% (1)
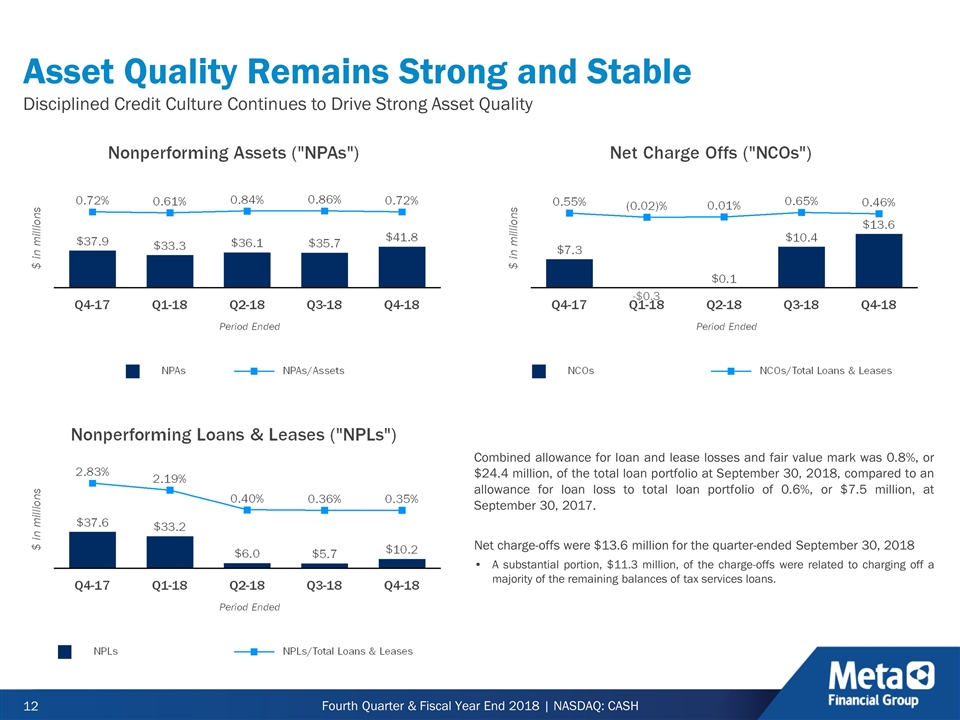
Asset Quality Remains Strong and Stable Disciplined Credit Culture Continues to Drive Strong Asset Quality Combined allowance for loan and lease losses and fair value mark was 0.8%, or $24.4 million, of the total loan portfolio at September 30, 2018, compared to an allowance for loan loss to total loan portfolio of 0.6%, or $7.5 million, at September 30, 2017. Net charge-offs were $13.6 million for the quarter-ended September 30, 2018 A substantial portion, $11.3 million, of the charge-offs were related to charging off a majority of the remaining balances of tax services loans. -$0.3
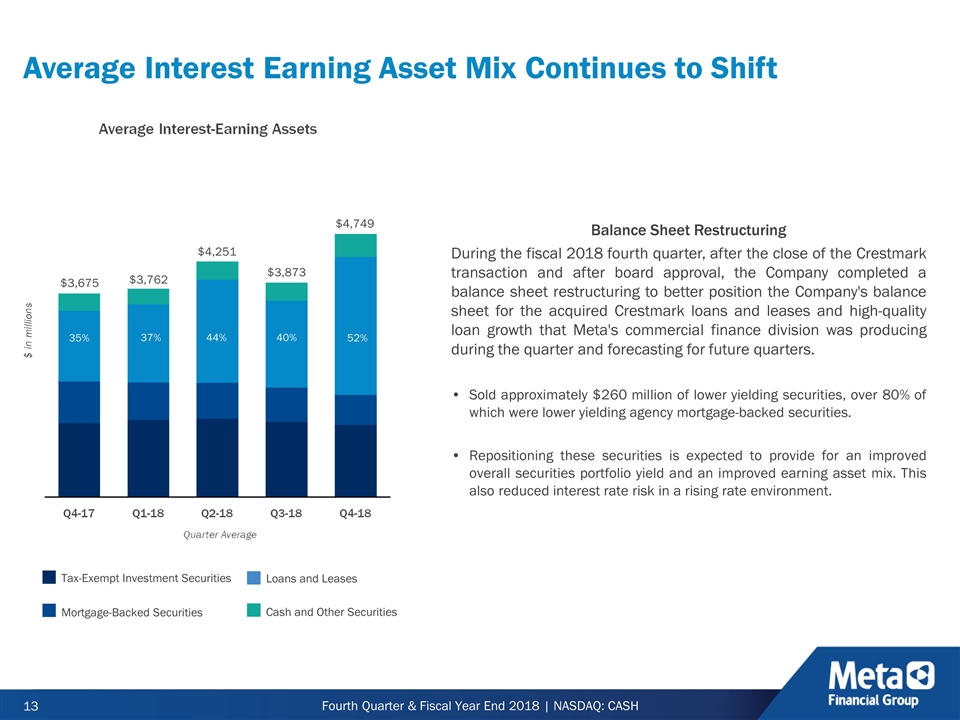
Average Interest Earning Asset Mix Continues to Shift $4,749 $3,675 $3,873 $4,251 $3,762 52% 35% 37% 44% 40% Tax-Exempt Investment Securities Mortgage-Backed Securities Loans and Leases Cash and Other Securities Balance Sheet Restructuring During the fiscal 2018 fourth quarter, after the close of the Crestmark transaction and after board approval, the Company completed a balance sheet restructuring to better position the Company's balance sheet for the acquired Crestmark loans and leases and high-quality loan growth that Meta's commercial finance division was producing during the quarter and forecasting for future quarters. Sold approximately $260 million of lower yielding securities, over 80% of which were lower yielding agency mortgage-backed securities. Repositioning these securities is expected to provide for an improved overall securities portfolio yield and an improved earning asset mix. This also reduced interest rate risk in a rising rate environment.
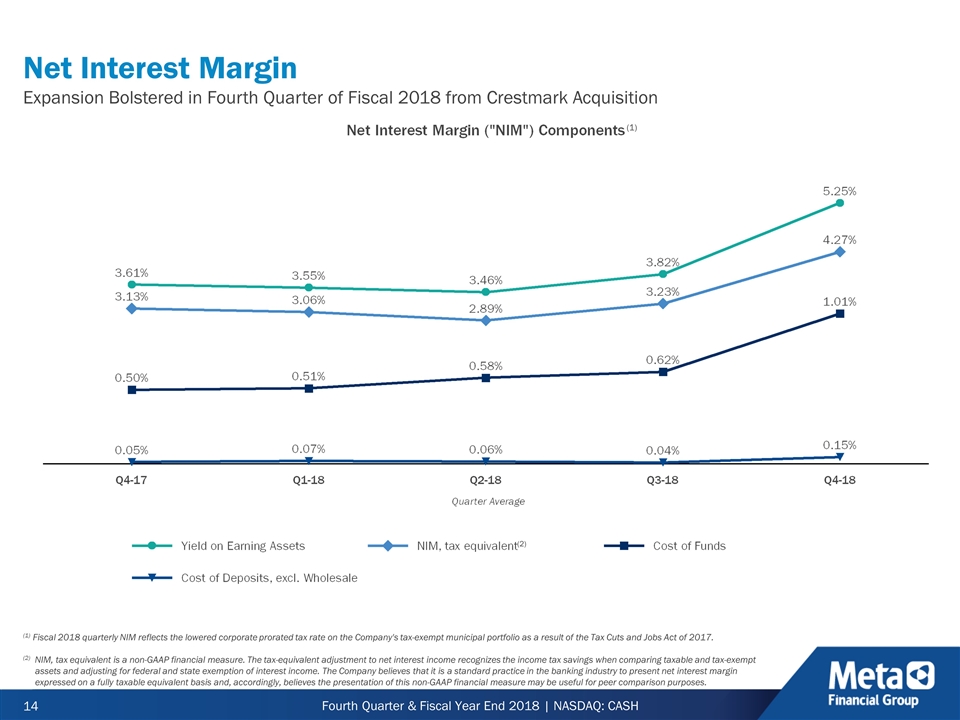
Net Interest Margin Expansion Bolstered in Fourth Quarter of Fiscal 2018 from Crestmark Acquisition (1) Fiscal 2018 quarterly NIM reflects the lowered corporate prorated tax rate on the Company's tax-exempt municipal portfolio as a result of the Tax Cuts and Jobs Act of 2017. (2) NIM, tax equivalent is a non-GAAP financial measure. The tax-equivalent adjustment to net interest income recognizes the income tax savings when comparing taxable and tax-exempt assets and adjusting for federal and state exemption of interest income. The Company believes that it is a standard practice in the banking industry to present net interest margin expressed on a fully taxable equivalent basis and, accordingly, believes the presentation of this non-GAAP financial measure may be useful for peer comparison purposes. (2) (1)
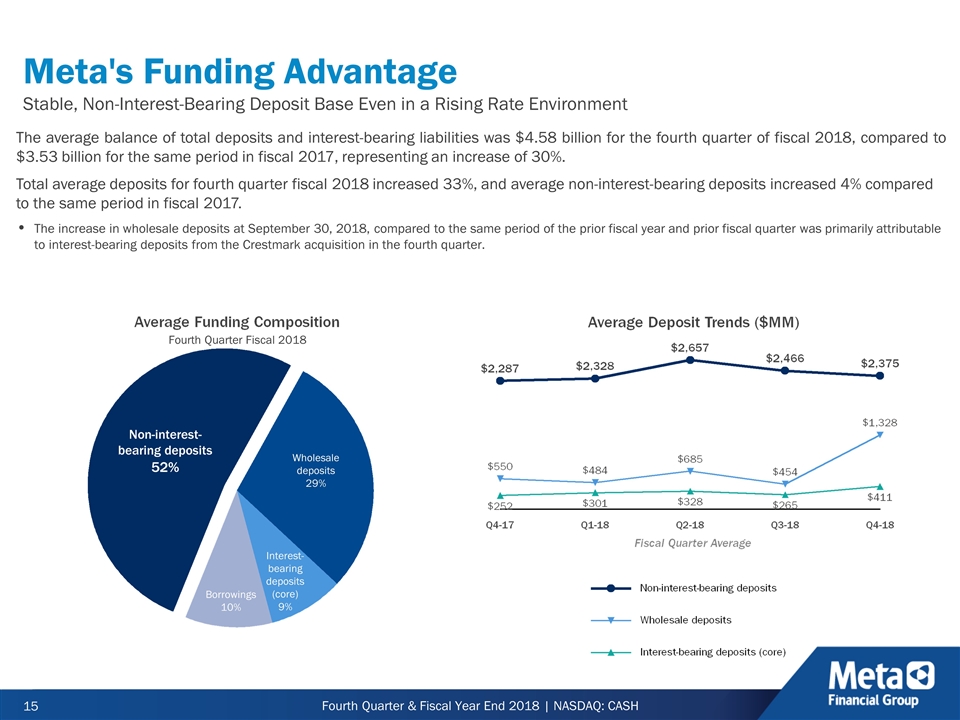
The average balance of total deposits and interest-bearing liabilities was $4.58 billion for the fourth quarter of fiscal 2018, compared to $3.53 billion for the same period in fiscal 2017, representing an increase of 30%. Total average deposits for fourth quarter fiscal 2018 increased 33%, and average non-interest-bearing deposits increased 4% compared to the same period in fiscal 2017. The increase in wholesale deposits at September 30, 2018, compared to the same period of the prior fiscal year and prior fiscal quarter was primarily attributable to interest-bearing deposits from the Crestmark acquisition in the fourth quarter. Wholesale deposits 29% Interest-bearing deposits (core) 9% Non-interest-bearing deposits 52% Borrowings 10% Meta's Funding Advantage Stable, Non-Interest-Bearing Deposit Base Even in a Rising Rate Environment Fourth Quarter Fiscal 2018
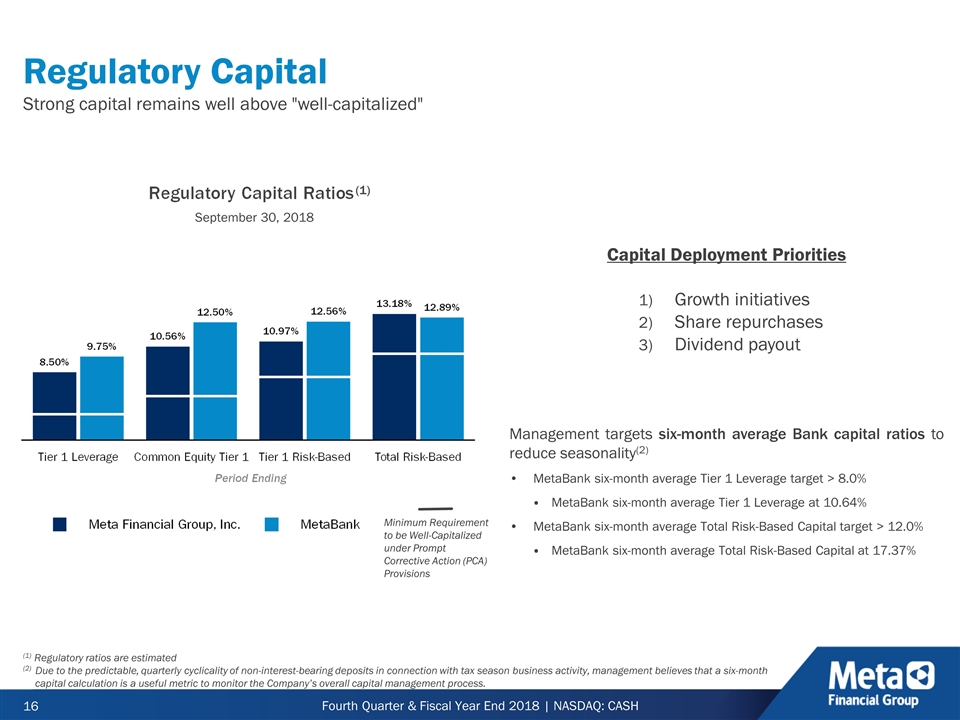
Regulatory Capital Strong capital remains well above "well-capitalized" (1) Regulatory ratios are estimated (2) Due to the predictable, quarterly cyclicality of non-interest-bearing deposits in connection with tax season business activity, management believes that a six-month capital calculation is a useful metric to monitor the Company’s overall capital management process. Management targets six-month average Bank capital ratios to reduce seasonality(2) MetaBank six-month average Tier 1 Leverage target > 8.0% MetaBank six-month average Tier 1 Leverage at 10.64% MetaBank six-month average Total Risk-Based Capital target > 12.0% MetaBank six-month average Total Risk-Based Capital at 17.37% Capital Deployment Priorities Growth initiatives Share repurchases Dividend payout Minimum Requirement to be Well-Capitalized under Prompt Corrective Action (PCA) Provisions (1) September 30, 2018
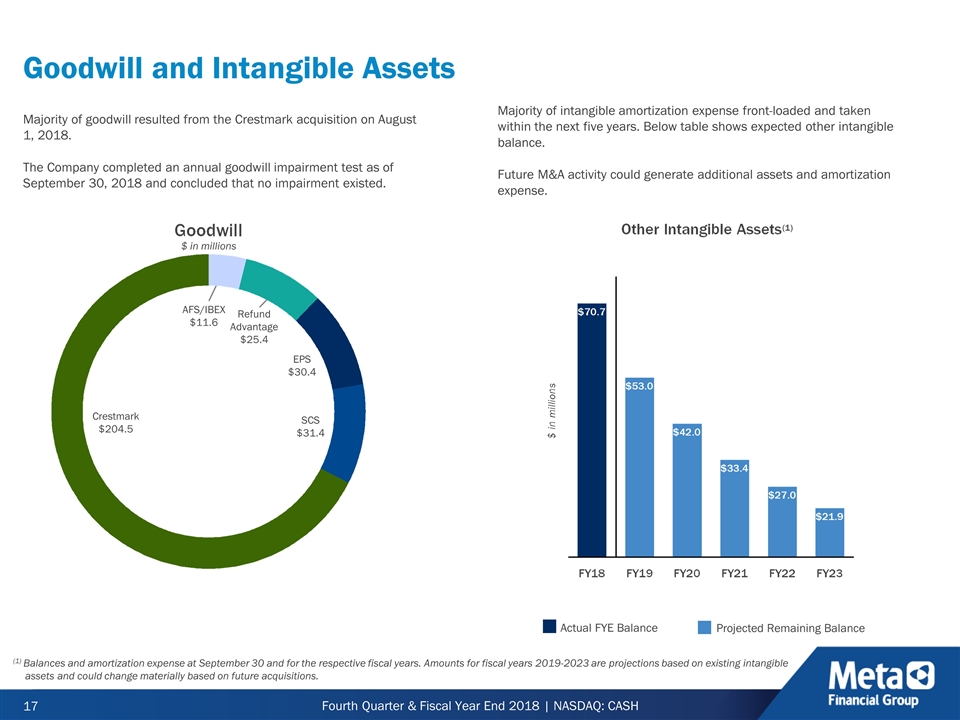
Majority of intangible amortization expense front-loaded and taken within the next five years. Below table shows expected other intangible balance. Future M&A activity could generate additional assets and amortization expense. Majority of goodwill resulted from the Crestmark acquisition on August 1, 2018. The Company completed an annual goodwill impairment test as of September 30, 2018 and concluded that no impairment existed. Goodwill and Intangible Assets Actual FYE Balance Projected Remaining Balance (1) Balances and amortization expense at September 30 and for the respective fiscal years. Amounts for fiscal years 2019-2023 are projections based on existing intangible assets and could change materially based on future acquisitions. (1) Crestmark $204.5 AFS/IBEX $11.6 Refund Advantage $25.4 EPS $30.4 SCS $31.4 $ in millions

Appendix
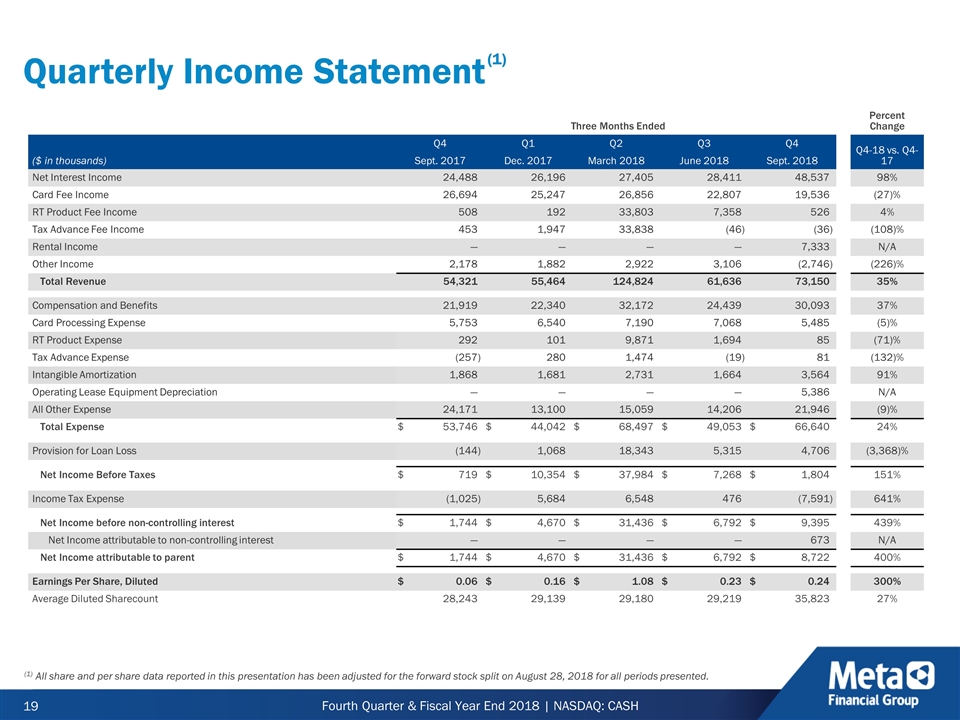
Quarterly Income Statement Three Months Ended Three Months Ended Percent Change Q4 Q4 Q1 Q1 Q2 Q2 Q3 Q3 Q4 Q4 Q4-18 vs. Q4-17 ($ in thousands) Sept. 2017 Sept. 2017 Dec. 2017 Dec. 2017 March 2018 March 2018 June 2018 June 2018 Sept. 2018 Sept. 2018 Net Interest Income 24,488 26,196 27,405 28,411 48,537 98% Card Fee Income 26,694 25,247 26,856 22,807 19,536 (27)% RT Product Fee Income 508 192 33,803 7,358 526 4% Tax Advance Fee Income 453 1,947 33,838 (46 ) (36 ) (108)% Rental Income — — — — 7,333 N/A Other Income 2,178 1,882 2,922 3,106 (2,746 ) (226)% Total Revenue 54,321 55,464 124,824 61,636 73,150 35% Compensation and Benefits 21,919 22,340 32,172 24,439 30,093 37% Card Processing Expense 5,753 6,540 7,190 7,068 5,485 (5)% RT Product Expense 292 101 9,871 1,694 85 (71)% Tax Advance Expense (257 ) 280 1,474 (19 ) 81 (132)% Intangible Amortization 1,868 1,681 2,731 1,664 3,564 91% Operating Lease Equipment Depreciation — — — — 5,386 N/A All Other Expense 24,171 13,100 15,059 14,206 21,946 (9)% Total Expense $ 53,746 $ 44,042 $ 68,497 $ 49,053 $ 66,640 24% Provision for Loan Loss (144 ) 1,068 18,343 5,315 4,706 (3,368)% Net Income Before Taxes $ 719 $ 10,354 $ 37,984 $ 7,268 $ 1,804 151% Income Tax Expense (1,025 ) 5,684 6,548 476 (7,591 ) 641% Net Income before non-controlling interest $ 1,744 $ 4,670 $ 31,436 $ 6,792 $ 9,395 439% Net Income attributable to non-controlling interest — — — — 673 N/A Net Income attributable to parent $ 1,744 $ 4,670 $ 31,436 $ 6,792 $ 8,722 400% Earnings Per Share, Diluted $ 0.06 $ 0.16 $ 1.08 $ 0.23 $ 0.24 300% Average Diluted Sharecount 28,243 29,139 29,180 29,219 35,823 27% (1) All share and per share data reported in this presentation has been adjusted for the forward stock split on August 28, 2018 for all periods presented. (1)
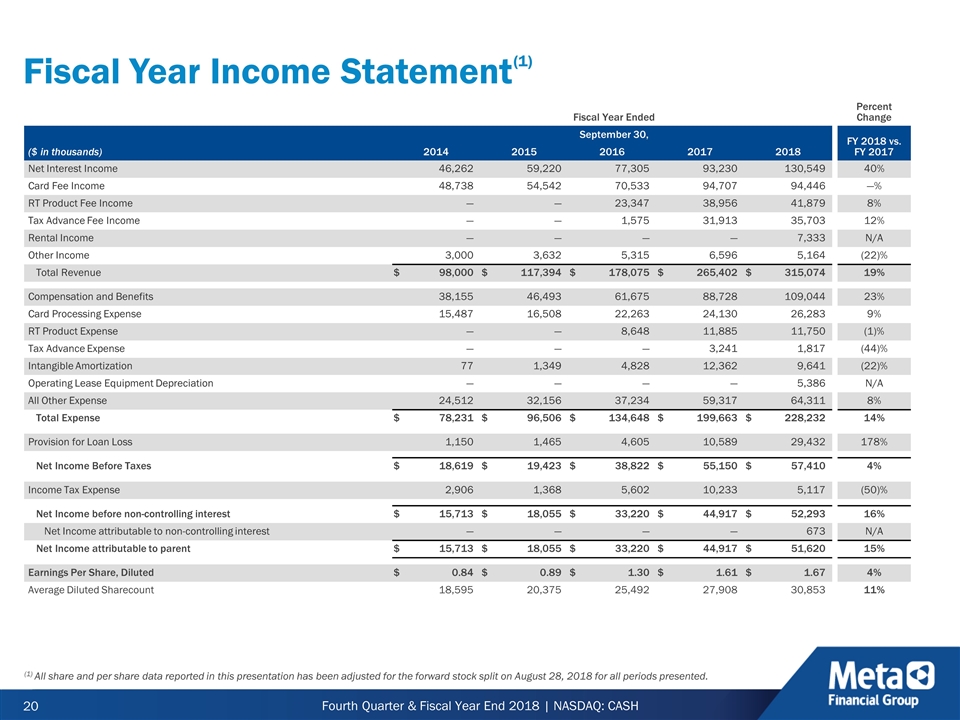
Fiscal Year Income Statement Fiscal Year Ended Fiscal Year Ended Percent Change September 30, September 30, FY 2018 vs. FY 2017 ($ in thousands) 2014 2014 2015 2015 2016 2016 2017 2017 2018 2018 Net Interest Income 46,262 59,220 77,305 93,230 130,549 40% Card Fee Income 48,738 54,542 70,533 94,707 94,446 —% RT Product Fee Income — — 23,347 38,956 41,879 8% Tax Advance Fee Income — — 1,575 31,913 35,703 12% Rental Income — — — — 7,333 N/A Other Income 3,000 3,632 5,315 6,596 5,164 (22)% Total Revenue $ 98,000 $ 117,394 $ 178,075 $ 265,402 $ 315,074 19% Compensation and Benefits 38,155 46,493 61,675 88,728 109,044 23% Card Processing Expense 15,487 16,508 22,263 24,130 26,283 9% RT Product Expense — — 8,648 11,885 11,750 (1)% Tax Advance Expense — — — 3,241 1,817 (44)% Intangible Amortization 77 1,349 4,828 12,362 9,641 (22)% Operating Lease Equipment Depreciation — — — — 5,386 N/A All Other Expense 24,512 32,156 37,234 59,317 64,311 8% Total Expense $ 78,231 $ 96,506 $ 134,648 $ 199,663 $ 228,232 14% Provision for Loan Loss 1,150 1,465 4,605 10,589 29,432 178% Net Income Before Taxes $ 18,619 $ 19,423 $ 38,822 $ 55,150 $ 57,410 4% Income Tax Expense 2,906 1,368 5,602 10,233 5,117 (50)% Net Income before non-controlling interest $ 15,713 $ 18,055 $ 33,220 $ 44,917 $ 52,293 16% Net Income attributable to non-controlling interest — — — — 673 N/A Net Income attributable to parent $ 15,713 $ 18,055 $ 33,220 $ 44,917 $ 51,620 15% Earnings Per Share, Diluted $ 0.84 $ 0.89 $ 1.30 $ 1.61 $ 1.67 4% Average Diluted Sharecount 18,595 20,375 25,492 27,908 30,853 11% (1) All share and per share data reported in this presentation has been adjusted for the forward stock split on August 28, 2018 for all periods presented. (1)
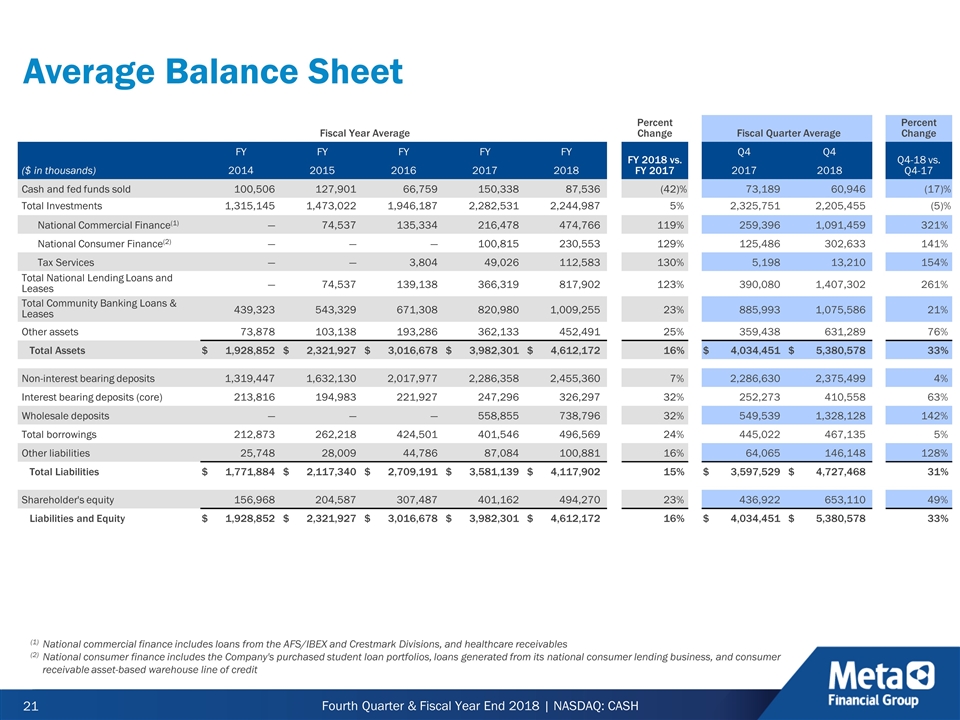
Average Balance Sheet Fiscal Year Average Fiscal Year Average Percent Change Fiscal Quarter Average Fiscal Quarter Average Percent Change FY FY FY FY FY FY FY FY FY FY FY 2018 vs. FY 2017 Q4 Q4 Q4 Q4 Q4-18 vs. Q4-17 ($ in thousands) 2014 2014 2015 2015 2016 2016 2017 2017 2018 2018 2017 2017 2018 2018 Cash and fed funds sold 100,506 127,901 66,759 150,338 87,536 (42 )% 73,189 60,946 (17 )% Total Investments 1,315,145 1,473,022 1,946,187 2,282,531 2,244,987 5 % 2,325,751 2,205,455 (5 )% National Commercial Finance(1) — 74,537 135,334 216,478 474,766 119 % 259,396 1,091,459 321 % National Consumer Finance(2) — — — 100,815 230,553 129 % 125,486 302,633 141 % Tax Services — — 3,804 49,026 112,583 130 % 5,198 13,210 154 % Total National Lending Loans and Leases — 74,537 139,138 366,319 817,902 123 % 390,080 1,407,302 261 % Total Community Banking Loans & Leases 439,323 543,329 671,308 820,980 1,009,255 23 % 885,993 1,075,586 21 % Other assets 73,878 103,138 193,286 362,133 452,491 25 % 359,438 631,289 76 % Total Assets $ 1,928,852 $ 2,321,927 $ 3,016,678 $ 3,982,301 $ 4,612,172 16 % $ 4,034,451 $ 5,380,578 33 % Non-interest bearing deposits 1,319,447 1,632,130 2,017,977 2,286,358 2,455,360 7 % 2,286,630 2,375,499 4 % Interest bearing deposits (core) 213,816 194,983 221,927 247,296 326,297 32 % 252,273 410,558 63 % Wholesale deposits — — — 558,855 738,796 32 % 549,539 1,328,128 142 % Total borrowings 212,873 262,218 424,501 401,546 496,569 24 % 445,022 467,135 5 % Other liabilities 25,748 28,009 44,786 87,084 100,881 16 % 64,065 146,148 128 % Total Liabilities $ 1,771,884 $ 2,117,340 $ 2,709,191 $ 3,581,139 $ 4,117,902 15 % $ 3,597,529 $ 4,727,468 31 % Shareholder's equity 156,968 204,587 307,487 401,162 494,270 23 % 436,922 653,110 49 % Liabilities and Equity $ 1,928,852 $ 2,321,927 $ 3,016,678 $ 3,982,301 $ 4,612,172 16 % $ 4,034,451 $ 5,380,578 33 % (1) National commercial finance includes loans from the AFS/IBEX and Crestmark Divisions, and healthcare receivables (2) National consumer finance includes the Company's purchased student loan portfolios, loans generated from its national consumer lending business, and consumer receivable asset-based warehouse line of credit
