Attached files
| file | filename |
|---|---|
| EX-99.2 - EX-99.2 - COMMVAULT SYSTEMS INC | q219exhibit992.htm |
| EX-99.1 - EX-99.1 - COMMVAULT SYSTEMS INC | q2fy2019pressrelease.htm |
| 8-K - 8-K - COMMVAULT SYSTEMS INC | q219-8k.htm |

Commvault Advance Update Bob Hammer, CEO | Brian Carolan, CFO

Disclaimer This presentation may contain forward-looking statements, including statements regarding financial projections, which are subject to risks and uncertainties, such as competitive factors, difficulties and delays inherent in the development, manufacturing, marketing and sale of software products and related services, general economic conditions, outcome of litigation and others. For a discussion of these and other risks and uncertainties affecting Commvault's business, see "Item IA. Risk Factors" in our annual report in Form 10-K and "Item 1A. Risk Factors" in our most recent quarter report in Form 10-Q. Statements regarding Commvault’s beliefs, plans, expectations or intentions regarding the future are forward-looking statements, within the meaning of Section 27A of the Securities Act of 1933, as amended and Section 21E of the Securities Exchange Act of 1934, as amended. All such forward-looking statements are made pursuant to the safe harbor provisions of the Private Securities Litigation Reform Act of 1995. Actual results may differ materially from anticipated results. Commvault does not undertake to update its forward-looking statements. The development and timing of any product release as well as any of its features or functionality remain at our sole discretion. 2

Commvault® Advance A plan for sustainable, long term growth and profitability Transform the Establish the Achieve Core Business: 25%+ Foundation for Predictable, Operating Margins Accelerating Growth Sustainable Growth in FY’21 3

Business model optimization Driving shareholder value Simplified Product & Pricing Channel Leverage Drives Shareholder Subscription Revenue Model Transition Value Aligning Cost Structure with Revenue Growth 4

Simplified Product & Pricing Best-in-class product strategy – Portfolio simplification SKU consolidation drives simplification and platform unification 20+ to20+ 6 to 6 1 to 1 5 to 1 5 to 1 4 to 1 4 to 1 BACKUP INFRASTRUCTURE COPY DATA CONTENT AND RECOVERY MANAGEMENT INDEXING The recognized leading solution for On-premises scale- Provision, sync and Extract data insights backup and recovery, no matter where out backup and validate data in any for better business your data is. recovery – delivered environment outcomes. as a converged for important IT Commvault appliance needs such as DR or through our testing, Dev/Test, trusted network of and/or Workload partners. Migration. COMPLETE CAN BE EXTENDED to address customer scale and complexity challenges 5

Channel Leverage Business model optimization – Sales reorganization Historical Current FY’20/21 Direction Key Accounts Direct Direct ENT Account Led Led Direct Executive ENT Territory Manager Channel Driven Channel Driven Commvault Inside Sales Rep Commvault Supported Supported Indirect Routes Indirect Routes Partner Indirect Routes Support & Management Support & Management Focused Support & Management Roles Roles Roles 6

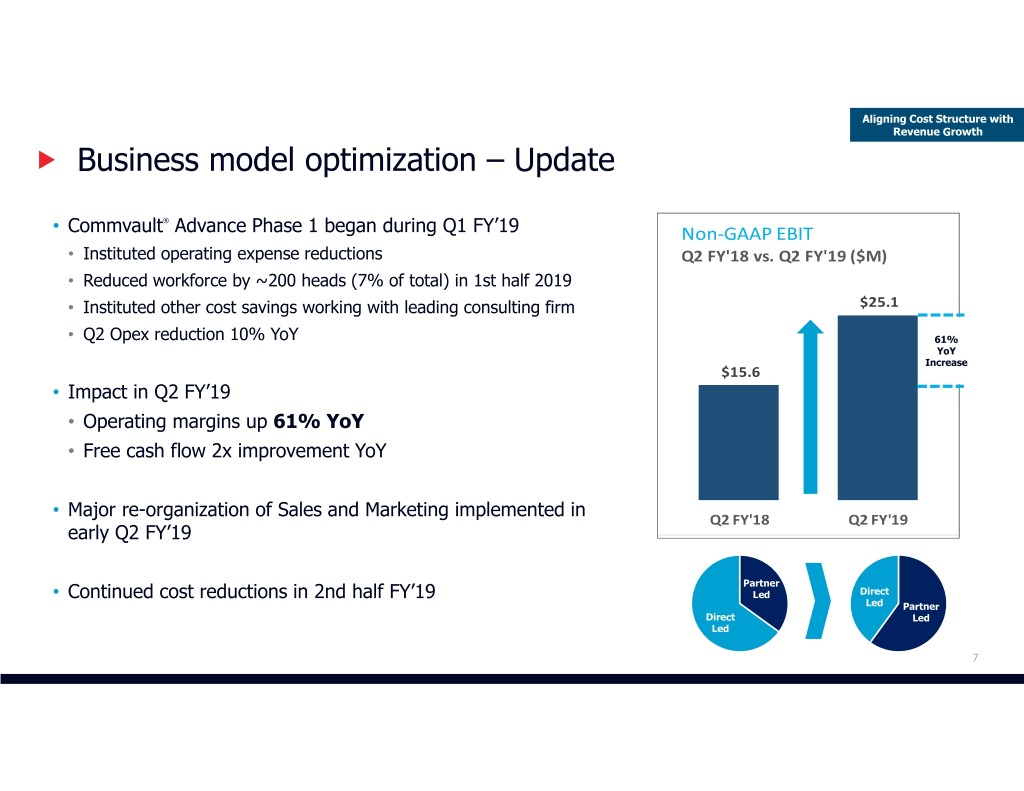
Aligning Cost Structure with Revenue Growth Business model optimization – Update ® • Commvault Advance Phase 1 began during Q1 FY’19 Non‐GAAP EBIT • Instituted operating expense reductions Q2 FY'18 vs. Q2 FY'19 ($M) • Reduced workforce by ~200 heads (7% of total) in 1st half 2019 $25.1 • Instituted other cost savings working with leading consulting firm • Q2 Opex reduction 10% YoY 61% YoY Increase0 $15.6 • Impact in Q2 FY’19 • Operating margins up 61% YoY • Free cash flow 2x improvement YoY • Major re-organization of Sales and Marketing implemented in early Q2 FY’19 Q2 FY'18 Q2 FY'19 Partner • Continued cost reductions in 2nd half FY’19 Led Direct Led Partner Direct Led Led 7

Brian Carolan, CFO

Subscription Revenue Model Transition Revenue model transition – Transition to repeatable revenue streams P&L Recognition Impact Upfront/Point in Time Ratably Over Time Repeatable Subscription Software Maintenance Contracts • Generally three year committed contracts • Generally annual contracts • Includes appliance offerings • Vast majority of services revenue ~70% • Not hosted of Revenue Utility Software • “Pay As You Go” based on quarterly usage Perpetual Software Non-Repeatable • Historically the vast majority of software and product revenue ~30% Professional Services of Revenue • Primarily consulting and implementation services 9

Subscription Revenue Model Transition Transition to repeatable subscription models – Benefits customers and Commvault® CUSTOMER BENEFITS COMMVAULT BENEFITS • Simplifies the procurement process • Facilitates new customer acquisition • Lower up-front commitment • Increases the lifetime value of a customer • Aligns with move to the cloud • Drives predictable and repeatable revenue given 90%+ historical support renewal rates • Flexibility to change environment over time based on changes to customer/technology • Aligns with our customer success model 10

Subscription Revenue Model Transition Transition to repeatable subscription models – Perpetual vs. Subscription license comparison - recognized revenue ($ in 000’s) • Headwind to first year Software and Support recognized revenue but greater lifetime value • Crossover to accretive value upon the first renewal Cumulative Year 1 Year 2 Year 3 Year 4 Year 5 Year 6 3 Year 6 Year Perpetual Licenses & Maintenance: Software and Products Revenue $ 245 $ ‐ $ ‐ $ ‐ $ ‐ $ ‐ Customer Support Revenue 45 45 45 45 45 45 Total Revenue $ 290 $ 45 $ 45 $ 45 $ 45 $ 45 $ 380 $ 515 Cumulative Revenue $ 290 $ 335 $ 380 $ 425 $ 470 $ 515 Subscription Licenses; paid annually or upfront: Annual Contract Value $ 100 $ 100 $ 100 $ 100 $ 100 $ 100 Software and Products Revenue $ 195 $ ‐ $ ‐ $ 195 $ ‐ $ ‐ Customer Support Revenue 35 35 35 35 35 35 Total Revenue $ 230 $ 35 $ 35 $ 230 $ 35 $ 35 $ 300 $ 600 Cumulative Revenue $ 230 $ 265 $ 300 $ 530 $ 565 $ 600 3 Year Cumulative Revenue Comparison ‐21% 6 Year Cumulative Revenue Comparison 17% 11

Subscription Revenue Model Transition Two new financial metrics Introducing two new metrics to supplement our reported results Repeatable Subscription and vs. Utility Annual Non-Repeatable Revenue Contract Value (ACV) Will provide additional insight into the progress we are making in our revenue model transition to a repeatable/subscription based model 12

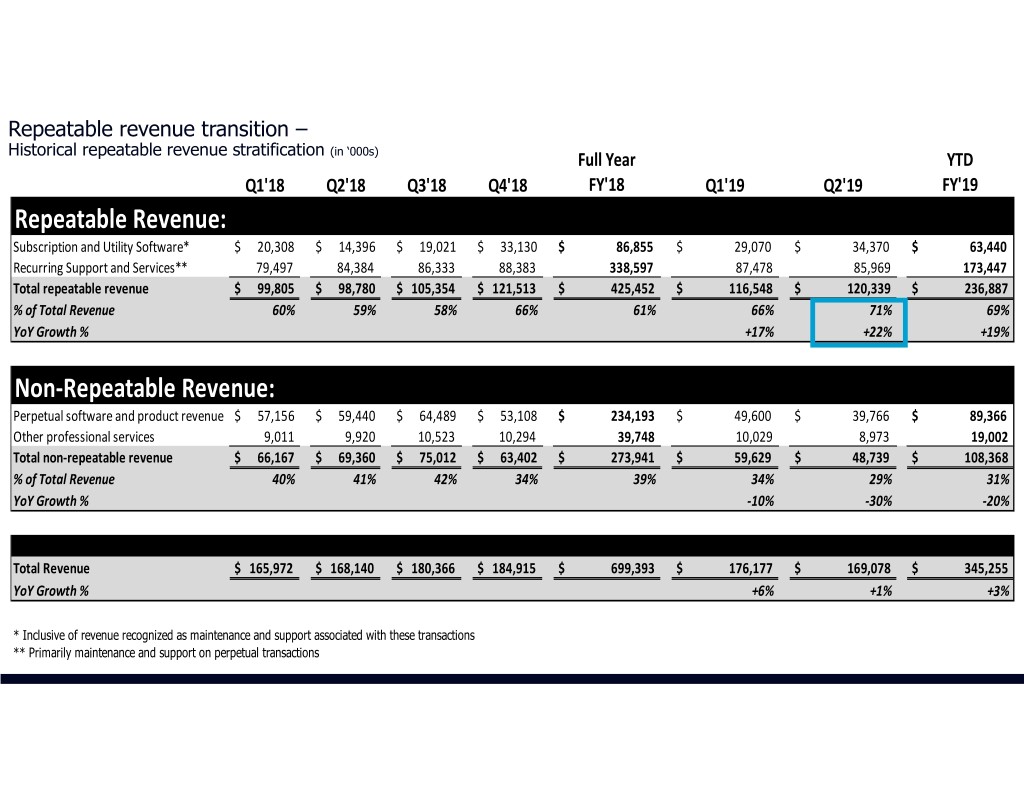
Subscription Revenue Model Transition Repeatable revenue transition – Historical repeatable revenue stratification (in ‘000s) • Enhancing our Earnings Release & SEC Filings with new table disclosing reported Repeatable vs non-Repeatable Revenue • Historical amounts are disclosed in below table (see appendix for additional historical results) Full Year YTD FY'18 Q1'19 Q2'19 FY'19 Repeatable Revenue: Subscription and Utility Software* $ 86,855 $ 29,070 $ 34,370 $ 63,440 Recurring Support and Services** 338,597 87,478 85,969 173,447 Total repeatable revenue $ 425,452 $ 116,548 $ 120,339 $ 236,887 % of Total Revenue 61% 66% 71% 69% YoY Growth % +17% +22% +19% Non‐Repeatable Revenue: Perpetual software and product revenue $ 234,193 $ 49,600 $ 39,766 $ 89,366 Other professional services 39,748 10,029 8,973 19,002 Total non‐repeatable revenue $ 273,941 $ 59,629 $ 48,739 $ 108,368 % of Total Revenue 39% 34% 29% 31% YoY Growth % ‐10% ‐30% ‐20% Total Revenue $ 699,393 $ 176,177 $ 169,078 $ 345,255 YoY Growth % +6% +1% +3% * Inclusive of revenue recognized as maintenance and support associated with these transactions ** Primarily maintenance and support on perpetual transactions 13

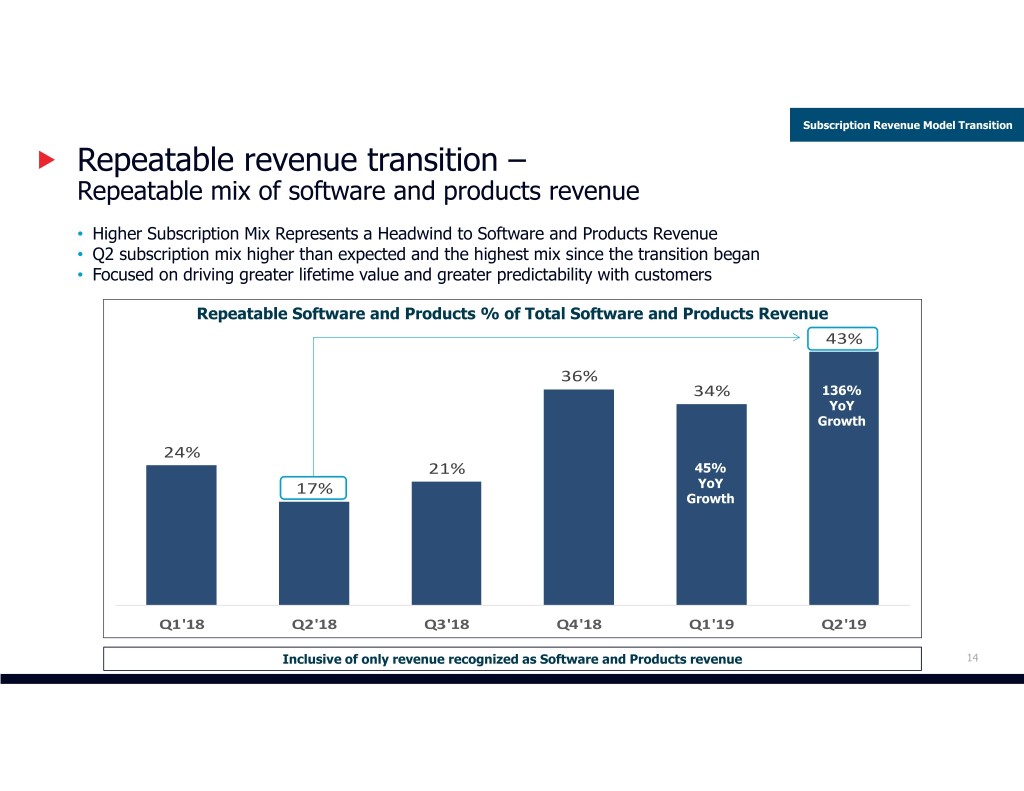
Subscription Revenue Model Transition Repeatable revenue transition – Repeatable mix of software and products revenue • Higher Subscription Mix Represents a Headwind to Software and Products Revenue • Q2 subscription mix higher than expected and the highest mix since the transition began • Focused on driving greater lifetime value and greater predictability with customers Repeatable Software and Products % of Total Software and 43%Products Revenue 36% 34% 136% YoY Growth 24% 21% 45% YoY 17% Growth Q1'18 Q2'18 Q3'18 Q4'18 Q1'19 Q2'19 Inclusive of only revenue recognized as Software and Products revenue 14

Subscription and Utility Annual Contract Value (ACV) • How is Subscription and Utility ACV defined in our business model? • Annualized equivalent of the total contract value of all subscription and utility transactions, inclusive of revenue recognized as maintenance and support, measured at the end of each fiscal quarter • Includes i) subscription software transactions based on total contract value and ii) utility transactions annualized based on quarterly usage. • Normalizes the variations in contractual length among our subscription and utility transactions • Why is Annual Contract Value an important financial metric? • Demonstrates the growth of our modern subscription and utility based pricing • Valuable metric to understand evolving customer behaviors, success of new customer acquisition, land-and-expand growth strategies and upsell initiatives • Drive decision making for sales and marketing strategies and customer success/retention strategies 15

Subscription Revenue Model Transition Historical annual contract value – Subscription and Utility ACV Annual Contract Value ~90% YoY $80 Growth $ in Millions ~70% YoY Growth $60 $40 $20 $‐ 16

FY’19 – FY’21 Revenue & earnings targets

FY’19 – Quarterly Multi-year business model transformation – Revenue and earnings targets - FY’19 Quarterly Total Revenue ‐ FY'19 Overview of Key Initiatives by Quarter ~$189M • Worked with leading consulting firm to define and implement changes to the sales force, go to market channel resource ~$181M $176M allocation, and pricing strategy $169M • Acted decisively to implement changes in-quarter to execute our transformation strategy • Q2 saw higher than anticipated subscription revenue mix and Q1'19 A Q2'19 A Q3'19 TGT Q4'19 TGT temporary disruption from the implementation of the changes % of Non‐GAAP EBIT ‐ FY'19 Revenue by Quarter ~$30M ~$27M • Major transformational changes have been completed and $25.1M $22.8M the entire organization is focused on go-forward execution • Key initiatives are now in place; however, Q3 and Q4 ~16% guidance reflects continued subscription mix headwind and ~15% prudent conservativism given the pace of transformation 14.8% 12.9% Q1'19 A Q2'19 A Q3'19 TGT Q4'19 TGT OPEN – for qualitative discussion on funnel 18

FY’19 – FY’21 Targets Business model optimization – Multi-year business model transformation FY’19: Assessment FY’20: Efficiency and FY’21: Growth and Planning Channel Execution Acceleration Revenue Growth Target Revenue Growth Target Revenue Growth Target Low single digits At Least 9% At Least 9% Target Margins Target Margins Target Margins 14.5% – 15% At Least 20% 25%+ Key Initiatives Key Initiatives Key Initiatives • Cost structure analysis • Full benefit of cost reductions • Operating expense leverage • Distribution model changes • Distribution leverage • Distribution leverage • Product SKU reduction • Focused product investment • Enhance strategic products 19

FY’19 – FY’21 Targets Multi-year business model transformation – Revenue and earnings targets - FY’18 to FY’21 Simplification + Efficiency + Investment = Robust Profit Growth Total Revenue FY'18 ‐ FY'21 TGT Non‐GAAP EBIT FY'18 ‐ FY'21 TGT Annual Annual $850M+ $210M+ ~$780M ~$715M $699M ~$160M ~25%+ ~$105M ~20% ~9% ~9% $76M 8% ~2% ~14.7% 10.9% FY'18 A FY'19 TGT FY'20 TGT FY'21 TGT FY'18 A FY'19 TGT FY'20 TGT FY'21 TGT Y/Y% Growth % of Revenue 20

Subscription Revenue Model Transition Revenue model transition – Target revenue stratification Repeatable vs. Non-repeatable revenue Repeatable Non‐Repeatable FY’19 % of total revenue $850M+ Transition Year • Completed product and license simplification ~$700M • Transformed distribution model ~80% ~75% 1st year of FY’20 – 21 significant ~70% renewals on 3 Acceleration from year subscription 61% deals traditional license Continued subscription model to subscription transition, • Represents a modest Adopted ASC 606, including the introduced conversion of headwind but results in subscription model existing customers better long-term value and predictability FY'18 Actual FY'19 TGT FY'20 TGT FY'21 TGT Revenue model transition drives superior long-term value and predictability 21

Subscription Revenue Model Transition Target Subscription and Utility ACV Transition to Subscription Models Subscription and Utility ACV ~$240M • Our goal is to drive an increasing proportion of subscription and utility licenses with the goal of approximately $240M of ACV by the end of FY2021 ~$76M • Note that ASC 606 requires us to recognize software and products revenue ~$30M at a point in time, and not ratably over the contract FY2017 Current 2021 Goal 22

Business model optimization – Operating expense targets • Targeted actions to be completed by end of FY’19 Sales & Marketing R&D G&A Opex as a % of total revenue • Cost savings offset by increased core 74% product reinvestment ~68% ~63% ~60% • Headcount actions: • FY’19 YTD reduction of ~200 (or 7%) • Focus on non-quota bearing headcount 53% and non-productive sales assets ~ 48% ~ 44% ~ 40% • Target best-in-class industry ratios • Reduction in FY‘20 and FY‘21 will be FY'18 FY'19 TGT FY'20 TGT FY'21 TGT driven by operating leverage 23

Share Repurchases

Share Repurchases Repatriation of cash • Will continue to repatriate excess Total Cash and Investments foreign cash to the US US Intl in millions $484M • Repatriation of cash requires $461M compliance with foreign regulations $130 $197 • Need to maintain liquidity in the 35+ countries we operate $354 $264 • Approximately 90% of future cash flows available in the US 57% 73% June 30, 2018 September 30, 2018 25

Share Repurchases Share Repurchase Authorization US Cash and Short Term Investments • Through October 29, 2018, we have in millions repurchased approximately $47 million of $354M our common stock in fiscal 2019. Available for repurchases through $200 March 2020 ~60% of total available cash • On October 18, 2018, our Board of balance Directors extended the expiration date of Needed for the share repurchase program to March ongoing $154 operations 31, 2020 and authorized an increase to & strategic the repurchase program so that $200 reserves million was available. September 30, 2018 26

Thank you. COMMVAULT.COM | 888.746.3849 | GET-INFO@COMMVAULT.COM © 2018 COMMVAULT SYSTEMS, INC. ALL RIGHTS RESERVED.

Appendix

Repeatable revenue transition – Historical repeatable revenue stratification (in ‘000s) Full Year YTD Q1'18 Q2'18 Q3'18 Q4'18 FY'18 Q1'19 Q2'19 FY'19 Repeatable Revenue: Subscription and Utility Software* $ 20,308 $ 14,396 $ 19,021 $ 33,130 $ 86,855 $ 29,070 $ 34,370 $ 63,440 Recurring Support and Services** 79,497 84,384 86,333 88,383 338,597 87,478 85,969 173,447 Total repeatable revenue $ 99,805 $ 98,780 $ 105,354 $ 121,513 $ 425,452 $ 116,548 $ 120,339 $ 236,887 % of Total Revenue 60% 59% 58% 66% 61% 66% 71% 69% YoY Growth % +17% +22% +19% Non‐Repeatable Revenue: Perpetual software and product revenue $ 57,156 $ 59,440 $ 64,489 $ 53,108 $ 234,193 $ 49,600 $ 39,766 $ 89,366 Other professional services 9,011 9,920 10,523 10,294 39,748 10,029 8,973 19,002 Total non‐repeatable revenue $ 66,167 $ 69,360 $ 75,012 $ 63,402 $ 273,941 $ 59,629 $ 48,739 $ 108,368 % of Total Revenue 40% 41% 42% 34% 39% 34% 29% 31% YoY Growth % ‐10% ‐30% ‐20% Total Revenue $ 165,972 $ 168,140 $ 180,366 $ 184,915 $ 699,393 $ 176,177 $ 169,078 $ 345,255 YoY Growth % +6% +1% +3% * Inclusive of revenue recognized as maintenance and support associated with these transactions ** Primarily maintenance and support on perpetual transactions
