Attached files
| file | filename |
|---|---|
| 8-K - 8-K - COLUMBUS MCKINNON CORP | a8k10302018.htm |
| EX-99.1 - EXHIBIT 99.1 - COLUMBUS MCKINNON CORP | exhibit99110302018.htm |

Q2 Fiscal Year 2019 OctoberSept 30, Investor Presentation 20182017 Financial Results Conference Call Mark D. Morelli President and Chief Executive Officer Gregory P. Rustowicz Vice President – Finance & Chief Financial Officer
Safe Harbor Statement These slides contain (and the accompanying oral discussion will contain) “forward-looking statements” within the meaning of the Private Securities Litigation Reform Act of 1995. Such statements involve known and unknown risks, uncertainties and other factors that could cause the actual results of the Company to differ materially from the results expressed or implied by such statements, including general economic and business conditions, conditions affecting the industries served by the Company and its subsidiaries, conditions affecting the Company’s customers and suppliers, competitor responses to the Company’s products and services, the overall market acceptance of such products and services, the integration of acquisitions and other factors disclosed in the Company’s periodic reports filed with the Securities and Exchange Commission. Consequently such forward looking statements should be regarded as the Company’s current plans, estimates and beliefs. The Company does not undertake and specifically declines any obligation to publicly release the results of any revisions to these forward-looking statements that may be made to reflect any future events or circumstances after the date of such statements or to reflect the occurrence of anticipated or unanticipated events. This presentation will discuss some non-GAAP financial measures, which we believe are useful in evaluating our performance. You should not consider the presentation of this additional information in isolation or as a substitute for results compared in accordance with GAAP. We have provided reconciliations of comparable GAAP to non-GAAP measures in tables found in the Supplemental Information portion of this presentation. © 2018 Columbus McKinnon Corporation 2
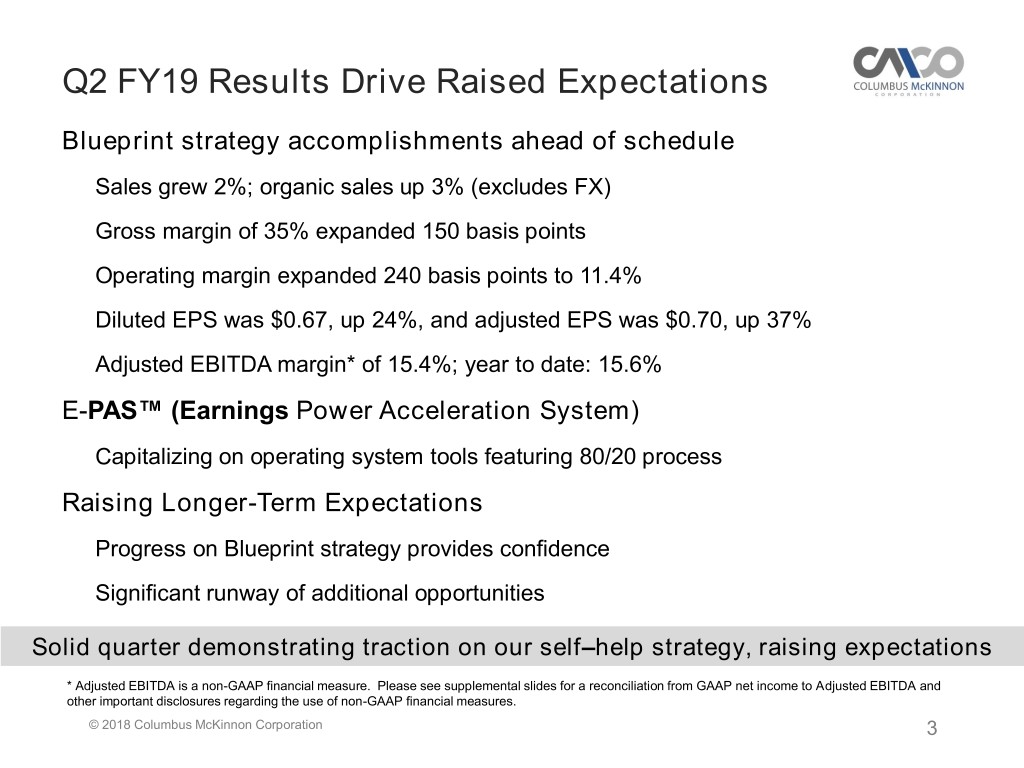
Q2 FY19 Results Drive Raised Expectations Blueprint strategy accomplishments ahead of schedule Sales grew 2%; organic sales up 3% (excludes FX) Gross margin of 35% expanded 150 basis points Operating margin expanded 240 basis points to 11.4% Diluted EPS was $0.67, up 24%, and adjusted EPS was $0.70, up 37% Adjusted EBITDA margin* of 15.4%; year to date: 15.6% E-PAS™ (Earnings Power Acceleration System) Capitalizing on operating system tools featuring 80/20 process Raising Longer-Term Expectations Progress on Blueprint strategy provides confidence Significant runway of additional opportunities Solid quarter demonstrating traction on our self–help strategy, raising expectations * Adjusted EBITDA is a non-GAAP financial measure. Please see supplemental slides for a reconciliation from GAAP net income to Adjusted EBITDA and other important disclosures regarding the use of non-GAAP financial measures. © 2018 Columbus McKinnon Corporation 3
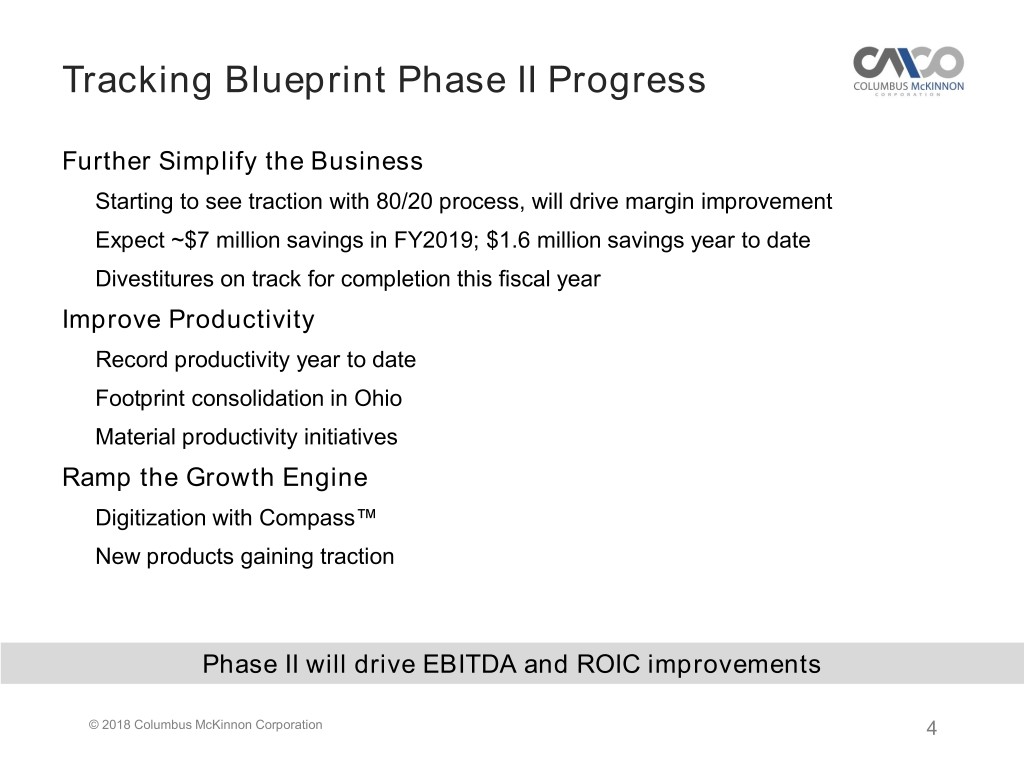
Tracking Blueprint Phase II Progress Further Simplify the Business Starting to see traction with 80/20 process, will drive margin improvement Expect ~$7 million savings in FY2019; $1.6 million savings year to date Divestitures on track for completion this fiscal year Improve Productivity Record productivity year to date Footprint consolidation in Ohio Material productivity initiatives Ramp the Growth Engine Digitization with Compass™ New products gaining traction Phase II will drive EBITDA and ROIC improvements © 2018 Columbus McKinnon Corporation 4
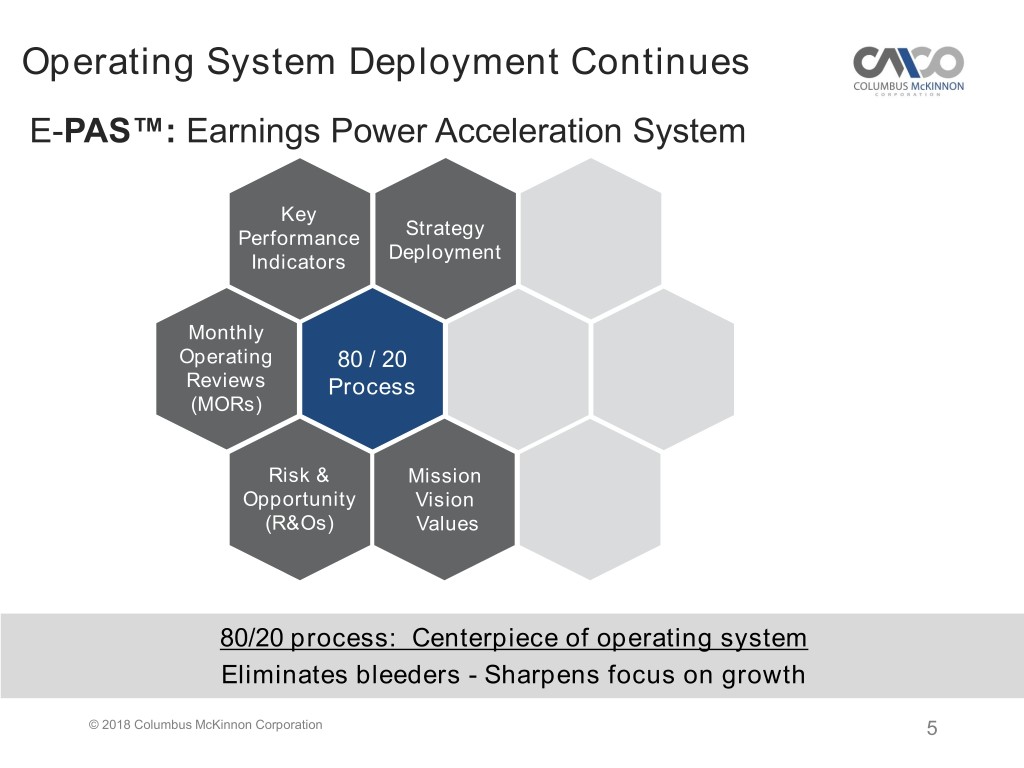
Operating System Deployment Continues E-PAS™: Earnings Power Acceleration System Key Performance Strategy Indicators Deployment Monthly Operating 80 / 20 Reviews Process (MORs) Risk & Mission Opportunity Vision (R&Os) Values 80/20 process: Centerpiece of operating system Eliminates bleeders - Sharpens focus on growth © 2018 Columbus McKinnon Corporation 5
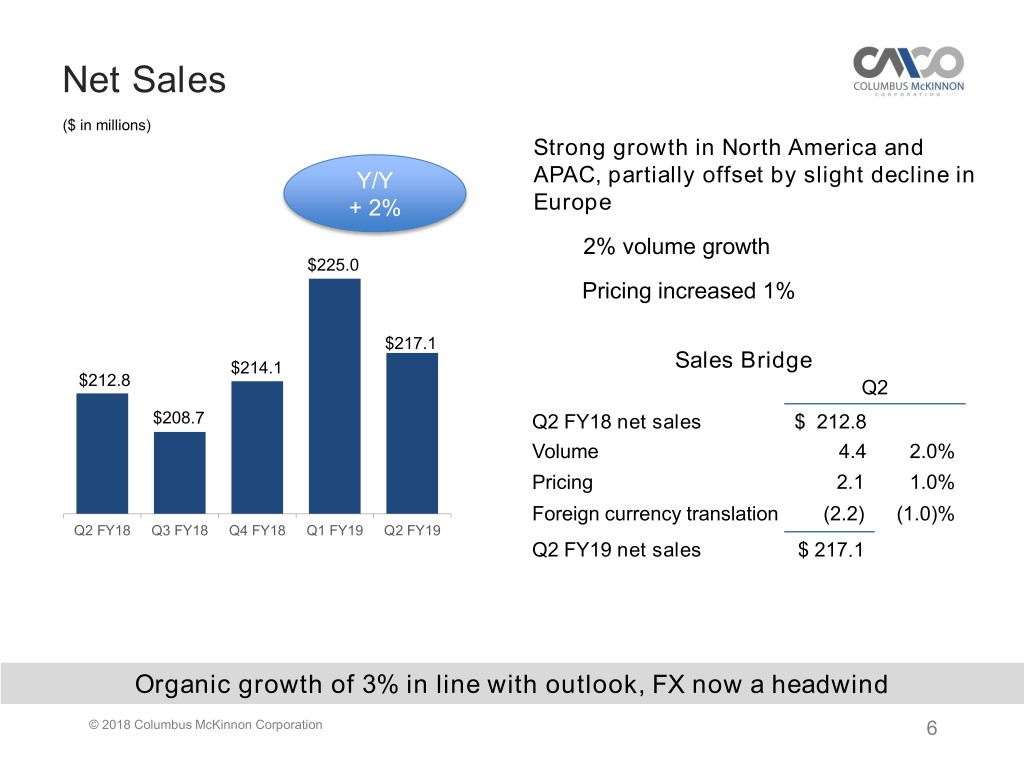
Net Sales ($ in millions) Strong growth in North America and Y/Y APAC, partially offset by slight decline in + 2% Europe 2% volume growth $225.0 Pricing increased 1% $217.1 $214.1 Sales Bridge $212.8 Q2 $208.7 Q2 FY18 net sales $ 212.8 Volume 4.4 2.0% Pricing 2.1 1.0% Foreign currency translation (2.2) (1.0)% Q2 FY18 Q3 FY18 Q4 FY18 Q1 FY19 Q2 FY19 Q2 FY19 net sales $ 217.1 Organic growth of 3% in line with outlook, FX now a headwind © 2018 Columbus McKinnon Corporation 6
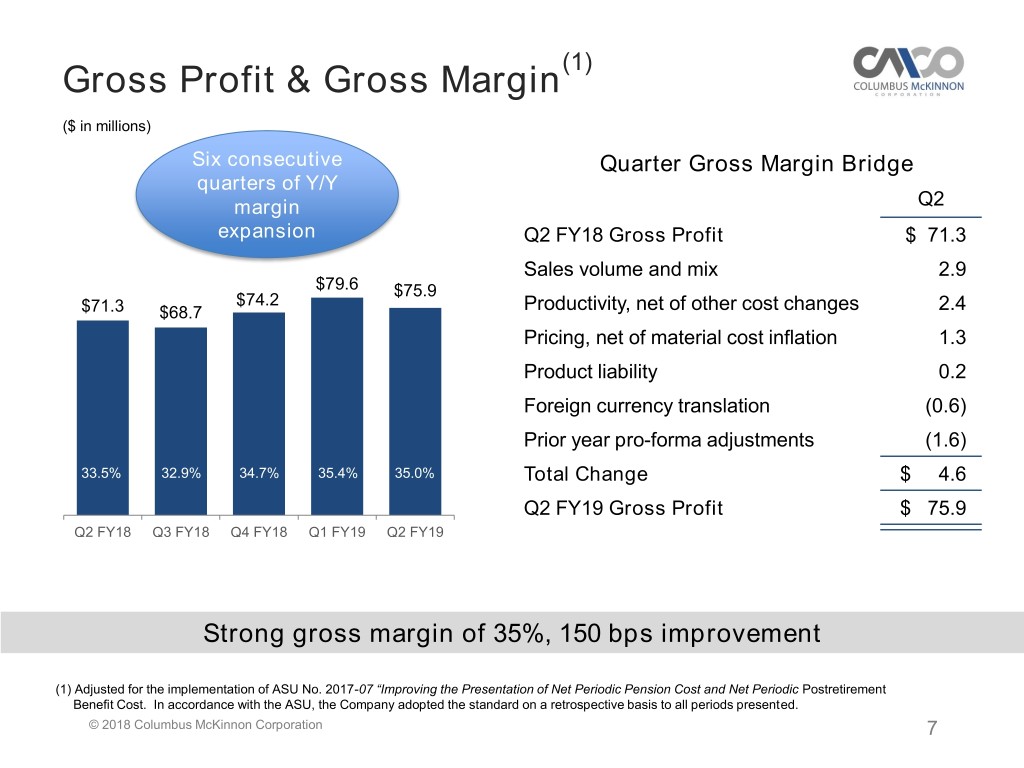
(1) Gross Profit & Gross Margin ($ in millions) Six consecutive Quarter Gross Margin Bridge quarters of Y/Y margin Q2 expansion Q2 FY18 Gross Profit $ 71.3 Sales volume and mix 2.9 $79.6 $75.9 $74.2 $71.3 $68.7 Productivity, net of other cost changes 2.4 Pricing, net of material cost inflation 1.3 Product liability 0.2 Foreign currency translation (0.6) Prior year pro-forma adjustments (1.6) 33.5% 32.9% 34.7% 35.4% 35.0% Total Change $ 4.6 Q2 FY19 Gross Profit $ 75.9 Q2 FY18 Q3 FY18 Q4 FY18 Q1 FY19 Q2 FY19 Strong gross margin of 35%, 150 bps improvement (1) Adjusted for the implementation of ASU No. 2017-07 “Improving the Presentation of Net Periodic Pension Cost and Net Periodic Postretirement Benefit Cost. In accordance with the ASU, the Company adopted the standard on a retrospective basis to all periods presented. © 2018 Columbus McKinnon Corporation 7
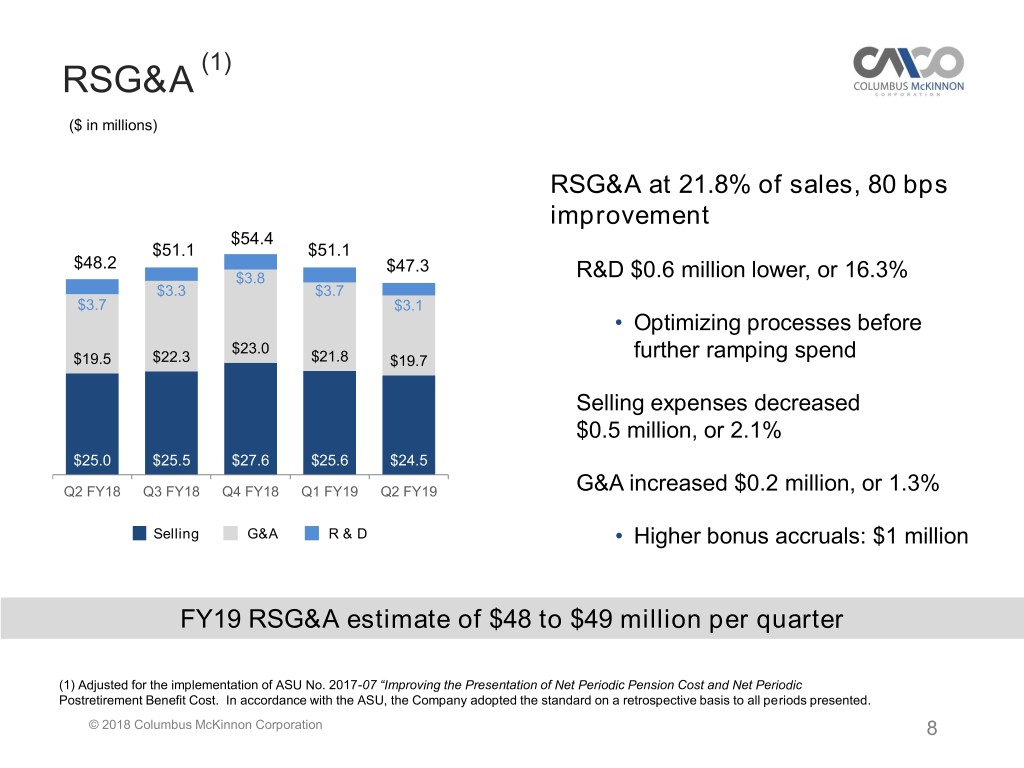
(1) RSG&A ($ in millions) RSG&A at 21.8% of sales, 80 bps improvement $54.4 $51.1 $51.1 $48.2 $47.3 $3.8 R&D $0.6 million lower, or 16.3% $3.3 $3.7 $3.7 $3.1 • Optimizing processes before $23.0 $19.5 $22.3 $21.8 $19.7 further ramping spend Selling expenses decreased $0.5 million, or 2.1% $25.0 $25.5 $27.6 $25.6 $24.5 Q2 FY18 Q3 FY18 Q4 FY18 Q1 FY19 Q2 FY19 G&A increased $0.2 million, or 1.3% Selling G&A R & D • Higher bonus accruals: $1 million FY19 RSG&A estimate of $48 to $49 million per quarter (1) Adjusted for the implementation of ASU No. 2017-07 “Improving the Presentation of Net Periodic Pension Cost and Net Periodic Postretirement Benefit Cost. In accordance with the ASU, the Company adopted the standard on a retrospective basis to all periods presented. © 2018 Columbus McKinnon Corporation 8
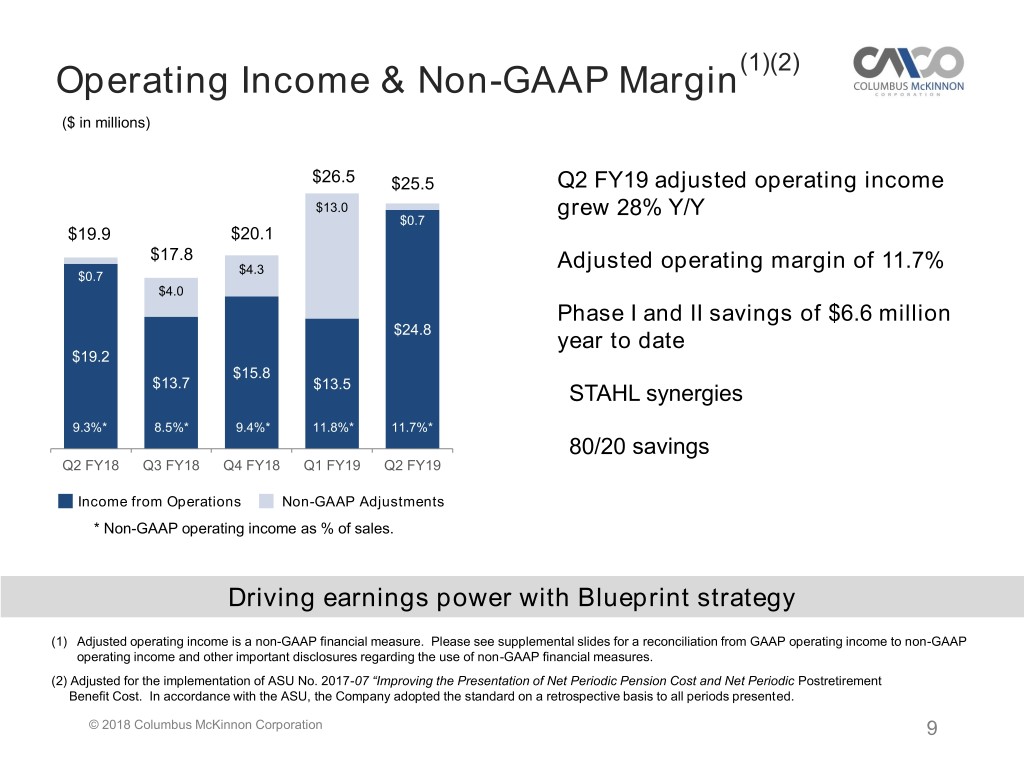
(1)(2) Operating Income & Non-GAAP Margin ($ in millions) $26.5 $25.5 Q2 FY19 adjusted operating income $13.0 grew 28% Y/Y $0.7 $19.9 $20.1 $17.8 $4.3 Adjusted operating margin of 11.7% $0.7 $4.0 Phase I and II savings of $6.6 million $24.8 year to date $19.2 $15.8 $13.7 $13.5 STAHL synergies 9.3%* 8.5%* 9.4%* 11.8%* 11.7%* 80/20 savings Q2 FY18 Q3 FY18 Q4 FY18 Q1 FY19 Q2 FY19 Income from Operations Non-GAAP Adjustments * Non-GAAP operating income as % of sales. Driving earnings power with Blueprint strategy (1) Adjusted operating income is a non-GAAP financial measure. Please see supplemental slides for a reconciliation from GAAP operating income to non-GAAP operating income and other important disclosures regarding the use of non-GAAP financial measures. (2) Adjusted for the implementation of ASU No. 2017-07 “Improving the Presentation of Net Periodic Pension Cost and Net Periodic Postretirement Benefit Cost. In accordance with the ASU, the Company adopted the standard on a retrospective basis to all periods presented. © 2018 Columbus McKinnon Corporation 9
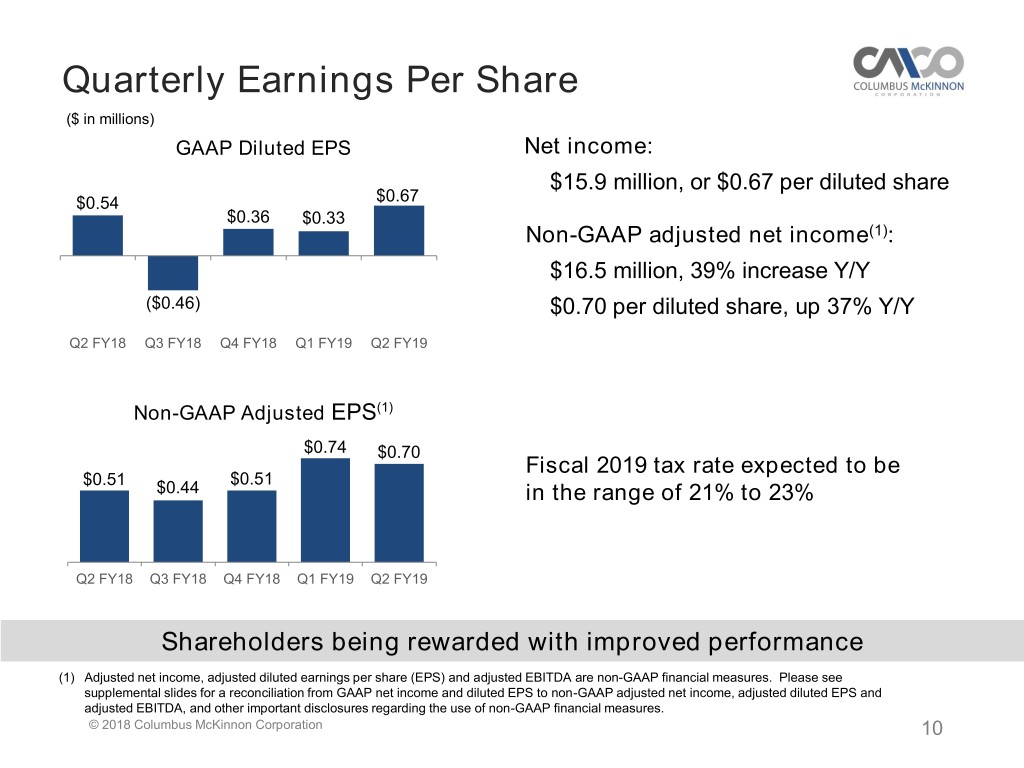
Quarterly Earnings Per Share ($ in millions) GAAP Diluted EPS Net income: $15.9 million, or $0.67 per diluted share $0.54 $0.67 $0.36 $0.33 Non-GAAP adjusted net income(1): $16.5 million, 39% increase Y/Y ($0.46) $0.70 per diluted share, up 37% Y/Y Q2 FY18 Q3 FY18 Q4 FY18 Q1 FY19 Q2 FY19 Non-GAAP Adjusted EPS(1) $0.74 $0.70 Fiscal 2019 tax rate expected to be $0.51 $0.51 $0.44 in the range of 21% to 23% Q2 FY18 Q3 FY18 Q4 FY18 Q1 FY19 Q2 FY19 Shareholders being rewarded with improved performance (1) Adjusted net income, adjusted diluted earnings per share (EPS) and adjusted EBITDA are non-GAAP financial measures. Please see supplemental slides for a reconciliation from GAAP net income and diluted EPS to non-GAAP adjusted net income, adjusted diluted EPS and adjusted EBITDA, and other important disclosures regarding the use of non-GAAP financial measures. © 2018 Columbus McKinnon Corporation 10
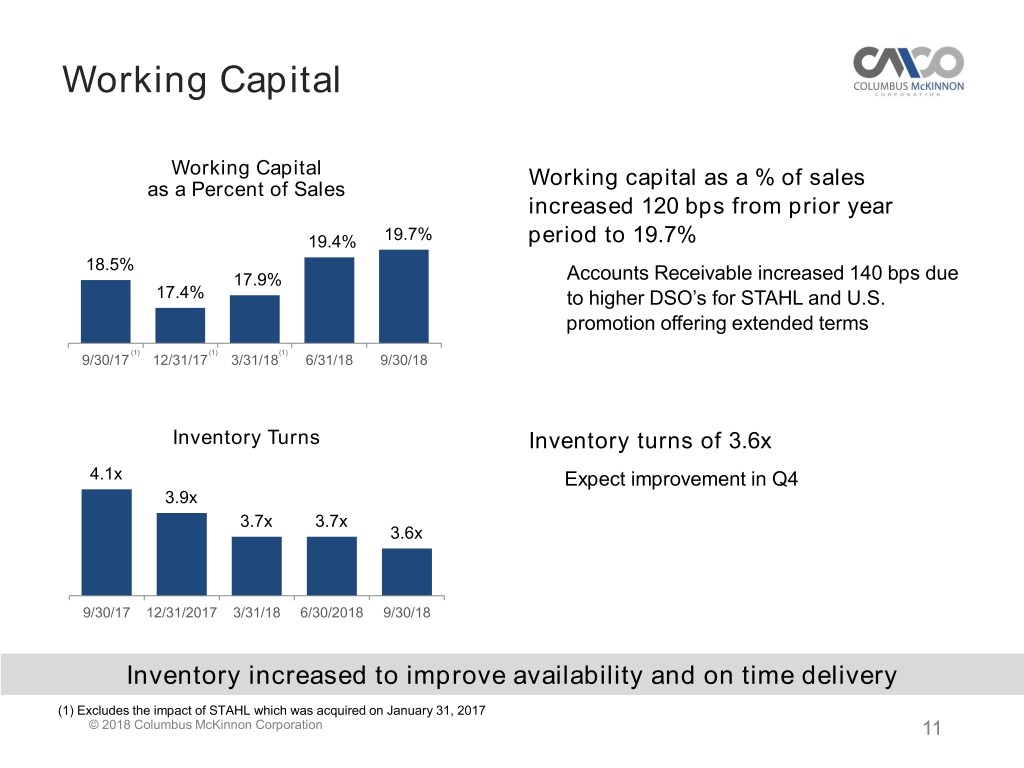
Working Capital Working Capital Working capital as a % of sales as a Percent of Sales increased 120 bps from prior year 19.4% 19.7% period to 19.7% 18.5% 17.9% Accounts Receivable increased 140 bps due 17.4% to higher DSO’s for STAHL and U.S. promotion offering extended terms (1) (1) (1) 9/30/17 12/31/17 3/31/18 6/31/18 9/30/18 Inventory Turns Inventory turns of 3.6x 4.1x Expect improvement in Q4 3.9x 3.7x 3.7x 3.6x 9/30/17 12/31/2017 3/31/18 6/30/2018 9/30/18 Inventory increased to improve availability and on time delivery (1) Excludes the impact of STAHL which was acquired on January 31, 2017 © 2018 Columbus McKinnon Corporation 11
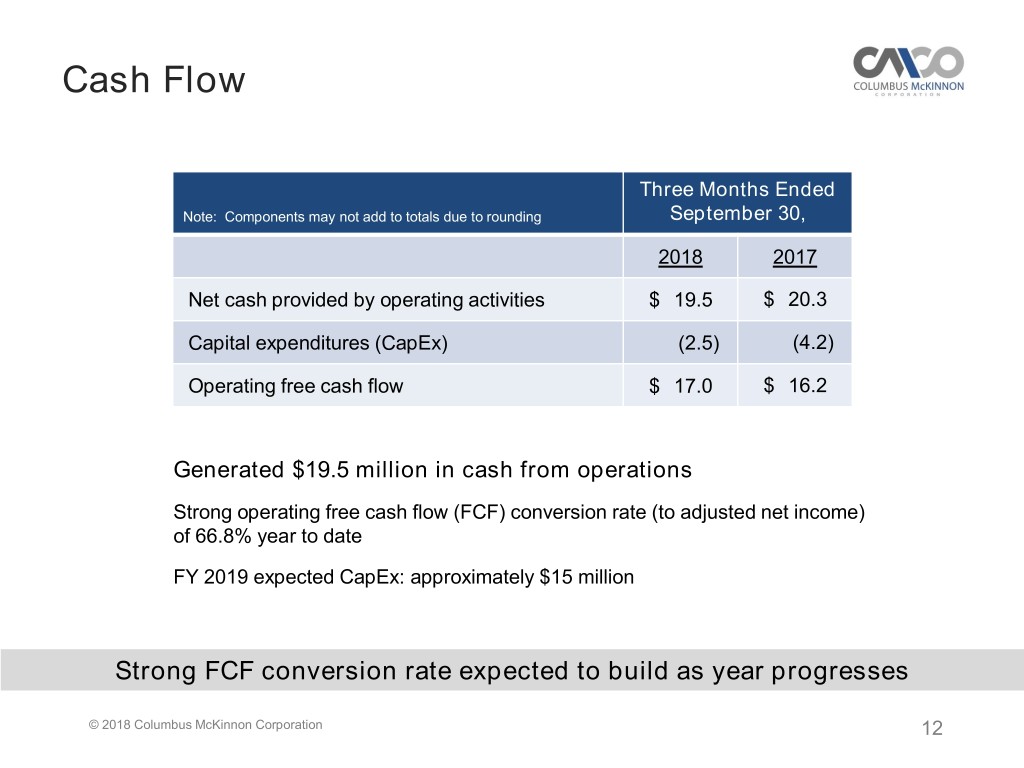
Cash Flow Three Months Ended Note: Components may not add to totals due to rounding September 30, 2018 2017 Net cash provided by operating activities $ 19.5 $ 20.3 Capital expenditures (CapEx) (2.5) (4.2) Operating free cash flow $ 17.0 $ 16.2 Generated $19.5 million in cash from operations Strong operating free cash flow (FCF) conversion rate (to adjusted net income) of 66.8% year to date FY 2019 expected CapEx: approximately $15 million Strong FCF conversion rate expected to build as year progresses © 2018 Columbus McKinnon Corporation 12
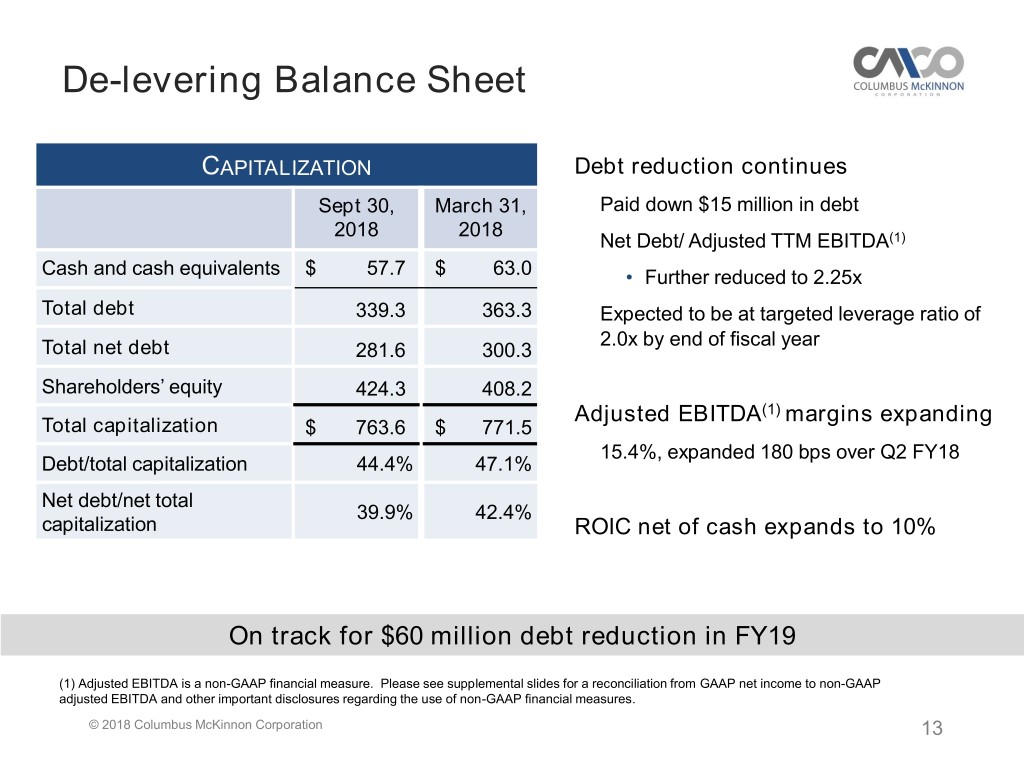
De-levering Balance Sheet CAPITALIZATION Debt reduction continues Sept 30, March 31, Paid down $15 million in debt 2018 2018 Net Debt/ Adjusted TTM EBITDA(1) Cash and cash equivalents $ 57.7 $ 63.0 • Further reduced to 2.25x Total debt 339.3 363.3 Expected to be at targeted leverage ratio of 2.0x by end of fiscal year Total net debt 281.6 300.3 Shareholders’ equity 424.3 408.2 Adjusted EBITDA(1) margins expanding Total capitalization $ 763.6 $ 771.5 15.4%, expanded 180 bps over Q2 FY18 Debt/total capitalization 44.4% 47.1% Net debt/net total 39.9% 42.4% capitalization ROIC net of cash expands to 10% On track for $60 million debt reduction in FY19 (1) Adjusted EBITDA is a non-GAAP financial measure. Please see supplemental slides for a reconciliation from GAAP net income to non-GAAP adjusted EBITDA and other important disclosures regarding the use of non-GAAP financial measures. © 2018 Columbus McKinnon Corporation 13
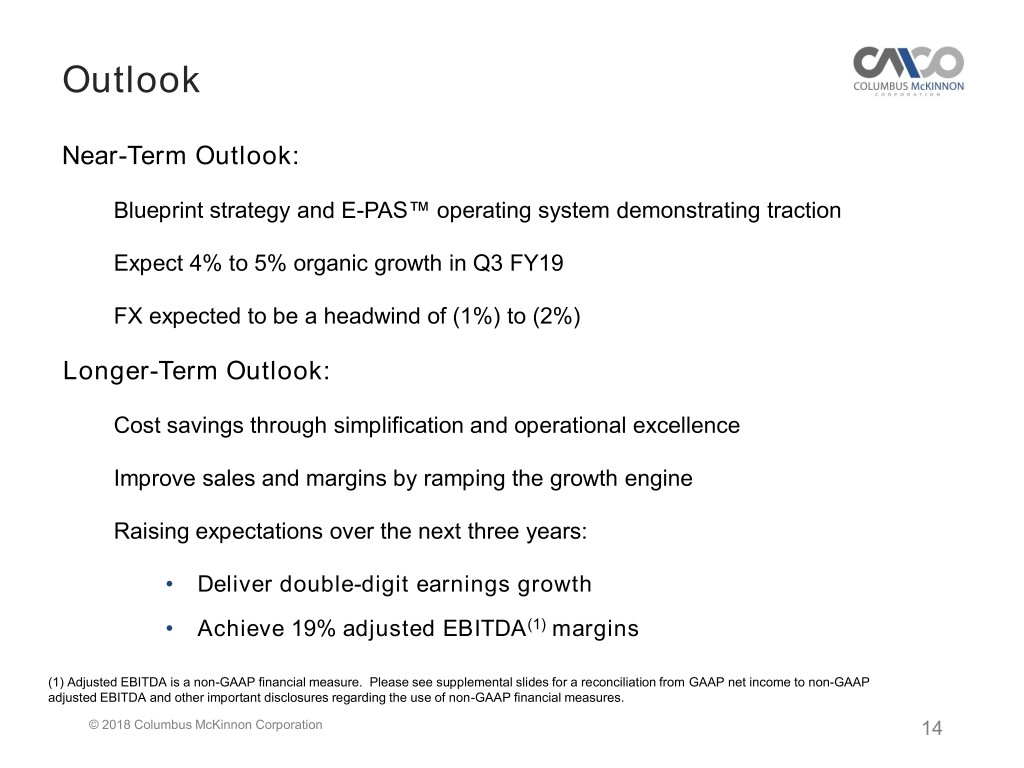
Outlook Near-Term Outlook: Blueprint strategy and E-PAS™ operating system demonstrating traction Expect 4% to 5% organic growth in Q3 FY19 FX expected to be a headwind of (1%) to (2%) Longer-Term Outlook: Cost savings through simplification and operational excellence Improve sales and margins by ramping the growth engine Raising expectations over the next three years: • Deliver double-digit earnings growth • Achieve 19% adjusted EBITDA(1) margins (1) Adjusted EBITDA is a non-GAAP financial measure. Please see supplemental slides for a reconciliation from GAAP net income to non-GAAP adjusted EBITDA and other important disclosures regarding the use of non-GAAP financial measures. © 2018 Columbus McKinnon Corporation 14
Supplemental Information © 2018 Columbus McKinnon Corporation 15
Conference Call Playback Info Replay Number: 412-317-6671 passcode: 13683795 Telephone replay available through November 6, 2018 Webcast / PowerPoint / Replay available at www.cmworks.com/investors Transcript, when available, at www.cmworks.com/investors © 2018 Columbus McKinnon Corporation 16
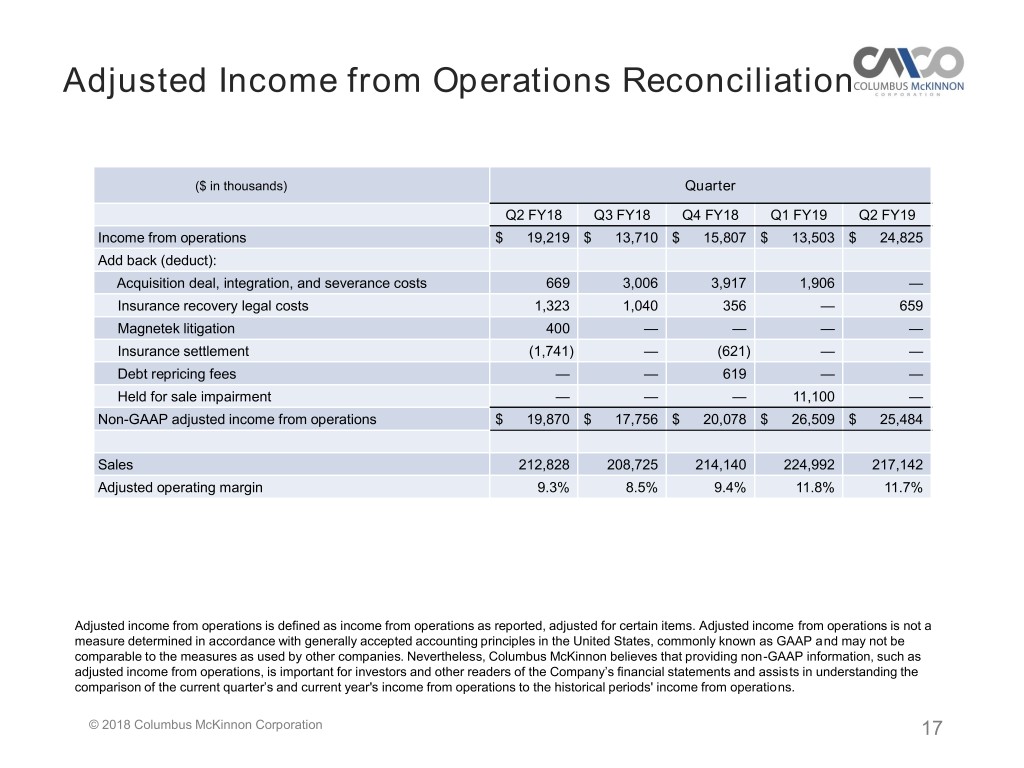
Adjusted Income from Operations Reconciliation ($ in thousands) Quarter Q2 FY18 Q3 FY18 Q4 FY18 Q1 FY19 Q2 FY19 Income from operations $ 19,219 $ 13,710 $ 15,807 $ 13,503 $ 24,825 Add back (deduct): Acquisition deal, integration, and severance costs 669 3,006 3,917 1,906 — Insurance recovery legal costs 1,323 1,040 356 — 659 Magnetek litigation 400 — — — — Insurance settlement (1,741) — (621) — — Debt repricing fees — — 619 — — Held for sale impairment — — — 11,100 — Non-GAAP adjusted income from operations $ 19,870 $ 17,756 $ 20,078 $ 26,509 $ 25,484 Sales 212,828 208,725 214,140 224,992 217,142 Adjusted operating margin 9.3% 8.5% 9.4% 11.8% 11.7% Adjusted income from operations is defined as income from operations as reported, adjusted for certain items. Adjusted income from operations is not a measure determined in accordance with generally accepted accounting principles in the United States, commonly known as GAAP and may not be comparable to the measures as used by other companies. Nevertheless, Columbus McKinnon believes that providing non-GAAP information, such as adjusted income from operations, is important for investors and other readers of the Company’s financial statements and assists in understanding the comparison of the current quarter’s and current year's income from operations to the historical periods' income from operations. © 2018 Columbus McKinnon Corporation 17
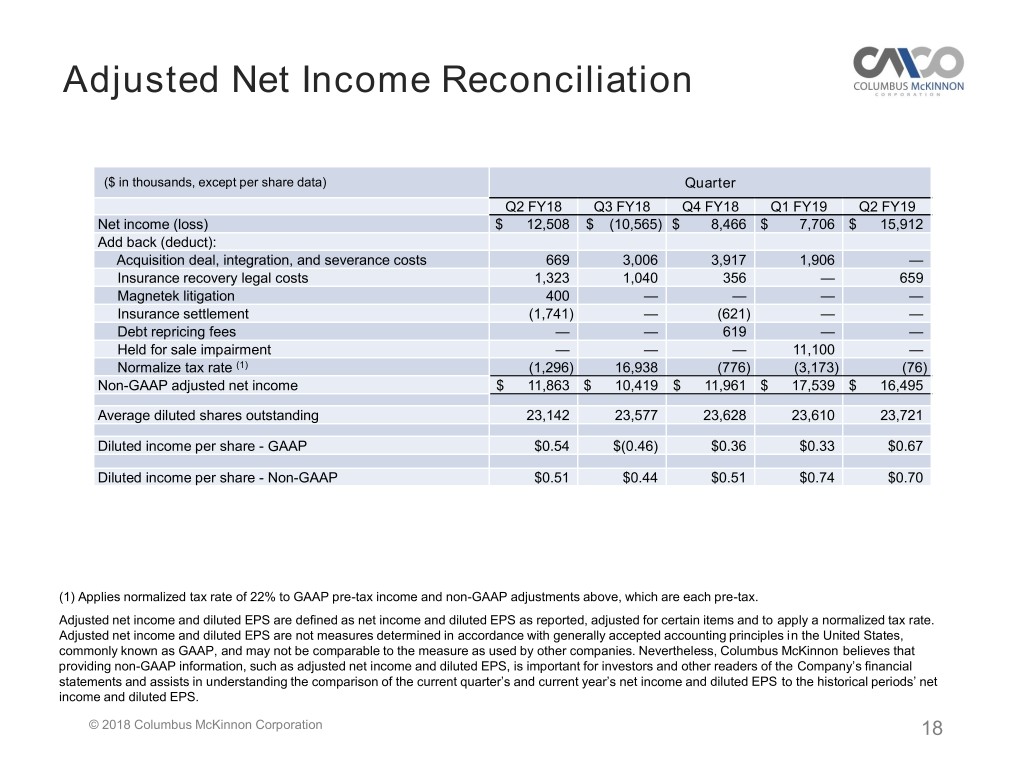
Adjusted Net Income Reconciliation ($ in thousands, except per share data) Quarter Q2 FY18 Q3 FY18 Q4 FY18 Q1 FY19 Q2 FY19 Net income (loss) $ 12,508 $ (10,565) $ 8,466 $ 7,706 $ 15,912 Add back (deduct): Acquisition deal, integration, and severance costs 669 3,006 3,917 1,906 — Insurance recovery legal costs 1,323 1,040 356 — 659 Magnetek litigation 400 — — — — Insurance settlement (1,741) — (621) — — Debt repricing fees — — 619 — — Held for sale impairment — — — 11,100 — Normalize tax rate (1) (1,296) 16,938 (776) (3,173) (76) Non-GAAP adjusted net income $ 11,863 $ 10,419 $ 11,961 $ 17,539 $ 16,495 Average diluted shares outstanding 23,142 23,577 23,628 23,610 23,721 Diluted income per share - GAAP $0.54 $(0.46) $0.36 $0.33 $0.67 Diluted income per share - Non-GAAP $0.51 $0.44 $0.51 $0.74 $0.70 (1) Applies normalized tax rate of 22% to GAAP pre-tax income and non-GAAP adjustments above, which are each pre-tax. Adjusted net income and diluted EPS are defined as net income and diluted EPS as reported, adjusted for certain items and to apply a normalized tax rate. Adjusted net income and diluted EPS are not measures determined in accordance with generally accepted accounting principles in the United States, commonly known as GAAP, and may not be comparable to the measure as used by other companies. Nevertheless, Columbus McKinnon believes that providing non-GAAP information, such as adjusted net income and diluted EPS, is important for investors and other readers of the Company’s financial statements and assists in understanding the comparison of the current quarter’s and current year’s net income and diluted EPS to the historical periods’ net income and diluted EPS. © 2018 Columbus McKinnon Corporation 18
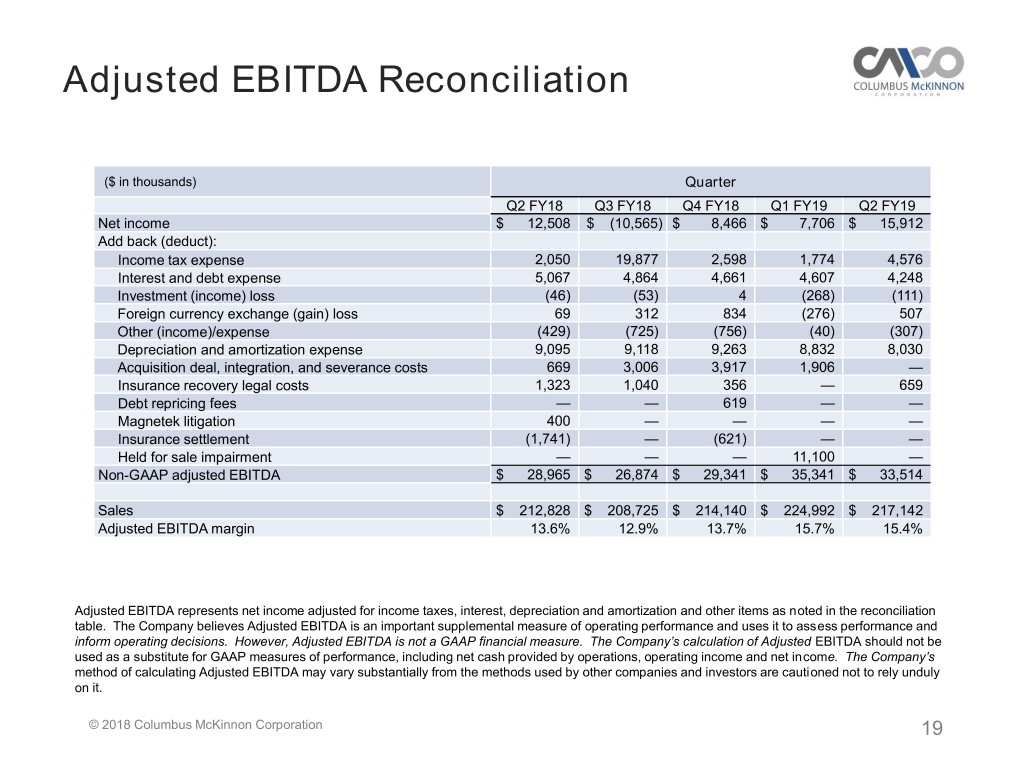
Adjusted EBITDA Reconciliation ($ in thousands) Quarter Q2 FY18 Q3 FY18 Q4 FY18 Q1 FY19 Q2 FY19 Net income $ 12,508 $ (10,565) $ 8,466 $ 7,706 $ 15,912 Add back (deduct): Income tax expense 2,050 19,877 2,598 1,774 4,576 Interest and debt expense 5,067 4,864 4,661 4,607 4,248 Investment (income) loss (46) (53) 4 (268) (111) Foreign currency exchange (gain) loss 69 312 834 (276) 507 Other (income)/expense (429) (725) (756) (40) (307) Depreciation and amortization expense 9,095 9,118 9,263 8,832 8,030 Acquisition deal, integration, and severance costs 669 3,006 3,917 1,906 — Insurance recovery legal costs 1,323 1,040 356 — 659 Debt repricing fees — — 619 — — Magnetek litigation 400 — — — — Insurance settlement (1,741) — (621) — — Held for sale impairment — — — 11,100 — Non-GAAP adjusted EBITDA $ 28,965 $ 26,874 $ 29,341 $ 35,341 $ 33,514 Sales $ 212,828 $ 208,725 $ 214,140 $ 224,992 $ 217,142 Adjusted EBITDA margin 13.6% 12.9% 13.7% 15.7% 15.4% Adjusted EBITDA represents net income adjusted for income taxes, interest, depreciation and amortization and other items as noted in the reconciliation table. The Company believes Adjusted EBITDA is an important supplemental measure of operating performance and uses it to assess performance and inform operating decisions. However, Adjusted EBITDA is not a GAAP financial measure. The Company’s calculation of Adjusted EBITDA should not be used as a substitute for GAAP measures of performance, including net cash provided by operations, operating income and net income. The Company’s method of calculating Adjusted EBITDA may vary substantially from the methods used by other companies and investors are cautioned not to rely unduly on it. © 2018 Columbus McKinnon Corporation 19
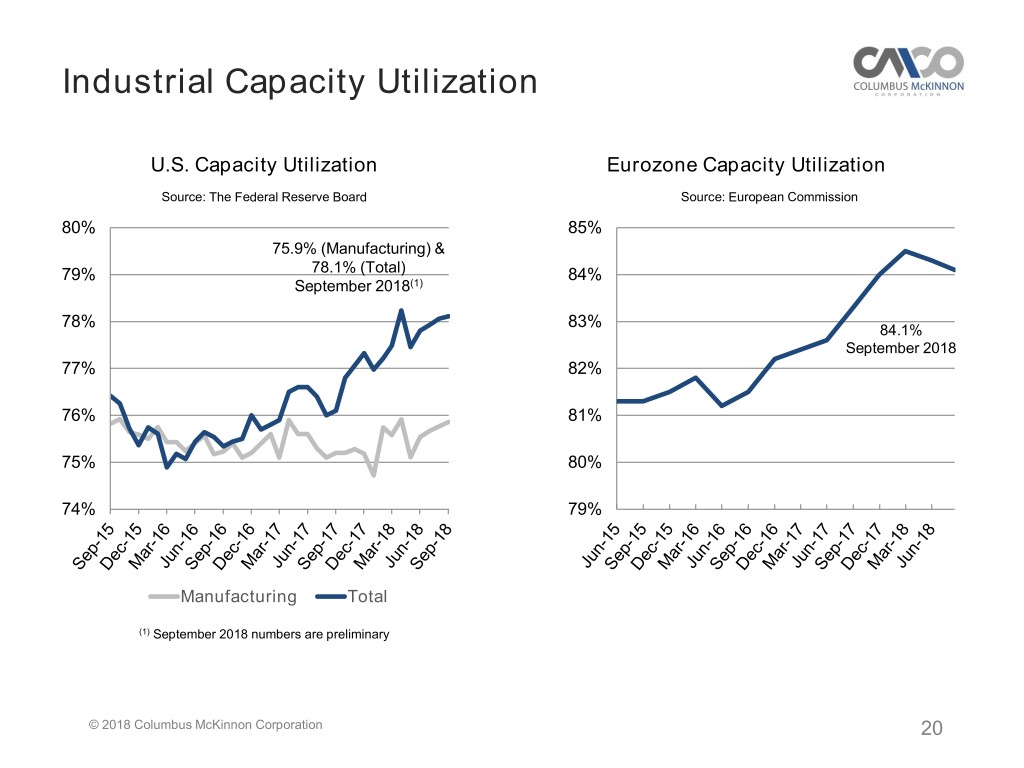
Industrial Capacity Utilization U.S. Capacity Utilization Eurozone Capacity Utilization Source: The Federal Reserve Board Source: European Commission 80% 85% 75.9% (Manufacturing) & 79% 78.1% (Total) 84% September 2018(1) 78% 83% 84.1% September 2018 77% 82% 76% 81% 75% 80% 74% 79% Manufacturing Total (1) September 2018 numbers are preliminary © 2018 Columbus McKinnon Corporation 20
