Attached files
| file | filename |
|---|---|
| EX-99.1 - EXHIBIT 99.1 - Bank7 Corp. | ex99_1.htm |
| 8-K - 8-K - Bank7 Corp. | form8k.htm |
Exhibit 99.2

Bank7 Corp. Q3 Earnings ReleaseOctober 31, 2018

Legal Information and Disclaimer This presentation and oral statements made regarding the subject of
this presentation contain forward-looking statements. These forward-looking statements reflect Bank7 Corp.’s current views with respect to, among other things, future events and Bank7 Corp.’s financial performance. Any statements about Bank7
Corp.’s expectations, beliefs, plans, predictions, forecasts, objectives, assumptions or future events or performance are not historical facts and may be forward-looking. These statements are often, but not always, made through the use of words
or phrases such as “anticipate,” “believes,” “can,” “could,” “may,” “predicts,” “potential,” “should,” “will,” “estimate,” “plans,” “projects,” “continuing,” “ongoing,” “expects,” “intends” and similar words or phrases. Any or all of the
forward-looking statements in (or conveyed orally regarding) this presentation may turn out to be inaccurate. The inclusion of or reference to forward-looking information in this presentation should not be regarded as a representation by Bank7
Corp. or any other person that the future plans, estimates or expectations contemplated by Bank7 Corp. will be achieved. Bank7 Corp. has based these forward-looking statements largely on its current expectations and projections about future
events and financial trends that Bank7 Corp. believes may affect its financial condition, results of operations, business strategy and financial needs. Bank7 Corp.’s actual results could differ materially from those anticipated in such
forward-looking statements as a result of risks, uncertainties and assumptions that are difficult to predict. If one or more events related to these or other risks or uncertainties materialize, or if Bank7 Corp.’s underlying assumptions prove
to be incorrect, actual results may differ materially from what Bank7 Corp. anticipates. You are cautioned not to place undue reliance on forward-looking statements. Further, any forward-looking statement speaks only as of the date on which it
is made and Bank7 Corp. undertakes no obligation to update or revise any forwardlooking statement to reflect events or circumstances after the date on which the statement is made or to reflect the occurrence of unanticipated events, except as
may be required by law. All forward-looking statements herein are qualified by these cautionary statements. Within this presentation, we reference certain market, industry and demographic data, forecasts and other statistical information. We
have obtained this data, forecasts and information from various independent, third party industry sources and publications. Nothing in the data, forecasts or information used or derived from third party sources should be construed as advice.
Some data and other information are also based on our good faith estimates, which are derived from our review of industry publications and surveys and independent sources. We believe that these sources and estimates are reliable, but have not
independently verified them. Statements as to our market position are based on market data currently available to us. Although we are not aware of any misstatements regarding the economic, employment, industry and other market data presented
herein, these estimates involve inherent risks and uncertainties and are based on assumptions that are subject to change. This presentation includes certain non-GAAP financial measures, including adjusted net income, adjusted earnings per
share, adjusted return on average assets and adjusted return on average shareholders’ equity. These non-GAAP financial measures and any other non-GAAP financial measures that we discuss in this presentation should not be considered in
isolation, and should be considered as additions to, and not substitutes for or superior to, measures of financial performance prepared in accordance with GAAP. There are a number of limitations related to the use of these non-GAAP financial
measures versus their nearest GAAP equivalents. For example, other companies may calculate non-GAAP financial measures differently or may use other measures to evaluate their performance, all of which could reduce the usefulness of Bank7
Corp.’s non-GAAP financial measures as tools for comparison. See the table on Slide 14 of this presentation for a reconciliation of the non-GAAP financial measures used in (or conveyed orally during) this presentation to their most directly
comparable GAAP financial measures.

Corporate Overview September 30, 2018 Assets $751 million Loans $585 million Deposits $664
million One of the Top Performing Community Banks in the United States for 2017 (1)Track Record of Industry Leading Profitability and Expense ControlIntense Focus on Underwriting Process and Asset QualityScalable and Consistently Growing
PlatformWell Positioned for Rising RatesNASDAQ: BSVN (1) Best-performing community banks of 2017 under $1B in assets, S&P Global Market Intelligence -
https://platform.mi.spglobal.com/web/client?auth=inherit#news/article?id=43935321&cdid=A-43935321-11062

Financial Snapshot: Bank7 continues to experience growth and strong earnings For the Nine Months
EndedSeptember 30, 2018 Net Income (2) Dollars are in millions, except earnings per share. Financial data is as of or for the twelve months ended December 31 of each respective year and as of or for the nine months ended September 30, 2018
and 2017.Tangible shareholders’ equity and tangible shareholders’ equity to tangible assets are non-GAAP financial measures. See non-GAAP reconciliation table for reconciliation to their most comparable GAAP measures.Profitability metrics are
tax adjusted as if the Company were a C Corporation at the estimated tax rates for the respective periods.Net interest margin (excluding loan fee income) is a non-GAAP financial measure. See non-GAAP reconciliation table for reconciliation to
its most comparable GAAP measure.At September 30, 2018 Tier 1 leverage ratio, common equity Tier 1 risk-based capital ratio, Tier 1 risk based capital ratio, and total risk-based capital ratios were 10.76%, 13.67%, 13.67%, and 14.92%
respectively for the Company.Ratio is for the Bank only and represents total non-owner occupied CRE loans, including loans secured by multi-family residential real estate, investor CRE, and construction and land loans, divided by the Bank’s
total risk-based capital. Total Assets

Historical Performance Return on Average Assets (1) Return on Average Equity (1) Dollars are in
millionsFinancial data is as of or for the twelve months ended December 31 of each respective year and as of or for the nine months ended September 30, 2018.Profitability metrics are tax adjusted as if the Company were a C Corporation at the
estimated tax rates for the respective periods. Leveraging Our Employee Base Efficiency Ratio We continue to see near industry-leading ROA and ROEWe have maintained our low efficiency ratio and high asset to employee ratioOur earnings have
been further boosted by the Tax Cuts and Jobs Act

September 30, 2017 September 30, 2018 Annual growth rate Balance Sheet and Earnings
Growth Dollars are in millions, except earnings per share.Financial data is as of or for the twelve months ended December 31 of each respective year and as of or for the nine months ended September 30, 2018.Net income is tax adjusted as if the
Company were a C Corporation at the estimated tax rates for the respective periods.Tangible book value per share is a non-GAAP financial measure. See Appendix for reconciliation to its most comparable GAAP measure. Balance Sheet and Earnings
Growth 13.1% 10.1% 12.7% 24.4% 18.6% Tangible Book Value Per Share (2) $664.1 $751.2 $531.1 $584.8 $589.7 $664.3 $66.6 $82.8 $12.0 $14.3 CAGR = 23.2% (1)

Net Interest Margin Breakdown Net Interest Margin Financial data is as of or for the twelve months
ended December 31 of each respective year and as of or for the nine months ended September 30, 2018.Yield on loans (excluding loan fee income) and net interest margin (excluding loan fee income) are non-GAAP financial measures. See Appendix for
reconciliation to their most comparable GAAP measures. Net interest margin (excluding loan fee income) has steadily increased and remains at a healthy levelBank is well-positioned to maintain its performance in a rising rate environment
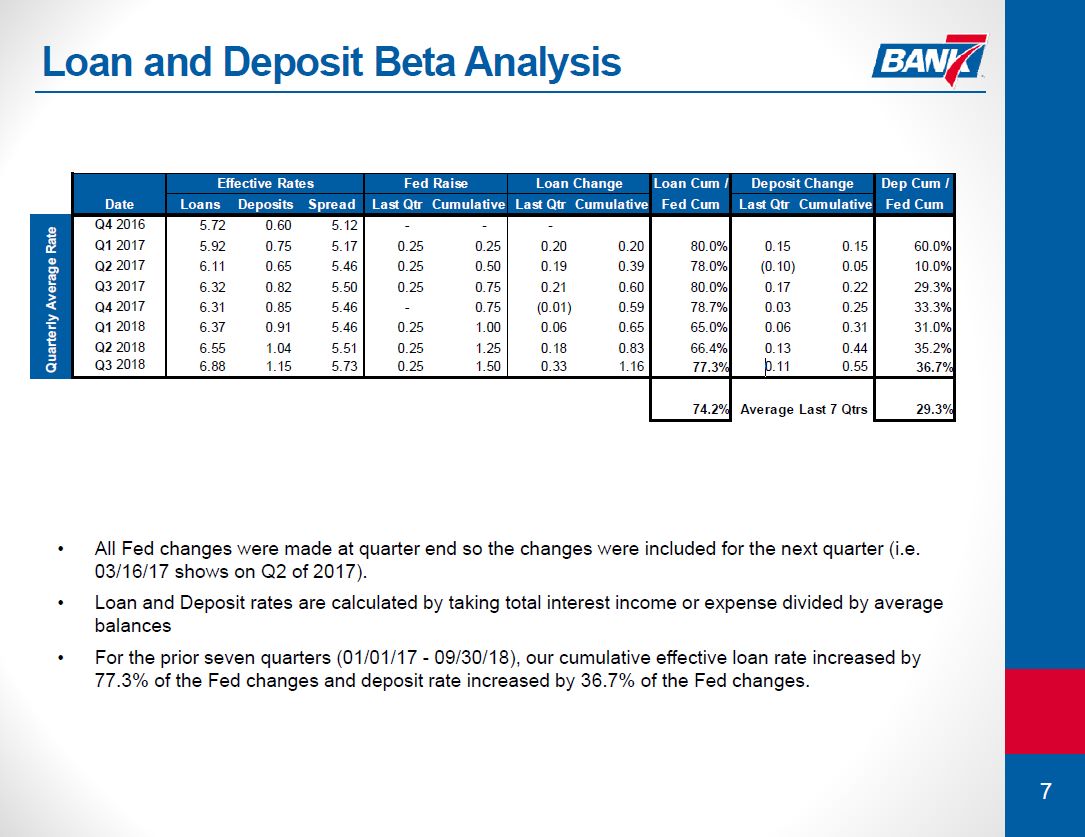
Loan and Deposit Beta Analysis 28.4% 31.1% 22.1% 23.2% 26.5% 26.3% All Fed changes were made at
quarter end so the changes were included for the next quarter (i.e. 03/16/17 shows on Q2 of 2017).Loan and Deposit rates are calculated by taking total interest income or expense divided by average balancesFor the prior seven quarters (01/01/17
- 09/30/18), our cumulative effective loan rate increased by 77.3% of the Fed changes and deposit rate increased by 36.7% of the Fed changes.

Asset Quality Net Charge-Offs to Average Loans Allowance for Loan Losses to Total Loans Financial data
is as of or for the twelve months ended December 31 of each respective year and as of or for the nine months ended September 30, 2018. Nonperforming Assets to Loans and OREO Q3 asset quality remains strongWe continue to maintain a strong loan
loss reserveQuality underwriting and disciplined lending practices have led to low nonperforming loans and net charge-offs

Diversified Loan Portfolio Dollars are in millions. Data as of September 30, 2018. Gross Loan Portfolio
Composition by Purpose Type

Deposit Composition Historical Deposit Growth CAGR = 12.4% Deposit Composition as of September 30,
2018 Our Deposit StrategyGather deposits from commercial clients through a suite of targeted deposit offerings, including a variety of remote deposit and cash management productsCommercial loan customers are a strong source of deposit
accounts, and we consistently seek to develop deposit relationships with our borrowers82.1% of our loan customers also had a deposit relationship with us as of September 30, 2018Offer consumers traditional retail deposit products through our
branch network, along with online, mobile and direct banking channelsCore DepositsCore deposits are deposits obtained directly from the depositor and exclude deposits obtained from listing services and brokered deposits that are obtained
through an intermediaryCore deposits totaled $597.9 million, or 89.9% of total deposits, as of September 30, 2018 Dollars are in millions.Financial data is as of or for the twelve months ended December 31 of each respective year and as of or
for the nine months ended September 30, 2018. 28.4% 31.1% 22.1% 23.2% 26.5% 26.3% Commentary

Appendix

Bank7 Corp. Financials Net income and earnings per share are tax adjusted as if the Company were a C
Corporation at the estimated tax rates for the respective periods. Represents a non-GAAP financial measure. See non-GAAP reconciliations table for reconciliation to its more comparable GAAP measure.

Bank7 Corp. Financials Return on average assets and shareholders’ equity are tax adjusted as if the
Company were a C Corporation at the estimated tax rates for the respective periods.Efficiency ratio is calculated by dividing noninterest expense by the sum of net interest income on a tax equivalent basis and noninterest income. Represents a
non-GAAP financial measure. See non-GAAP reconciliations table for reconciliation to its more comparable GAAP measure. Ratios are based on Bank level financial information rather than consolidated information. At September 30, 2018 Tier 1
leverage ratio, common equity Tier 1 risk-based capital ratio, Tier 1 risk based capital ratio, and total risk-based capital ratios were 10.76%, 13.67%, 13.67%, and 14.92% respectively for the Company.

Non-GAAP Reconciliations