Attached files
| file | filename |
|---|---|
| EX-99.1 - EXHIBIT 99.1 - 3D SYSTEMS CORP | exh_991.htm |
| 8-K - FORM 8-K - 3D SYSTEMS CORP | f8k_103018.htm |
EXHIBIT 99.2
Third Quarter 2018 October 30, 2018
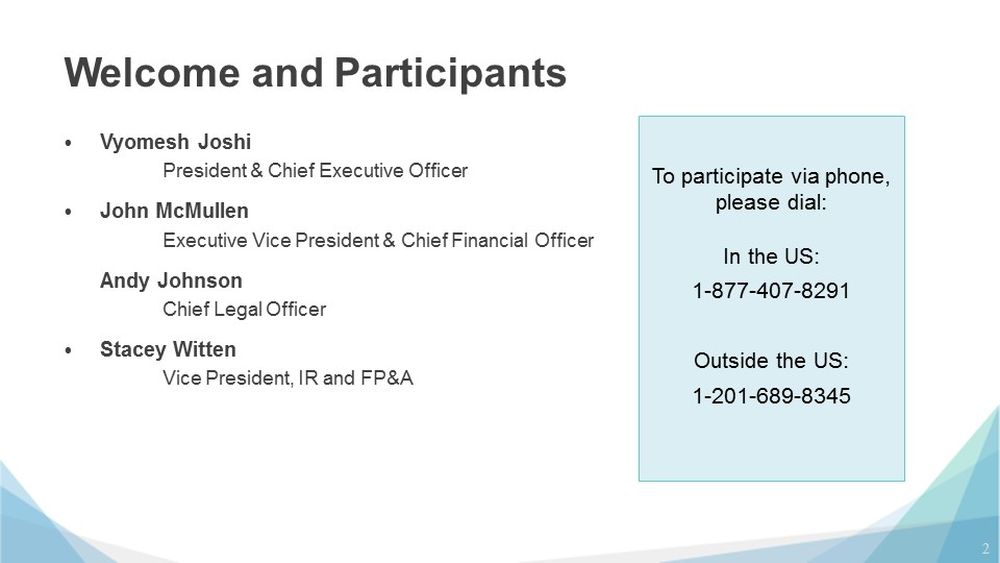
Welcome and Participants ⦁ Vyomesh Joshi President & Chief Executive Officer ⦁ John McMullen Executive Vice President & Chief Financial Officer Andy Johnson Chief Legal Officer ⦁ Stacey Witten Vice President, IR and FP&A To participate via phone, please dial: In the US: 1 - 877 - 407 - 8291 Outside the US: 1 - 201 - 689 - 8345 2

Forward Looking Statements This presentation contains certain statements that are not statements of historical or current facts are forward - looking stateme nts within the meaning of the Private Securities Litigation Reform Act of 1995. Forward - looking statements include statements concerning plans, objectives, goals, strategies, expectations , intentions, projections, developments, future events, performance or products, underlying assumptions, and other statements which are other than statements of historical facts. I n s ome cases, you can identify forward - looking statements by terms such as “believes,” “beliefs,” ''may,'' ''will,'' ''should,'' expects,'' ''intends,'' ''plans,'' ''anticipates,'' ''est ima tes,'' ''predicts,'' ''projects,'' ''potential,'' ''continue,'' and other similar terminology or the negative of these terms. From time to time, we may publish or otherwise make available forward - looking statements of thi s nature. All such forward - looking statements, whether written or oral, and whether made by us or on our behalf, are expressly qualified by the cautionary statements described on t his message including those set forth below. Forward - looking statements are based upon management’s beliefs, assumptions and current expectations concerning future events an d trends, using information currently available, and are necessarily subject to uncertainties, many of which are outside our control. In addition, we undertake no obligation to u pda te or revise any forward - looking statements made by us or on our behalf, whether as a result of future developments, subsequent events or circumstances, or otherwise, or to reflect the o ccu rrence or likelihood of unanticipated events, and we disclaim any such obligation. Forward - looking statements are only predictions that relate to future events or our future performance and are subject to known and unknown risks, uncertainties, assumptions, and other factors, many of which are beyond our control, that may cause actual results, outcomes, levels of activity, performance, deve lop ments, or achievements to be materially different from any future results, outcomes, levels of activity, performance, developments, or achievements expressed, anticipated, or implied b y t hese forward - looking statements. Although we believe that the expectations reflected in the forward - looking statements are reasonable, forward - looking statements are not, and should not be relied upon as a guarantee of future performance or results, nor will they necessarily prove to be accurate indications of the times at or by which any such performance or resul ts will be achieved. 3D System’s actual results could differ materially from those stated or implied in forward - looking statements. Past performance is not necessarily indicative of future results. We do not undertake any obligation to and do not intend to update any forward - looking statements whether as a result of future developments, subsequent events or circumstances o r otherwise. Further, we encourage you to review “Risk Factors” in Part 1 of our Annual Report on Form 10 - K and Part II of our quarterly repo rts on Form 10 - Q filed with the SEC as well as other information about us in our filings with the SEC. These are available at www.SEC.gov. 3

Vyomesh Joshi (VJ) President & Chief Executive Officer

Third Quarter Highlights 5 • We are pleased with our continued strong growth in printer units and printer revenue across both metals and plastics with balanced execution across all regions • New products have been very well received, and we continue to ramp sales and production of these new solutions • We are seeing early returns on the investments we have made and continue to deliver growth across many revenue drivers • While actions and investments in go - to - market are not done, we have made significant progress to drive growth and improve execution worldwide • We are starting to see cost structure improvements as a result of the actions we are taking

New Product Update 6 • In the third quarter, we began to ramp production and sales of our new products • It is still early in commercial shipments, but we are very pleased with the reception of the SLS 6100, NextDent 5100, FabPro 1000, StandAlone Figure 4, and MJP 2500 IC • Debuted new DMP Factory 500 at IMTS 2018, our first solution from our partnership with GF Machining Solutions • Continuing to build on the success of our metals platform, we are now shipping the ProX DMP 350, the next generation of the ProX DMP 320 • Planning ongoing innovation designed for advanced manufacturing, including materials expansion, additional software and workflow capabilities, automation and integration with traditional manufacturing

Third Quarter Results Overview 7 • Revenue increased 8% to $164.5 million • Strong printer revenue growth of 17% on 93% unit growth as well as growth in materials, software and healthcare solutions • GAAP gross profit margin of 47.3% and non - GAAP gross profit margin of 47.4% • We are beginning to see results from actions we are taking to improve our cost structure, and operating expenses decreased in the third quarter, including GAAP operating expenses decreased 2% to $88.8 million and non - GAAP operating expenses decreased 3% to $73.7 million. • GAAP loss of $0.10 per share and non - GAAP earnings of $0.02 per share In the third quarter of 2018:

John McMullen Executive Vice President & Chief Financial Officer

GAAP Operating Results 9 Third Quarter Nine Months Ended (in millions, except per share amounts) 2018 2017 Y/Y Change 2018 2017 Y/Y Change Revenue $ 164.5 $ 152.9 8% $ 506.9 $ 468.8 8% Gross Profit 77.8 58.5 33% 241.8 219.4 10% Gross Profit Margin 47.3 % 38.3 % 902 bps 47.7 % 46.8 % 91 bps SG&A 65.6 66.5 (1)% 206.2 196.0 5% R&D 23.2 24.4 (5)% 71.8 71.7 — % Operating Expenses 88.8 90.9 (2)% 278.0 267.7 4% % of Revenue 54.0 % 59.4 % 54.8 % 57.1 % Operating Loss (11.0 ) (32.3 ) 66% (36.2 ) (48.3 ) 25% % of Revenue (6.7 )% (21.1 )% (7.1 )% (10.3 )% Net Loss per 3D Systems $ (11.6 ) $ (37.7 ) 69% $ (41.4 ) $ (56.1 ) 26% % of Revenue (7.0 )% (24.6 )% (8.2 )% (12.0 )% Loss Per Share $ (0.10 ) $ (0.34 ) 71% $ (0.37 ) $ (0.50 ) 26%

Non - GAAP Financial Measures 10 We use non - GAAP measures to supplement our financial statements presented on a GAAP basis because management believes non - GAAP financial measures are useful to investors in evaluating our operating performance and to facilitate a better understand ing of the impact that strategic acquisitions, non - recurring charges and certain non - cash expenses had on our financial results. See append ix for reconciliation of non - GAAP items. Third Quarter Nine Months Ended (in millions, except per share amounts) 2018 2017 Y/Y Change 2018 2017 Y/Y Change Non - GAAP R&D Expense $ 22.8 $ 24.4 (6)% $ 71.3 $ 71.7 (1)% Non - GAAP SG&A Expense 50.8 51.5 (1)% 160.9 147.3 9% Non - GAAP Operating Expenses $ 73.7 $ 75.9 (3)% $ 232.2 $ 219.0 6% Non - GAAP Net income (loss) attributable to 3D Systems Corporation $ 2.4 $ (22.6 ) (110)% $ 5.1 $ (7.0 ) (173)% Non - GAAP Net income (loss) per share available to 3D Systems Corporation common stockholders - basic and diluted $ 0.02 $ (0.20 ) (110)% $ 0.05 $ (0.06 ) (183)% * Tables may not foot due to rounding; amounts calculated based on dollars in thousands.

Revenue Drivers Printers revenue increased 17% to $34.5 million Materials revenue increased 2% to $40.3 million Healthcare solutions increased 14% to $53.1 million Software increased 8% to $22.9 million On demand manufacturing decreased 3% to $26.3 million Q3 2018 compared to Q3 2017: 11

Gross Profit and Margin • GAAP GPM was 47.3% and non - GAAP GPM was 47.4% in Q3 2018 • Cost improvements from ongoing supply chain cost reduction initiatives were offset by the impact of sales mix and production and actions related to ramping new products 12 See appendix for a reconciliation of non - GAAP operating expenses. – For the periods presented above, GAAP and non - GAAP GPM were within 10 basis points; therefore, the lines overlap.

Operating Expenses 13 • GAAP operating expenses decreased 2% and non - GAAP operating expenses decreased 3% compared to the third quarter of the prior year • Although we expect some fluctuations quarter to quarter, we are beginning to see the results of actions we are taking to reduce cost structure • We began to shift from R&D development to marketing and sales support of the new products we have rolled out this year Q1 2017 Q2 2017 Q3 2017 Q4 2017 Q1 2018 See appendix for a reconciliation of non - GAAP operating expenses. Q2 2018 Q3 2018

Balance Sheet and Cash 14 • We used $12.1 million dollars of cash in operations during the third quarter, and $2.9 million of cash in operations in the first nine months of the year. • We ended the quarter with $92.1 million dollars of cash on hand. • During the third quarter, we continued to invest in IT transformation and go - to - market and support new product rollouts, including a significant increase in inventory for our expanded portfolio and payment a previously accrued liability related to the conclusion of litigation • We expect cash use and generation will continue to fluctuate from period to period as we continue to make investments we believe are critical while at the same time improving our operational performance over time

Summary 15 • We are pleased with the overall progress we are seeing year to date in many areas • While our work is not done, we believe we are well - positioned to continue to invest in the business and drive growth while continuing to improve our cost structure and increase operating leverage over the long term • We continue to be keenly focused on execution and operational efficiency to drive long - term growth and profitability

Vyomesh Joshi (VJ) President & Chief Executive Officer

Conclusion 17 • We are pleased with our results this quarter and the progress we have made to transform the company • We are very excited about our enhanced and complete end - to - end portfolio, our ongoing innovation and significant market opportunities. • We are building the foundation for growth, to scale the company and strengthen our leadership position in the industry. • We are focused on operational excellence and customer driven innovation to expand applications and use cases through our advanced and complete workflow solutions. • We have the leadership, expertise, talent and partnerships combined with the best and broadest portfolio, to drive customers' shift to 3D production.

Q&A Session In the USA: 1 - 877 - 407 - 8291 Outside the USA: 1 - 201 - 689 - 8345

Thank You

Appendix

Revenue Summary by Category 21 (in millions) Q3 2018 Q2 2018 Q3 2017 Sequential Change YOY Change Printers $ 34.5 $ 39.2 $ 29.4 (12)% 17% Software Products 12.0 12.9 10.6 (7)% 13% Other Products 13.2 13.7 11.3 (4)% 16% Total Products 59.6 65.8 51.3 (9)% 16% Total Materials 40.3 45.0 39.4 (11)% 2% On Demand Manufacturing 26.3 27.4 27.2 (4)% (3)% Software Services 11.0 11.2 10.7 (2)% 2% Other Services 27.3 27.2 24.3 1% 13% Total Services 64.6 65.8 62.2 (2)% 4% Total Revenue $ 164.5 $ 176.6 $ 152.9 (7)% 8% Software $ 22.9 $ 24.1 $ 21.3 (5)% 8% Healthcare $ 53.1 $ 61.4 $ 46.6 (14)% 14% * Tables may not foot due to rounding; amounts calculated based on dollars in thousands.

Non - GAAP Reconciliation 22 Third Quarter and Nine Months Non - GAAP Earnings (Loss) per Share Quarter Ended September 30, Nine Months Ended September 30, (in millions, except per share amounts) 2018 2017 2018 2017 GAAP Net loss attributable to 3D Systems Corporation $ (11.6 ) $ (37.7 ) $ (41.4 ) $ (56.1 ) Adjustments: Amortization, stock - based compensation & other 1 15.2 15.5 44.8 47.7 Legal and acquisition - related 2 (2.1 ) (0.4 ) (2.1 ) 1.4 Cost optimization plan 3 0.9 — 2.4 — Impairment of cost - method investments 4 — — 1.4 — Non - GAAP net income attributable to 3D Systems Corporation $ 2.4 $ (22.6 ) $ 5.1 $ (7.0 ) Non - GAAP net income per share available to 3D Systems common stock holders - basic and diluted 5 $ 0.02 $ (0.20 ) $ 0.05 $ (0.06 ) 1 For the quarter ended September 30, 2018, the adjustment included $0.1 in COGS and $15.1 in SG&A. For the quarter ended Septe mbe r 30, 2017, the adjustment included $0.1 in COGS and $15.4 in SG&A. For the nine months ended September 30, 2018, the adjustment included $0.3 in COGS and $44.5 in SG&A. For the nine months ended September 30, 2017, the adjustment included $0.3 in COGS and $47.4 in SG&A. 2 For the quarter ended September 30, 2018, the adjustment included ($0.7) in SG&A and ($1.4) in interest and other income (exp ens e), net. For the quarter ended September 30, 2017, the adjustment included ($0.4) in SG&A. For the nine months ended September 30, 2018, the adjustment included ($0.7 ) i n SG&A and ($1.4) in interest and other income (expense), net. For the nine months ended September 30, 2017, the adjustment included $1.2 in SG&A and $0.2 in interes t a nd other income (expense), net. 3 For the quarter ended September 30, 2018, the adjustment included $0.1 in COGS, $0.4 in SG&A and $0.3 in R&D. For the nine mo nth s ended September 30, 2018, the adjustment included $0.4 in COGS, $1.5 in SG&A, and approximately $0.5 in R&D. 4 The Company has minority investments of less than 20% ownership in enterprises that benefit from, or are powered by its techn olo gy portfolio. The value of each of these investments is assessed periodically, and impairment recorded when required. For the quarter and nine months ended September 30, 2018, the adjustment included zero and $1.4, respectively, in interest and other income (expense), net. The Company excluded this amount as it is not related to on - goi ng operations, and intends to exclude these impairment amounts from non - GAAP net income going forward. 5 Denominator based on weighted average shares used in the GAAP EPS calculation. * Tables may not foot due to rounding; amounts calculated based on dollars in thousands.

Non - GAAP Reconciliation 23 2018 Non - GAAP Gross Profit & Margin 2018 Quarter Ended Year to Date (in millions) March 31 June 30 September 30 September 30 GAAP Gross Profit $ 77.9 $ 86.2 $ 77.8 $ 241.8 GAAP Gross Profit Margin 46.9 % 48.8 % 47.3 % 47.7 % Adjustments: Amortization, stock - based compensation & other $ 0.1 $ 0.1 $ 0.1 $ 0.3 Cost optimization plan $ 0.2 $ 0.2 $ 0.1 $ 0.4 Non - GAAP Gross Profit $ 78.1 $ 86.4 $ 78.0 $ 242.5 Non - GAAP Gross Profit Margin 47.1 % 48.9 % 47.4 % 47.8 % * Tables may not foot due to rounding; amounts calculated based on dollars in thousands.

Non - GAAP Reconciliation 24 2018 Non - GAAP Operating Expenses 2018 Quarter Ended Year to Date (in millions) March 31 June 30 September 30 September 30 GAAP R&D Expenses $ 25.9 $ 22.7 $ 23.2 $ 71.8 GAAP SG&A Expenses 69.5 71.2 65.6 206.2 GAAP Operating Expenses $ 95.3 $ 93.9 $ 88.8 $ 278.0 Adjustments to R&D Expenses: Cost optimization plan 1 — 0.2 0.3 0.5 Non - GAAP R&D Expenses $ 25.9 $ 22.5 $ 22.8 $ 71.3 Adjustments to SG&A Expenses: Amortization, stock - based compensation & other 15.1 14.3 15.1 44.5 Legal and acquisition - related 0.4 (0.4 ) (0.7 ) (0.7 ) Cost optimization plan 0.4 0.7 0.4 1.5 Total Adjustments to SG&A Expenses 15.9 14.6 14.8 45.3 Non - GAAP SG&A Expenses $ 53.6 $ 56.6 $ 50.8 $ 160.9 Non - GAAP Operating Expenses $ 79.4 $ 79.1 $ 73.7 $ 232.2 1 For the quarter ended March 31, 2018, the adjustment included approximately $32 thousand and therefore rounded down. * Tables may not foot due to rounding; amounts calculated based on dollars in thousands.
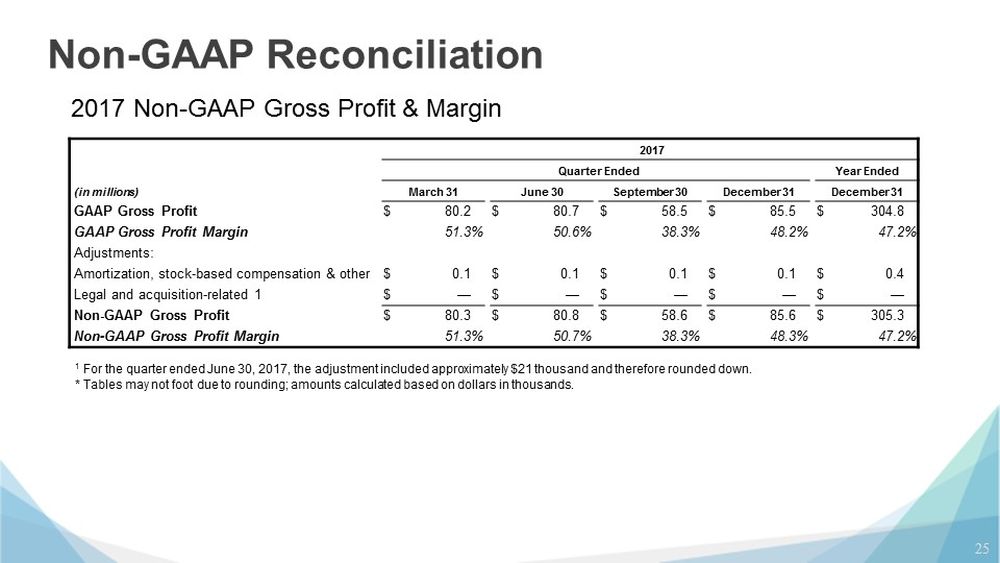
Non - GAAP Reconciliation 25 2017 Non - GAAP Gross Profit & Margin 2017 Quarter Ended Year Ended (in millions) March 31 June 30 September 30 December 31 December 31 GAAP Gross Profit $ 80.2 $ 80.7 $ 58.5 $ 85.5 $ 304.8 GAAP Gross Profit Margin 51.3 % 50.6 % 38.3 % 48.2 % 47.2 % Adjustments: Amortization, stock - based compensation & other $ 0.1 $ 0.1 $ 0.1 $ 0.1 $ 0.4 Legal and acquisition - related 1 $ — $ — $ — $ — $ — Non - GAAP Gross Profit $ 80.3 $ 80.8 $ 58.6 $ 85.6 $ 305.3 Non - GAAP Gross Profit Margin 51.3 % 50.7 % 38.3 % 48.3 % 47.2 % 1 For the quarter ended June 30, 2017, the adjustment included approximately $21 thousand and therefore rounded down. * Tables may not foot due to rounding; amounts calculated based on dollars in thousands.

Non - GAAP Reconciliation 26 2017 Non - GAAP Operating Expenses 2017 Quarter Ended Year Ended (in millions) March 31 June 30 September 30 December 31 December 31 GAAP R&D Expenses $ 22.9 $ 24.4 $ 24.4 $ 23.0 $ 94.6 GAAP SG&A Expenses $ 66.4 $ 63.1 $ 66.5 $ 68.2 $ 264.2 GAAP Operating Expenses $ 89.3 $ 87.5 $ 90.9 $ 91.2 $ 358.8 Non - GAAP R&D Expenses $ 22.9 $ 24.4 $ 24.4 $ 23.0 $ 94.6 Adjustments to SG&A Expenses: Amortization, stock - based compensation & other 15.9 16.2 15.8 15.0 62.5 Legal and acquisition - related 1.1 0.5 (0.8 ) (1.4 ) (0.3 ) Total Adjustments to SG&A Expenses 17.0 16.7 15.0 13.6 62.2 Non - GAAP SG&A Expenses $ 49.4 $ 46.4 $ 51.5 $ 54.6 $ 202.0 Non - GAAP Operating Expenses $ 72.3 $ 70.8 $ 75.9 $ 77.6 $ 296.6 * Tables may not foot due to rounding; amounts calculated based on dollars in thousands.

Thank You