Attached files
| file | filename |
|---|---|
| EX-99.1 - EXHIBIT 99.1 - Safehold Inc. | safereportsq318results.htm |
| 8-K - 8-K - Safehold Inc. | safe-09302018xpr8xk.htm |
Q3 ‘18 Earnings Results October 25, 2018 (NYSE: SAFE)
Forward-Looking Statements and Other Matters This release may contain forward-looking statements. All statements other than statements of historical fact are forward-looking statements. These forward-looking statements can be identified by the use of words such as “illustrative”, “representative”, “expect”, “plan”, “will”, “estimate”, “project”, “intend”, “believe”, and other similar expressions that do not relate to historical matters. These forward-looking statements reflect the Company’s current views about future events, and are subject to numerous known and unknown risks, uncertainties, assumptions and changes in circumstances that may cause Company’s actual results to differ significantly from those expressed in any forward-looking statement. The Company does not guarantee that the transactions and events described will happen as described (or that they will happen at all). The following factors, among others, could cause actual results and future events to differ materially from those set forth or contemplated in the forward-looking statements: market demand for ground lease capital; the Company’s ability to source new ground lease investments; risks that the rent adjustment clauses in the Company's leases will not adequately keep up with changes in market value and inflation; risks associated with certain tenant and industry concentrations in our initial portfolio; conflicts of interest and other risks associated with the Company's external management structure and its relationships with iStar and other significant investors; risks associated with using debt to fund the Company’s business activities (including changes in interest rates and/or credit spreads, and refinancing and interest rate risks); general risks affecting the real estate industry and local real estate markets (including, without limitation, the potential inability to enter into or renew ground leases at favorable rates, including with respect to contractual rate increases or participating rent); dependence on the creditworthiness of our tenants and their financial condition and operating performance; competition from other ground lease investors and risks associated with our failure to qualify for taxation as a REIT under the Internal Revenue Code of 1986, as amended. Please refer to the section entitled “Risk Factors” in our Annual Report on Form 10-K as amended for the year ended December 31, 2017 and any subsequent reports filed with the Securities and Exchange Commission (SEC) for further discussion of these and other investment considerations. The Company expressly disclaims any responsibility to update or revise forward-looking statements, whether as a result of new information, future events or otherwise, except as required by law. Note: Please refer to the Glossary at the end of this presentation for a list of defined terms and metrics. Investor Relations Contact Jason Fooks (212) 930-9400 investors@safetyincomegrowth.com Safety, Income & Growth Inc. The Ground Lease Company 1

I. Earnings Safety, Income & Growth Inc. The Ground Lease Company 2
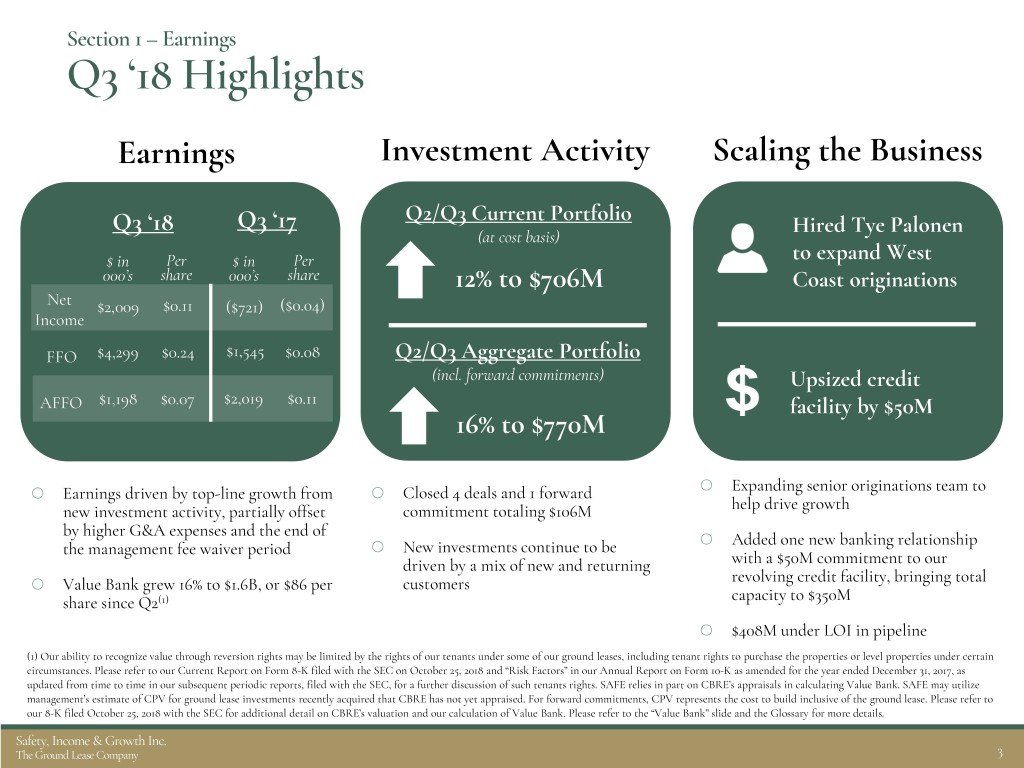
Section 1 – Earnings Q3 ‘18 Highlights Earnings Investment Activity Scaling the Business Q2/Q3 Current Portfolio Q3 ‘18 Q3 ‘17 Hired Tye Palonen (at cost basis) $ in Per $ in Per to expand West 000’s share 000’s share 12% to $706M Coast originations Net $2,009 $0.11 ($721) ($0.04) Income FFO $4,299 $0.24 $1,545 $0.08 Q2/Q3 Aggregate Portfolio (incl. forward commitments) Upsized credit AFFO $1,198 $0.07 $2,019 $0.11 facility by $50M 16% to $770M Earnings driven by top-line growth from Closed 4 deals and 1 forward Expanding senior originations team to new investment activity, partially offset commitment totaling $106M help drive growth by higher G&A expenses and the end of Added one new banking relationship the management fee waiver period New investments continue to be driven by a mix of new and returning with a $50M commitment to our Value Bank grew 16% to $1.6B, or $86 per customers revolving credit facility, bringing total share since Q2(1) capacity to $350M $408M under LOI in pipeline (1) Our ability to recognize value through reversion rights may be limited by the rights of our tenants under some of our ground leases, including tenant rights to purchase the properties or level properties under certain circumstances. Please refer to our Current Report on Form 8-K filed with the SEC on October 25, 2018 and “Risk Factors” in our Annual Report on Form 10-K as amended for the year ended December 31, 2017, as updated from time to time in our subsequent periodic reports, filed with the SEC, for a further discussion of such tenants rights. SAFE relies in part on CBRE’s appraisals in calculating Value Bank. SAFE may utilize management’s estimate of CPV for ground lease investments recently acquired that CBRE has not yet appraised. For forward commitments, CPV represents the cost to build inclusive of the ground lease. Please refer to our 8-K filed October 25, 2018 with the SEC for additional detail on CBRE’s valuation and our calculation of Value Bank. Please refer to the “Value Bank” slide and the Glossary for more details. Safety, Income & Growth Inc. The Ground Lease Company 3
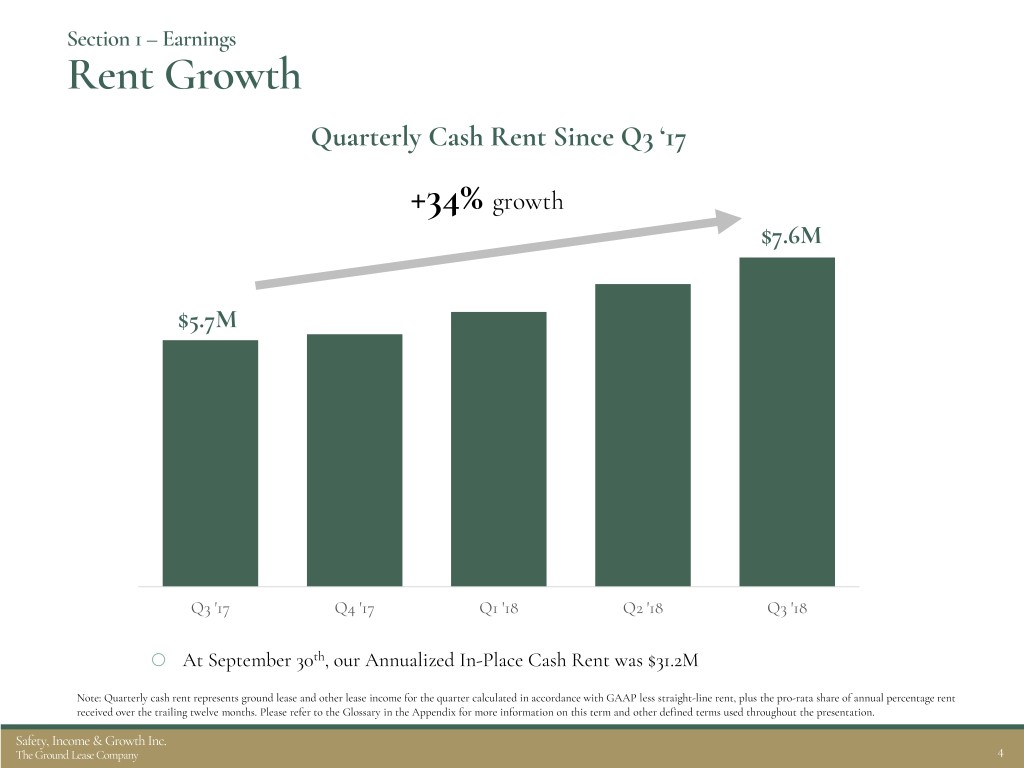
Section 1 – Earnings Rent Growth Quarterly Cash Rent Since Q3 ‘17 +34% growth $7.6M $5.7M Q3 '17 Q4 '17 Q1 '18 Q2 '18 Q3 '18 At September 30th, our Annualized In-Place Cash Rent was $31.2M Note: Quarterly cash rent represents ground lease and other lease income for the quarter calculated in accordance with GAAP less straight-line rent, plus the pro-rata share of annual percentage rent received over the trailing twelve months. Please refer to the Glossary in the Appendix for more information on this term and other defined terms used throughout the presentation. Safety, Income & Growth Inc. The Ground Lease Company 4
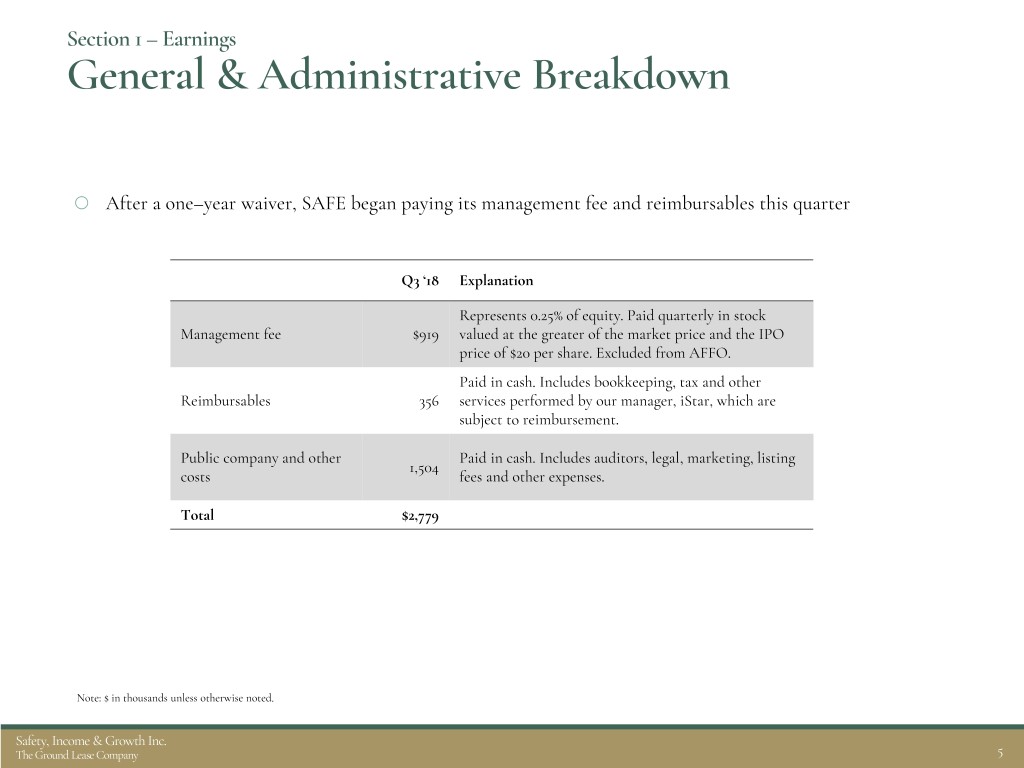
Section 1 – Earnings General & Administrative Breakdown After a one–year waiver, SAFE began paying its management fee and reimbursables this quarter Q3 ‘18 Explanation Represents 0.25% of equity. Paid quarterly in stock Management fee $919 valued at the greater of the market price and the IPO price of $20 per share. Excluded from AFFO. Paid in cash. Includes bookkeeping, tax and other Reimbursables 356 services performed by our manager, iStar, which are subject to reimbursement. Public company and other Paid in cash. Includes auditors, legal, marketing, listing 1,504 costs fees and other expenses. Total $2,779 Note: $ in thousands unless otherwise noted. Safety, Income & Growth Inc. The Ground Lease Company 5

Section 1 – Earnings Dividend Coverage $0.15 dividend was declared in the third quarter representing an annualized rate of $0.60 per share. $0.90 $0.80 $0.70 $0.60 $0.50 $0.40 $0.83 $0.30 $0.60 $0.60 $0.20 $0.33 $0.10 $0.00 TTM EPS TTM FFO TTM AFFO Annualized Dividend Note: $ amounts are given per share. Please refer to the “EPS, FFO & AFFO Reconciliation” slide in the Appendix for additional details. Safety, Income & Growth Inc. The Ground Lease Company 6
II. Portfolio Safety, Income & Growth Inc. The Ground Lease Company 7
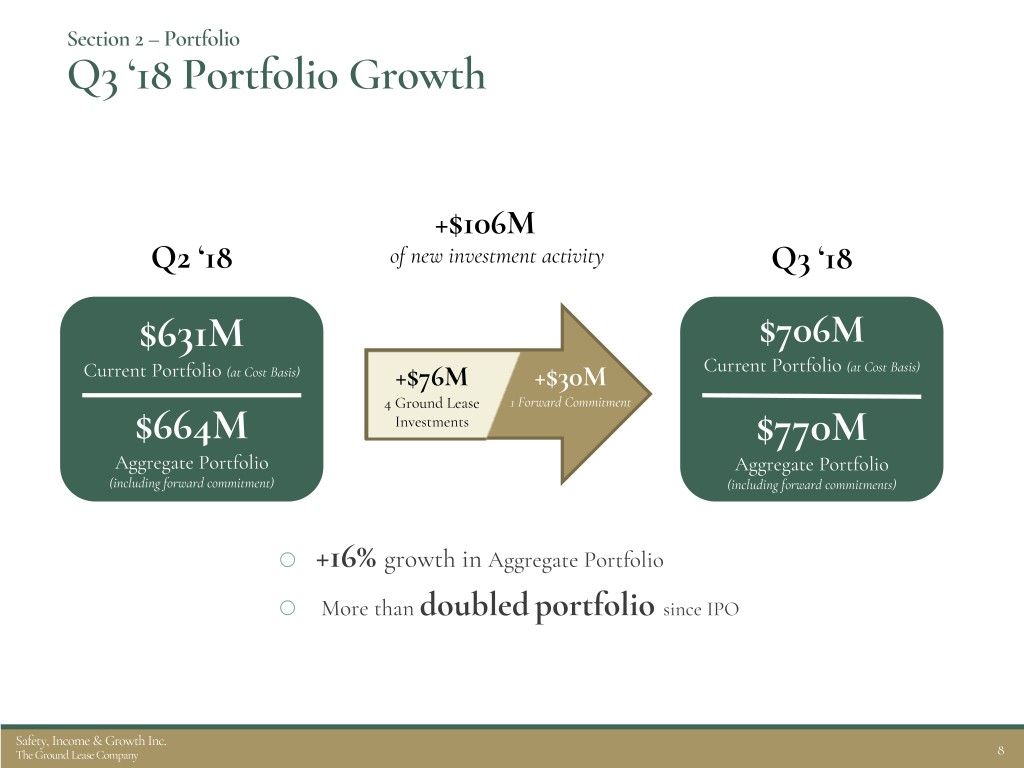
Section 2 – Portfolio Q3 ‘18 Portfolio Growth +$106M Q2 ‘18 of new investment activity Q3 ‘18 $631M $706M Current Portfolio (at Cost Basis) +$76M +$30M Current Portfolio (at Cost Basis) 4 Ground Lease 1 Forward Commitment $664M Investments $770M Aggregate Portfolio Aggregate Portfolio (including forward commitment) (including forward commitments) +16% growth in Aggregate Portfolio More than doubled portfolio since IPO Safety, Income & Growth Inc. The Ground Lease Company 8
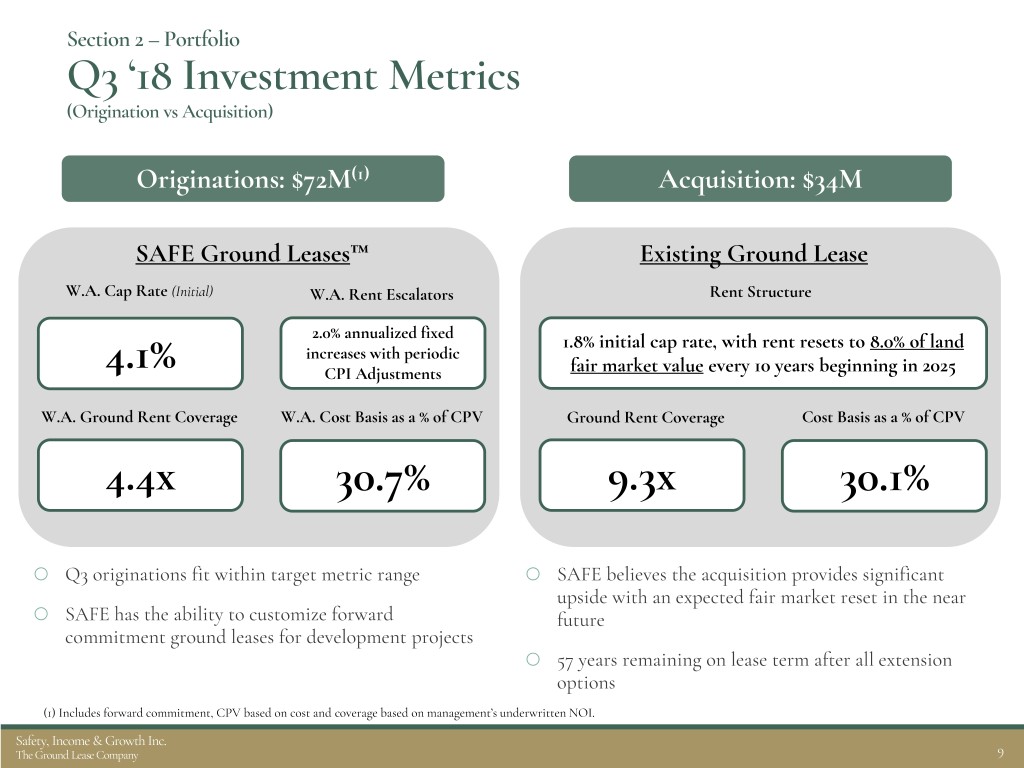
Section 2 – Portfolio Q3 ‘18 Investment Metrics (Origination vs Acquisition) Originations: $72M(1) Acquisition: $34M SAFE Ground Leases™ Existing Ground Lease W.A. Cap Rate (Initial) W.A. Rent Escalators Rent Structure 2.0% annualized fixed 1.8% initial cap rate, with rent resets to 8.0% of land increases with periodic 4.1% CPI Adjustments fair market value every 10 years beginning in 2025 W.A. Ground Rent Coverage W.A. Cost Basis as a % of CPV Ground Rent Coverage Cost Basis as a % of CPV 4.4x 30.7% 9.3x 30.1% Q3 originations fit within target metric range SAFE believes the acquisition provides significant upside with an expected fair market reset in the near SAFE has the ability to customize forward future commitment ground leases for development projects 57 years remaining on lease term after all extension options (1) Includes forward commitment, CPV based on cost and coverage based on management’s underwritten NOI. Safety, Income & Growth Inc. The Ground Lease Company 9
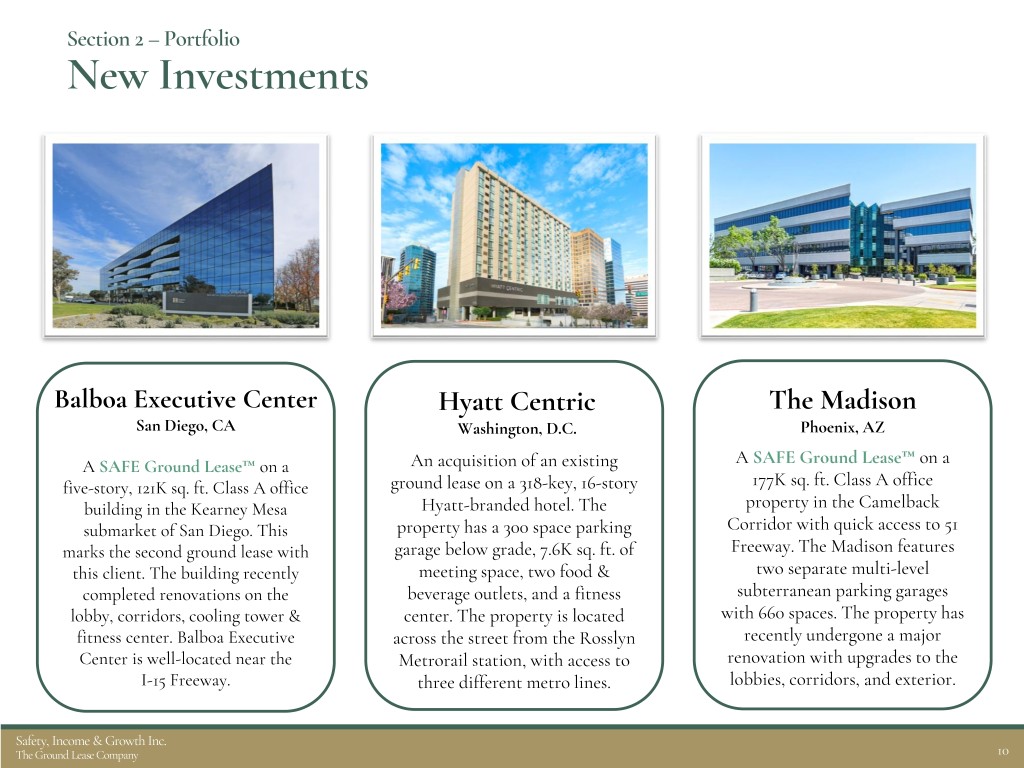
Section 2 – Portfolio New Investments Balboa Executive Center Hyatt Centric The Madison San Diego, CA Washington, D.C. Phoenix, AZ A SAFE Ground Lease™ on a An acquisition of an existing A SAFE Ground Lease™ on a five-story, 121K sq. ft. Class A office ground lease on a 318-key, 16-story 177K sq. ft. Class A office building in the Kearney Mesa Hyatt-branded hotel. The property in the Camelback submarket of San Diego. This property has a 300 space parking Corridor with quick access to 51 marks the second ground lease with garage below grade, 7.6K sq. ft. of Freeway. The Madison features this client. The building recently meeting space, two food & two separate multi-level completed renovations on the beverage outlets, and a fitness subterranean parking garages lobby, corridors, cooling tower & center. The property is located with 660 spaces. The property has fitness center. Balboa Executive across the street from the Rosslyn recently undergone a major Center is well-located near the Metrorail station, with access to renovation with upgrades to the I-15 Freeway. three different metro lines. lobbies, corridors, and exterior. Safety, Income & Growth Inc. The Ground Lease Company 10
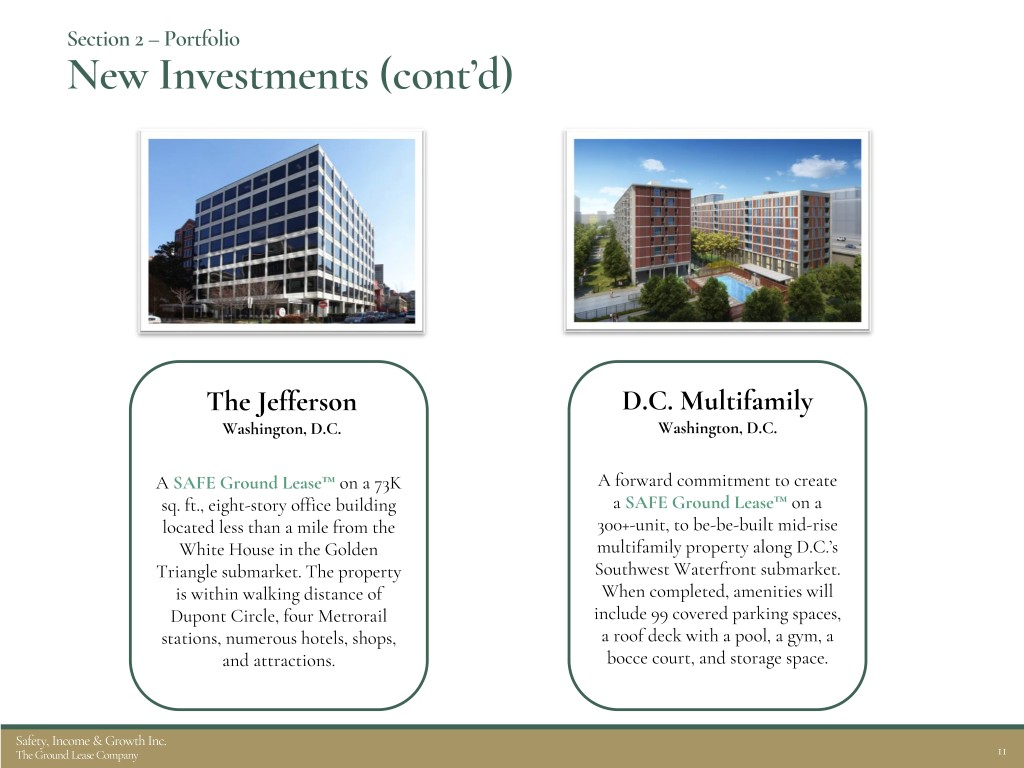
Section 2 – Portfolio New Investments (cont’d) The Jefferson D.C. Multifamily Washington, D.C. Washington, D.C. A SAFE Ground Lease™ on a 73K A forward commitment to create sq. ft., eight-story office building a SAFE Ground Lease™ on a located less than a mile from the 300+-unit, to be-be-built mid-rise White House in the Golden multifamily property along D.C.’s Triangle submarket. The property Southwest Waterfront submarket. is within walking distance of When completed, amenities will Dupont Circle, four Metrorail include 99 covered parking spaces, stations, numerous hotels, shops, a roof deck with a pool, a gym, a and attractions. bocce court, and storage space. Safety, Income & Growth Inc. The Ground Lease Company 11
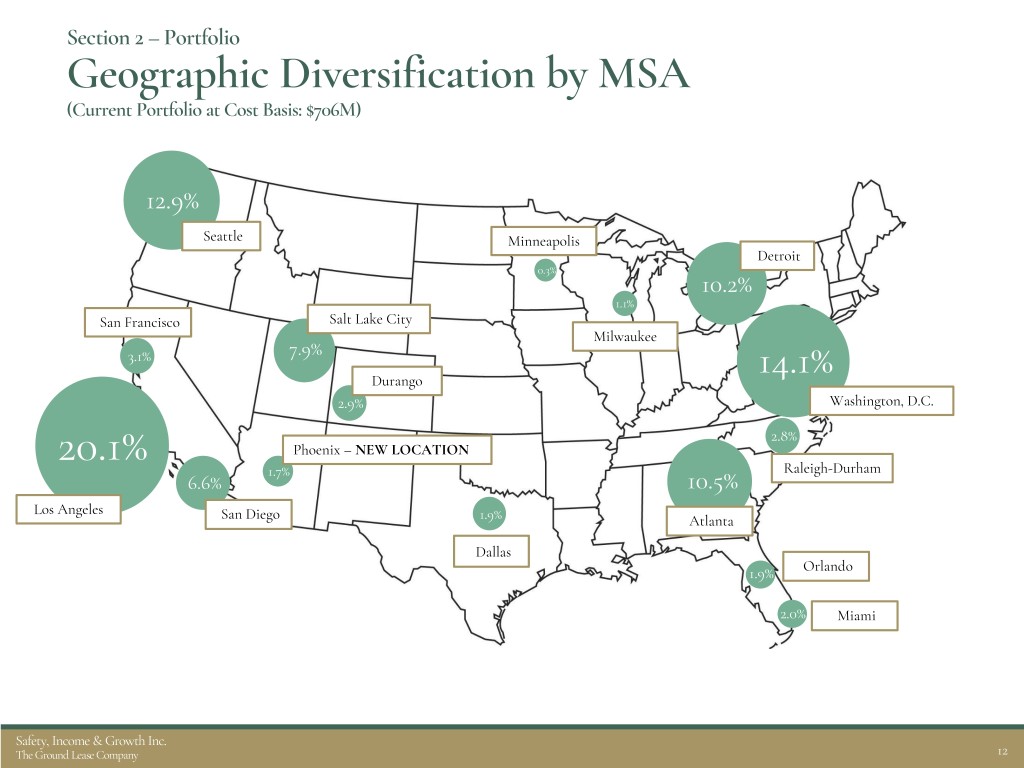
Section 2 – Portfolio Geographic Diversification by MSA (Current Portfolio at Cost Basis: $706M) 12.9% Seattle Minneapolis Detroit 0.3% 10.2% 1.1% San Francisco Salt Lake City Milwaukee 3.1% 7.9% Durango 14.1% 2.9% Washington, D.C. 2.8% 20.1% Phoenix – NEW LOCATION 1.7% Raleigh-Durham 6.6% 10.5% Los Angeles San Diego 1.9% Atlanta Dallas 1.9% Orlando 2.0% Miami Safety, Income & Growth Inc. The Ground Lease Company 12
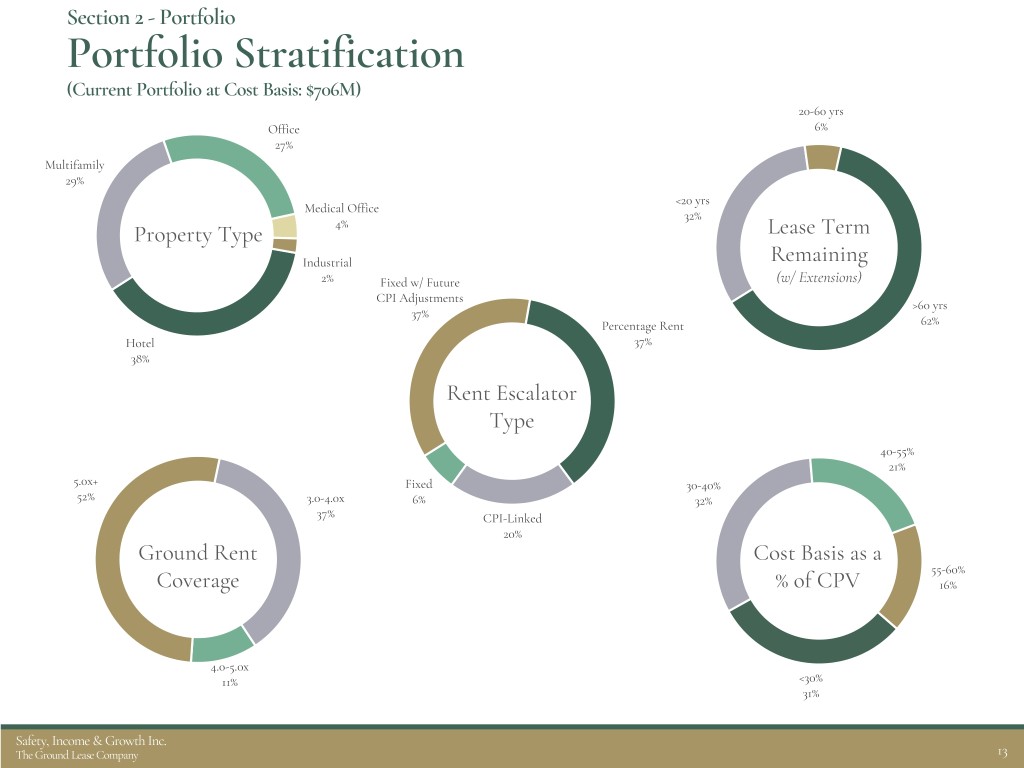
Section 2 - Portfolio Portfolio Stratification (Current Portfolio at Cost Basis: $706M) 20-60 yrs Office 6% 27% Multifamily 29% <20 yrs Medical Office 32% 4% Property Type Lease Term Industrial Remaining 2% Fixed w/ Future (w/ Extensions) CPI Adjustments >60 yrs 37% Percentage Rent 62% Hotel 37% 38% Rent Escalator Type 40-55% 21% 5.0x+ Fixed 30-40% 52% 3.0-4.0x 6% 32% 37% CPI-Linked 20% Ground Rent Cost Basis as a 55-60% Coverage % of CPV 16% 4.0-5.0x 11% <30% 31% Safety, Income & Growth Inc. The Ground Lease Company 13
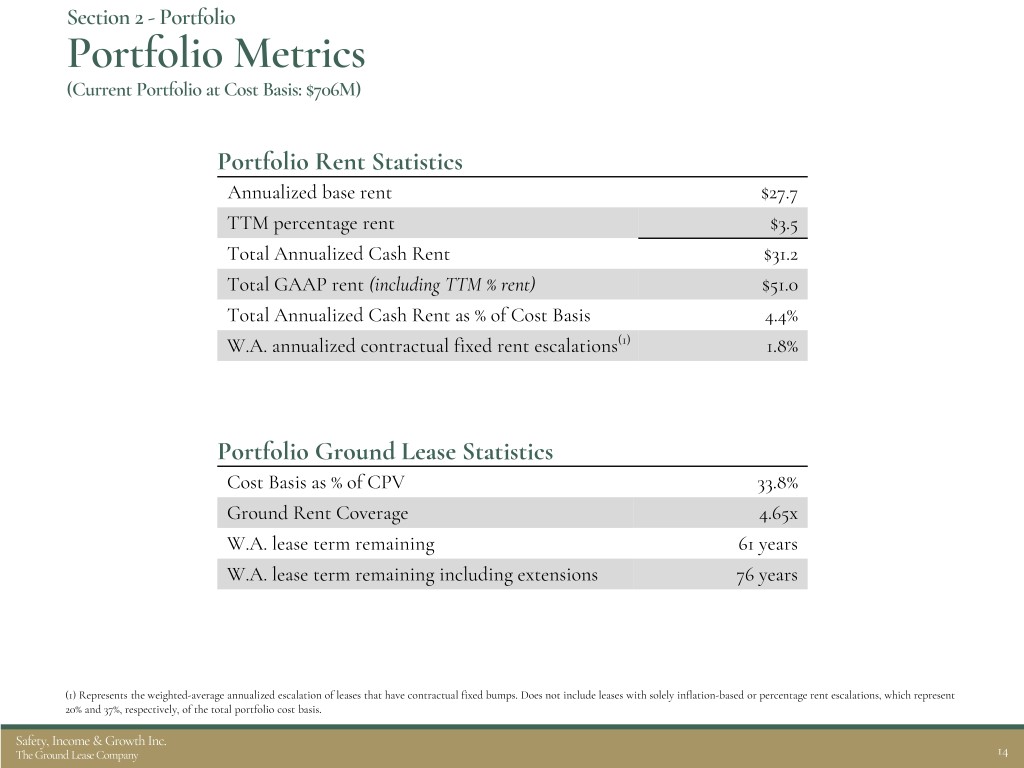
Section 2 - Portfolio Portfolio Metrics (Current Portfolio at Cost Basis: $706M) Portfolio Rent Statistics Annualized base rent $27.7 TTM percentage rent $3.5 Total Annualized Cash Rent $31.2 Total GAAP rent (including TTM % rent) $51.0 Total Annualized Cash Rent as % of Cost Basis 4.4% W.A. annualized contractual fixed rent escalations(1) 1.8% Portfolio Ground Lease Statistics Cost Basis as % of CPV 33.8% Ground Rent Coverage 4.65x W.A. lease term remaining 61 years W.A. lease term remaining including extensions 76 years (1) Represents the weighted-average annualized escalation of leases that have contractual fixed bumps. Does not include leases with solely inflation-based or percentage rent escalations, which represent 20% and 37%, respectively, of the total portfolio cost basis. Safety, Income & Growth Inc. The Ground Lease Company 14
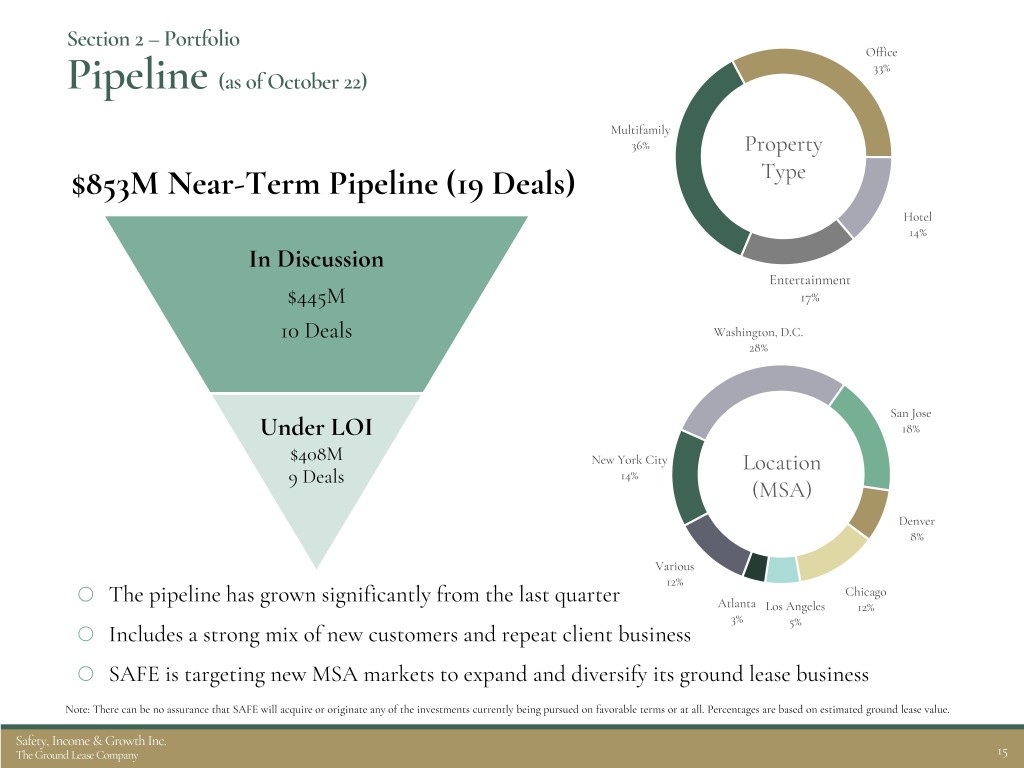
Section 2 – Portfolio Office 33% Pipeline (as of October 22) Multifamily 36% Property $853M Near-Term Pipeline (19 Deals) Type Hotel 14% In Discussion Entertainment $445M 17% 10 Deals Washington, D.C. 28% San Jose Under LOI 18% $408M New York City Location 9 Deals 14% (MSA) Denver 8% Various 12% The pipeline has grown significantly from the last quarter Chicago Atlanta Los Angeles 12% 3% 5% Includes a strong mix of new customers and repeat client business SAFE is targeting new MSA markets to expand and diversify its ground lease business Note: There can be no assurance that SAFE will acquire or originate any of the investments currently being pursued on favorable terms or at all. Percentages are based on estimated ground lease value. Safety, Income & Growth Inc. The Ground Lease Company 15
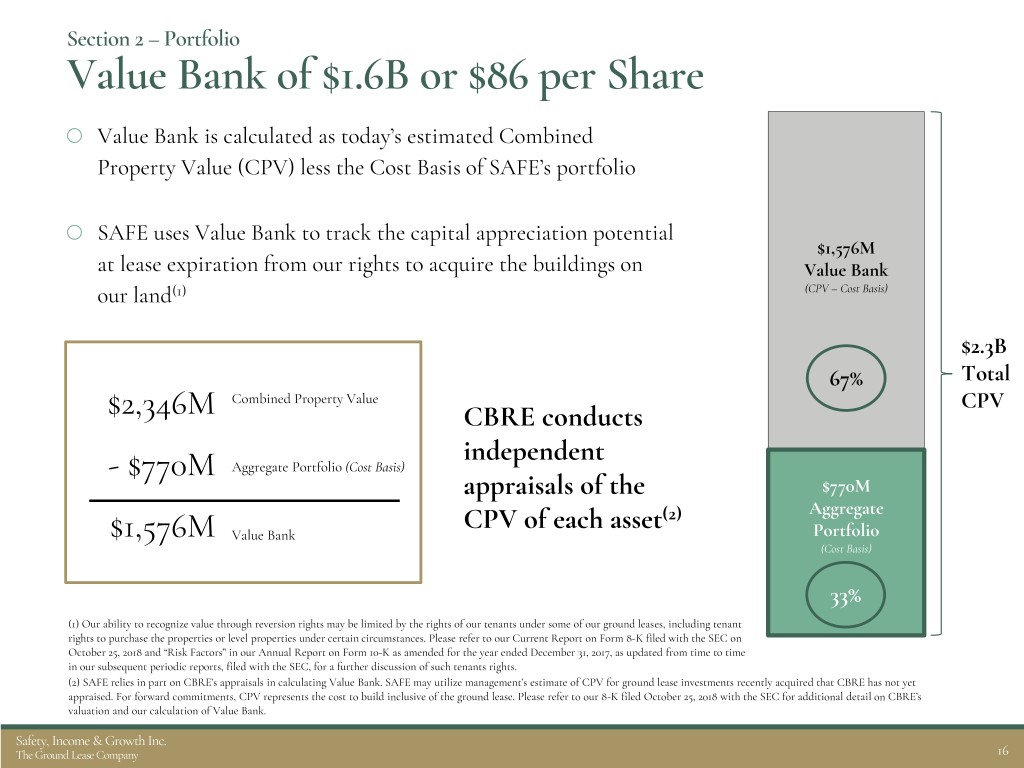
Section 2 – Portfolio Value Bank of $1.6B or $86 per Share Value Bank is calculated as today’s estimated Combined Property Value (CPV) less the Cost Basis of SAFE’s portfolio SAFE uses Value Bank to track the capital appreciation potential $1,576M at lease expiration from our rights to acquire the buildings on Value Bank our land(1) (CPV – Cost Basis) $2.3B 67% Total Combined Property Value CPV $2,346M CBRE conducts independent - $770M Aggregate Portfolio (Cost Basis) appraisals of the $770M CPV of each asset(2) Aggregate $1,576M Value Bank Portfolio (Cost Basis) 33% (1) Our ability to recognize value through reversion rights may be limited by the rights of our tenants under some of our ground leases, including tenant rights to purchase the properties or level properties under certain circumstances. Please refer to our Current Report on Form 8-K filed with the SEC on October 25, 2018 and “Risk Factors” in our Annual Report on Form 10-K as amended for the year ended December 31, 2017, as updated from time to time in our subsequent periodic reports, filed with the SEC, for a further discussion of such tenants rights. (2) SAFE relies in part on CBRE’s appraisals in calculating Value Bank. SAFE may utilize management’s estimate of CPV for ground lease investments recently acquired that CBRE has not yet appraised. For forward commitments, CPV represents the cost to build inclusive of the ground lease. Please refer to our 8-K filed October 25, 2018 with the SEC for additional detail on CBRE’s valuation and our calculation of Value Bank. Safety, Income & Growth Inc. The Ground Lease Company 16

III. Capital Structure Safety, Income & Growth Inc. The Ground Lease Company 17

Section 3 – Capital Structure Debt Overview As of September 30, 2018 Debt Maturity Profile Debt Profile 2022 (Principal Amt) (Effective Rate) $350(1) Jun.(1) $74 L+135 2023 $227(3) Undrawn (2) Revolver Jan. $71 3.04% $276 2027 Drawn $71(2) (3) Revolver Apr. $227 3.77% $74 Total $372 2018 2019 2020 2021 2022 2023 2024 2025 2026 2027 Upsized revolver by $50M in Q3, bringing total Leverage Metrics capacity to $350M Book Debt $371 Book Equity $369 Six banks now on credit line Leverage (Debt to Equity) 1.0x Combined Property Value (CPV) $2,346 Debt as a % of CPV 15.8% Target Leverage <2.0x Note: $ in millions. For additional information on our debt please refer to the 10-Q. Target Debt as a % of CPV 25% (1) Initial maturity is June 2020 with two 1-year extensions. (2) Callable without pre-payment penalty beginning January 2021. (3) April 2027 represents Anticipated Repayment Date. Final maturity is April 2028. Safety, Income & Growth Inc. The Ground Lease Company 18

Section 3 – Capital Structure $770M Interest Rate Protection Aggregate Portfolio As of September 30, 2018 $64M Forward Commitments The Company seeks to mitigate the impact of interest rate fluctuations by entering into hedges associated with each ground lease prior to taking on long-term debt The Company’s interest rate protection consists of: $515M $227M of long-term fixed-rate debt $79M of rate locked long-term fixed rate debt, but not yet closed $209M $209M of aggregate notional value of long-term rate lock hedges Long-Term $706M Rate Lock Hedges for prospective long-term financings on unlevered ground leases Cost Basis of Portfolio $79M Rate Locked Hedges sufficient to allow Company to leverage up to (not yet closed) debt/equity target of 2x with interest rate protection, with a weighted average of more than 10 years of interest rate protection on existing portfolio $227M Long-Term Fixed-Rate Debt Safety, Income & Growth Inc. The Ground Lease Company 19

Appendix Safety, Income & Growth Inc. The Ground Lease Company 20
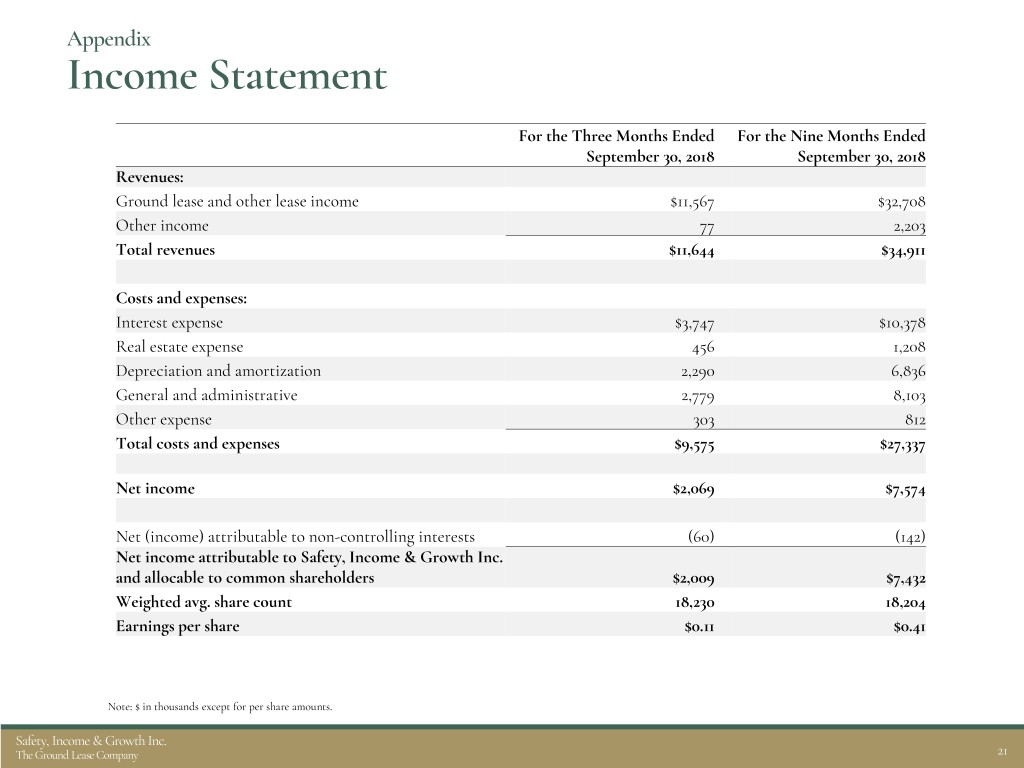
Appendix Income Statement For the Three Months Ended For the Nine Months Ended September 30, 2018 September 30, 2018 Revenues: Ground lease and other lease income $11,567 $32,708 Other income 77 2,203 Total revenues $11,644 $34,911 Costs and expenses: Interest expense $3,747 $10,378 Real estate expense 456 1,208 Depreciation and amortization 2,290 6,836 General and administrative 2,779 8,103 Other expense 303 812 Total costs and expenses $9,575 $27,337 Net income $2,069 $7,574 Net (income) attributable to non-controlling interests (60) (142) Net income attributable to Safety, Income & Growth Inc. and allocable to common shareholders $2,009 $7,432 Weighted avg. share count 18,230 18,204 Earnings per share $0.11 $0.41 Note: $ in thousands except for per share amounts. Safety, Income & Growth Inc. The Ground Lease Company 21

Appendix EPS, FFO & AFFO Reconciliation For the Three Months Ended For the Nine Months Ended Trailing Twelve September 30, 2018 September 30, 2018 Months Net income allocable to Safety, Income & Growth Inc. common shareholders $2,009 $7,432 $6,090 Add: Real estate related depreciation and amortization 2,290 6,836 9,102 FFO allocable to Safety, Income & Growth Inc. common shareholders $4,299 $14,268 $15,192 FFO allocable to Safety, Income & Growth Inc. common shareholders $4,299 $14,268 $15,192 Less: Straight-line rental income (5,179) (11,781) (13,456) Add: Amortization of real estate-related intangibles, net 692 1,709 2,131 Add: Non-cash management fee expense & stock based compensation 932 4,278 5,512 Add: Non-cash interest expense 414 1,124 1,363 Add: Allocable share of non-controlling interests’ depreciation, amortization and straight-line rental income 40 94 95 AFFO allocable to Safety, Income & Growth Inc. common shareholders $1,198 $9,692 $10,837 Weighted avg. share count 18,230 18,204 18,200 Earnings per share $0.11 $0.41 $0.33 FFO per share $0.24 $0.78 $0.83 AFFO per share $0.07 $0.53 $0.60 Note: $ in thousands except for per share amounts. Safety, Income & Growth Inc. The Ground Lease Company 22
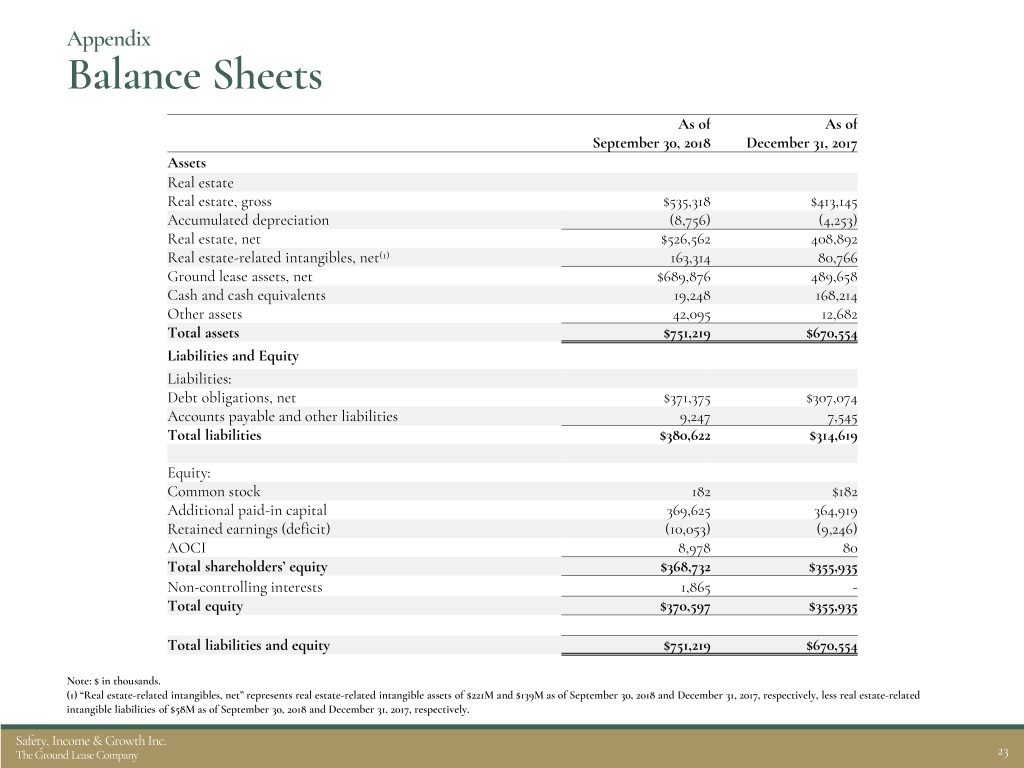
Appendix Balance Sheets As of As of September 30, 2018 December 31, 2017 Assets Real estate Real estate, gross $535,318 $413,145 Accumulated depreciation (8,756) (4,253) Real estate, net $526,562 408,892 Real estate-related intangibles, net(1) 163,314 80,766 Ground lease assets, net $689,876 489,658 Cash and cash equivalents 19,248 168,214 Other assets 42,095 12,682 Total assets $751,219 $670,554 Liabilities and Equity Liabilities: Debt obligations, net $371,375 $307,074 Accounts payable and other liabilities 9,247 7,545 Total liabilities $380,622 $314,619 Equity: Common stock 182 $182 Additional paid-in capital 369,625 364,919 Retained earnings (deficit) (10,053) (9,246) AOCI 8,978 80 Total shareholders’ equity $368,732 $355,935 Non-controlling interests 1,865 - Total equity $370,597 $355,935 Total liabilities and equity $751,219 $670,554 Note: $ in thousands. (1) “Real estate-related intangibles, net” represents real estate-related intangible assets of $221M and $139M as of September 30, 2018 and December 31, 2017, respectively, less real estate-related intangible liabilities of $58M as of September 30, 2018 and December 31, 2017, respectively. Safety, Income & Growth Inc. The Ground Lease Company 23

Appendix Cost Basis Reconciliation As of September 30, 2018 Real estate, net $526,562 Add: Accumulated depreciation 8,756 Real estate, gross $535,318 Add: Lease intangible assets, net 221,090 Add: Leasing costs, net 437 Add: Accumulated amortization 7,372 Less: Lease intangible liabilities, net (57,776) Cost Basis $706,441 Forward Commitments $63,959 Aggregate Portfolio $770,400 Note: $ in thousands. Safety, Income & Growth Inc. The Ground Lease Company 24
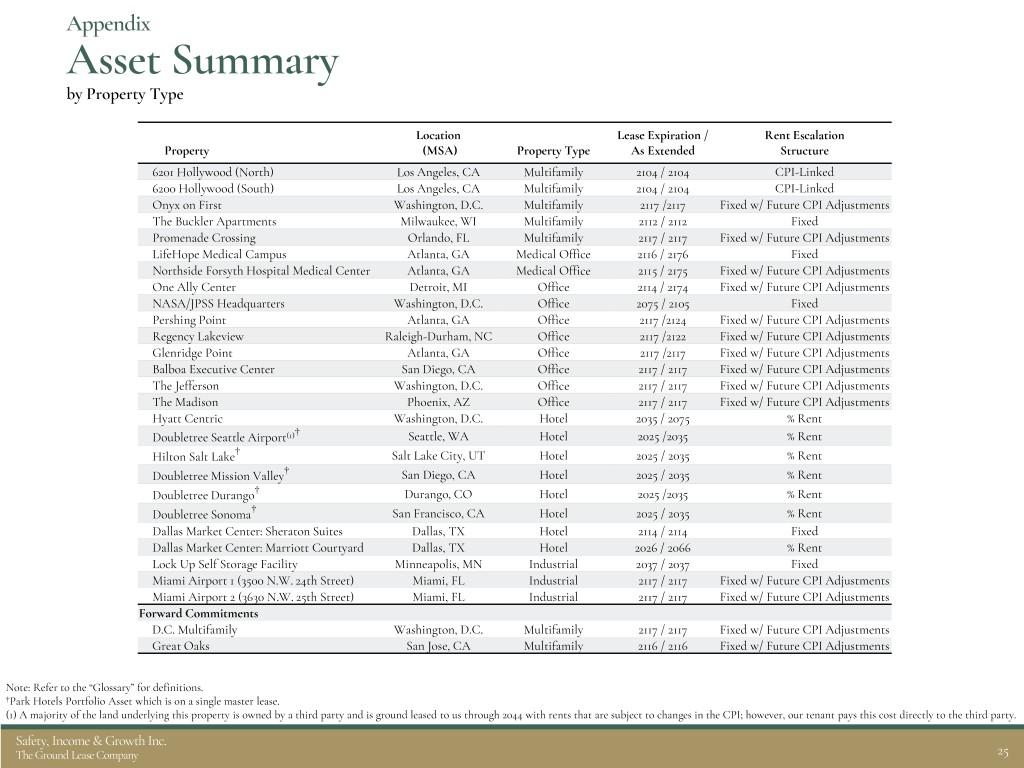
Appendix Asset Summary by Property Type Location Lease Expiration / Rent Escalation Property (MSA) Property Type As Extended Structure 6201 Hollywood (North) Los Angeles, CA Multifamily 2104 / 2104 CPI-Linked 6200 Hollywood (South) Los Angeles, CA Multifamily 2104 / 2104 CPI-Linked Onyx on First Washington, D.C. Multifamily 2117 /2117 Fixed w/ Future CPI Adjustments The Buckler Apartments Milwaukee, WI Multifamily 2112 / 2112 Fixed Promenade Crossing Orlando, FL Multifamily 2117 / 2117 Fixed w/ Future CPI Adjustments LifeHope Medical Campus Atlanta, GA Medical Office 2116 / 2176 Fixed Northside Forsyth Hospital Medical Center Atlanta, GA Medical Office 2115 / 2175 Fixed w/ Future CPI Adjustments One Ally Center Detroit, MI Office 2114 / 2174 Fixed w/ Future CPI Adjustments NASA/JPSS Headquarters Washington, D.C. Office 2075 / 2105 Fixed Pershing Point Atlanta, GA Office 2117 /2124 Fixed w/ Future CPI Adjustments Regency Lakeview Raleigh-Durham, NC Office 2117 /2122 Fixed w/ Future CPI Adjustments Glenridge Point Atlanta, GA Office 2117 /2117 Fixed w/ Future CPI Adjustments Balboa Executive Center San Diego, CA Office 2117 / 2117 Fixed w/ Future CPI Adjustments The Jefferson Washington, D.C. Office 2117 / 2117 Fixed w/ Future CPI Adjustments The Madison Phoenix, AZ Office 2117 / 2117 Fixed w/ Future CPI Adjustments Hyatt Centric Washington, D.C. Hotel 2035 / 2075 % Rent Doubletree Seattle Airport(1)† Seattle, WA Hotel 2025 /2035 % Rent Hilton Salt Lake† Salt Lake City, UT Hotel 2025 / 2035 % Rent Doubletree Mission Valley† San Diego, CA Hotel 2025 / 2035 % Rent Doubletree Durango† Durango, CO Hotel 2025 /2035 % Rent Doubletree Sonoma† San Francisco, CA Hotel 2025 / 2035 % Rent Dallas Market Center: Sheraton Suites Dallas, TX Hotel 2114 / 2114 Fixed Dallas Market Center: Marriott Courtyard Dallas, TX Hotel 2026 / 2066 % Rent Lock Up Self Storage Facility Minneapolis, MN Industrial 2037 / 2037 Fixed Miami Airport 1 (3500 N.W. 24th Street) Miami, FL Industrial 2117 / 2117 Fixed w/ Future CPI Adjustments Miami Airport 2 (3630 N.W. 25th Street) Miami, FL Industrial 2117 / 2117 Fixed w/ Future CPI Adjustments Forward Commitments D.C. Multifamily Washington, D.C. Multifamily 2117 / 2117 Fixed w/ Future CPI Adjustments Great Oaks San Jose, CA Multifamily 2116 / 2116 Fixed w/ Future CPI Adjustments Note: Refer to the “Glossary” for definitions. †Park Hotels Portfolio Asset which is on a single master lease. (1) A majority of the land underlying this property is owned by a third party and is ground leased to us through 2044 with rents that are subject to changes in the CPI; however, our tenant pays this cost directly to the third party. Safety, Income & Growth Inc. The Ground Lease Company 25

Appendix Glossary Calculated by adding (or subtracting) to FFO the following items: straight-line rental income, the amortization of real Adjusted Funds from Operations (AFFO) estate-related intangibles, stock-based compensation, acquisition costs, non-cash management fees, and expense reimbursements, the amortization of deferred financing costs and other expenses related to debt obligations. Aggregate Portfolio Represents the Current Portfolio plus forward commitments. Annualized Cash Rent Calculated as the annualized in-place Cash Rent at quarter-end plus the trailing 12-month percentage rent. Cash Rent Represents ground lease income recorded for a period excluding straight-line rent and amortization of lease intangibles. Represents the historical purchase price of an asset, comprised of the cost of real estate and real estate related intangibles. Cost Basis For forward commitments, Cost Basis represents the contractual purchase price to be paid. Calculated as Cost Basis divided by CPV. The Company believes the metric is an indicative measure of the safety of its Cost Basis as % of CPV position in a real estate property’s capital structure and represents its last-dollar economic exposure to the underlying property values. The current combined value of the land, buildings and improvements relating to a commercial property, as if there was no ground lease on the land at the property. CPV is based on independent appraisals by CBRE. The Company will use Combined Property Value (CPV) management estimates for recently acquired and originated ground leases for which appraisals from CBRE are not yet available. In relation to forward commitments, CPV represents the total cost associated with the acquisition, development, and construction of the project. Represents the portfolio of assets owned currently, utilizing Cost Basis as the measure of value. Does not include forward Current Portfolio commitments. Disclaimer: Set forth in the Glossary are the current definitions of certain items that we use in this presentation. This Glossary is intended to facilitate a reader’s understanding of this presentation. There can be no assurance that we will not modify these terms in future presentations as we deem necessary or appropriate. Safety, Income & Growth Inc. The Ground Lease Company 26
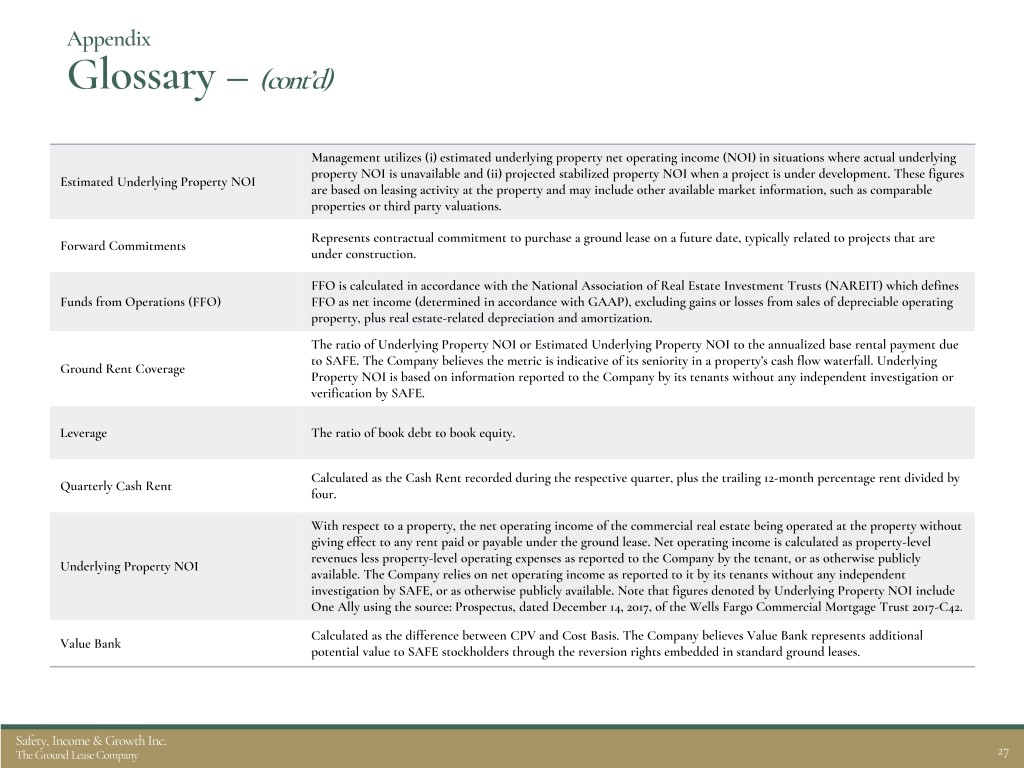
Appendix Glossary – (cont’d) Management utilizes (i) estimated underlying property net operating income (NOI) in situations where actual underlying property NOI is unavailable and (ii) projected stabilized property NOI when a project is under development. These figures Estimated Underlying Property NOI are based on leasing activity at the property and may include other available market information, such as comparable properties or third party valuations. Represents contractual commitment to purchase a ground lease on a future date, typically related to projects that are Forward Commitments under construction. FFO is calculated in accordance with the National Association of Real Estate Investment Trusts (NAREIT) which defines Funds from Operations (FFO) FFO as net income (determined in accordance with GAAP), excluding gains or losses from sales of depreciable operating property, plus real estate-related depreciation and amortization. The ratio of Underlying Property NOI or Estimated Underlying Property NOI to the annualized base rental payment due to SAFE. The Company believes the metric is indicative of its seniority in a property’s cash flow waterfall. Underlying Ground Rent Coverage Property NOI is based on information reported to the Company by its tenants without any independent investigation or verification by SAFE. Leverage The ratio of book debt to book equity. Calculated as the Cash Rent recorded during the respective quarter, plus the trailing 12-month percentage rent divided by Quarterly Cash Rent four. With respect to a property, the net operating income of the commercial real estate being operated at the property without giving effect to any rent paid or payable under the ground lease. Net operating income is calculated as property-level revenues less property-level operating expenses as reported to the Company by the tenant, or as otherwise publicly Underlying Property NOI available. The Company relies on net operating income as reported to it by its tenants without any independent investigation by SAFE, or as otherwise publicly available. Note that figures denoted by Underlying Property NOI include One Ally using the source: Prospectus, dated December 14, 2017, of the Wells Fargo Commercial Mortgage Trust 2017-C42. Calculated as the difference between CPV and Cost Basis. The Company believes Value Bank represents additional Value Bank potential value to SAFE stockholders through the reversion rights embedded in standard ground leases. Safety, Income & Growth Inc. The Ground Lease Company 27
