Attached files
| file | filename |
|---|---|
| EX-99.1 - PRESS RELEASE - Midland States Bancorp, Inc. | exh_991.htm |
| 8-K - FORM 8-K - Midland States Bancorp, Inc. | f8k_102518.htm |
EXHIBIT 99.2

Midland States Bancorp, Inc. NASDAQ: MSBI Third Quarter 2018 Earnings Call

2 Forward - Looking Statements. This presentation may contain forward - looking statements within the meaning of the federal securities laws. Forward - looking statements express management’s current expectations, forecasts of future events or long - term goals, and may be based upon beliefs, expectations and assumptions of Midland’s management, are generally identifiable by the use of words such as “believe,” “expect,” “anticipate,” “plan,” “intend,” “estimate,” “may,” “will,” “would,” “could,” “shoul d” or other similar expressions. All statements in this presentation speak only as of the date they are made, and Midland undertakes no obligation to update any statement. A number of factors, many of which are beyond the ability of Midland to control or predic t, could cause actual results to differ materially from those in its forward - looking statements. These risks and uncertainties sho uld be considered in evaluating forward - looking statements and undue reliance should not be placed on such statements. Additional information concerning Midland and its respective businesses, including additional factors that could materially affect Midla nd’ s financial results, are included in Midland’s filings with the Securities and Exchange Commission. Use of Non - GAAP Financial Measures. This presentation contains certain financial information determined by methods other than in accordance with accounting principles generally accepted in the United States (“GAAP”). These non - GAAP financial measures include “Adjusted Earnings,” “Adjusted Diluted Earnings Per Share,” “Adjusted Return on Average Assets,” “Adjusted Return on Average Shareholders’ Equity,” “Adjusted Return on Average Tangible Common Equity,” “Efficiency Ratio,” “Tangible Common Equity to Tangible Assets,” “Tangible Book Value Per Share” and “Return on Average Tangible Common Equity.” The Company believes that these non - GAAP financial measures provide both management and investors a more complete understanding of the Company’s funding profile and profitability. These non - GAAP financial measures are supplemental and are not a substitute for any analysis based on GAAP financial measures. The Company believes that these non - GAAP financial measures provide both management and investors a more complete understanding of the Company’s funding profile and profitability. These non - GAAP financial measures are supplemental and are not a substitute for any analysis based on GAAP financial measures. Not all companies use the same calculation of these measures; therefore this presentation may not be comparable to other similarly titled measures as presented by other companies. Reconciliations of these non - GAAP measures are provided in the Appendix section of this presentation.
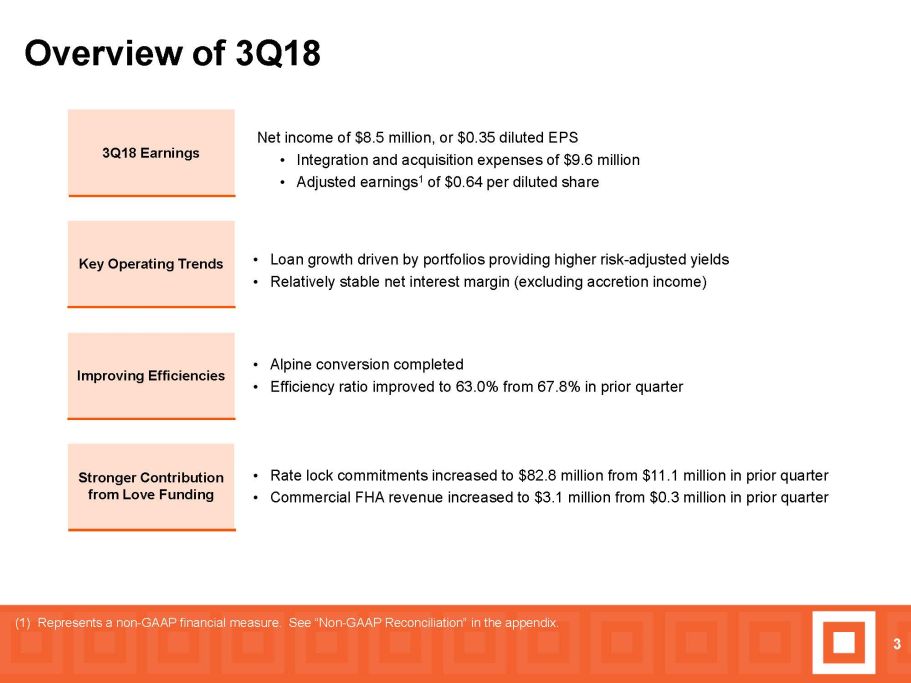
Overview of 3Q18 3 Improving Efficiencies 3Q18 Earnings Stronger Contribution from Love Funding • Alpine conversion completed • Efficiency ratio improved to 63.0% from 67.8% in prior quarter • Rate lock commitments increased to $82.8 million from $11.1 million in prior quarter • Commercial FHA revenue increased to $3.1 million from $0.3 million in prior quarter Key Operating Trends • Loan growth driven by portfolios providing higher risk - adjusted yields • Relatively stable net interest margin (excluding accretion income) (1) Represents a non - GAAP financial measure. See “Non - GAAP Reconciliation” in the appendix. Net income of $8.5 million, or $0.35 diluted EPS • Integration and acquisition expenses of $9.6 million • Adjusted earnings 1 of $0.64 per diluted share

Loan Portfolio Total Loans 4 • Total loan growth of $60.5 million or 5.9% annualized • Strongest growth in commercial loans and leases, and consumer lending • Equipment loan and lease financings increased $45.9 million, or 17.3%, from June 30, 2018 with YTD growth of $105.7 million, or 51.4% • Remixing of loan portfolio resulting in lower residential real estate loan balances Loan Portfolio Mix (in millions, as of quarter - end) (in millions, as of quarter - end) 3Q 2018 2Q 2018 3Q 2017 Commercial loans and leases $ 1,035 $ 991 $ 714 Commercial real estate 1,712 1,711 1,472 Construction and land development 239 248 183 Residential real estate 586 602 446 Consumer 584 544 343 Total $ 4,156 $ 4,096 $ 3,158 $3,158 $3,227 $4,029 $4,096 3Q 2017 4Q 2017 1Q 2018 2Q 2018 3Q 2018 $4,156

Total Deposits Total Deposits 5 • Total deposits decreased $16.7 million to $4.14 billion • Decline in deposits attributable to expected attrition in Alpine deposit base following system conversion and focus on managing deposit costs • $ 23.4 million increase in interest - bearing checking accounts Deposit Mix (in millions, as of quarter - end) (in millions, as of quarter - end) 3Q 2018 2Q 2018 3Q 2017 Noninterest - bearing demand $ 991 $ 1,002 $ 674 Interest - bearing: Checking 1,048 1,025 801 Money market 836 844 634 Savings 446 461 279 Time 634 638 494 Brokered 189 191 233 Total deposits $ 4,143 $ 4,160 $ 3,114 $3,114 $3,131 $4,234 $4,160 $4,143 3Q 2017 4Q 2017 1Q 2018 2Q 2018 3Q 2018

$3.48 $3.59 $4.08 $5.32 $5.47 3Q 2017 4Q 2017 1Q 2018 2Q 2018 3Q 2018 $2,001 $2,051 $3,125 $3,189 $3,218 3Q 2017 4Q 2017 1Q 2018 2Q 2018 3Q 2018 • Total Wealth Management revenue increased 2.8% from the prior quarter • Year - over - year organic growth in assets under administration was $135.7 million, or 6.8%, excluding Alpine acquisition Wealth Management Wealth Management Revenue 6 Assets Under Administration (in millions) (in millions)

0.27% 0.26% 0.16% 0.40% 0.10% 3.78% 3.73% 3.69% 3.91% 3.59% 3Q 2017 4Q 2017 1Q 2018 2Q 2018 3Q 2018 NIM Accretion Income • Net interest income and margin decreased due to lower accretion income • Excluding the impact of accretion income, net interest margin declined 2 bps • Expected scheduled accretion income following finalization of purchase accounting for Alpine: » $2.0 - $2.5 million in 4Q18; $7.0 - $7.5 million in FY 2019 Net Interest Income/Margin Net Interest Margin 7 Net Interest Income (in millions) $5.9 $2.6 $4.4 $1.9 $4.9 $3.0 $2.7 $2.0 $5.5 $1.7 $36.8 $36.0 $38.2 $48.3 $45.1 3Q 2017 4Q 2017 1Q 2018 2Q 2018 3Q 2018 NII Accretion Income
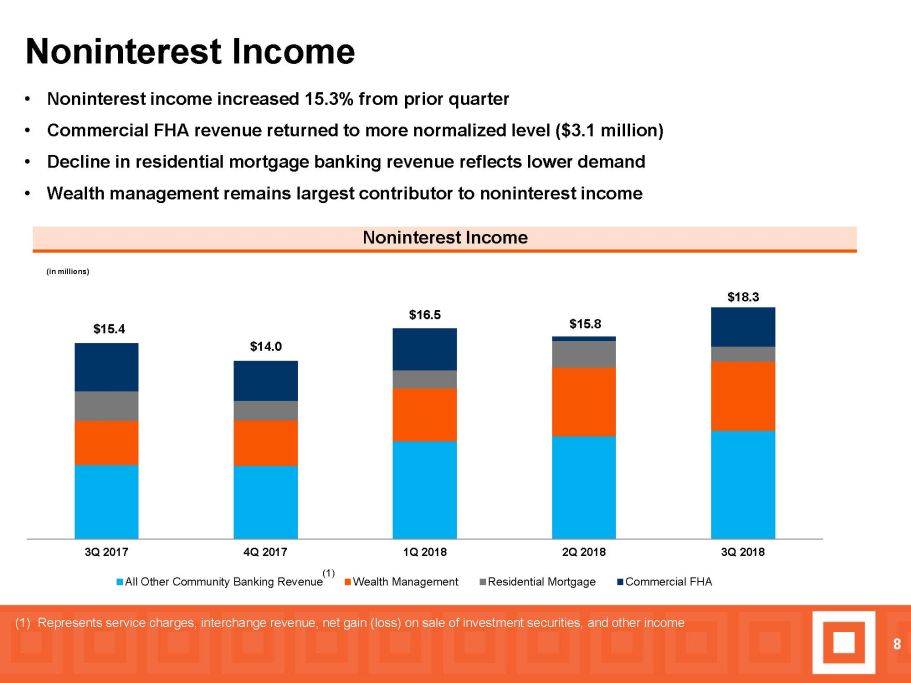
Noninterest Income 8 • Noninterest income increased 15.3% from prior quarter • Commercial FHA revenue returned to more normalized level ($3.1 million) • Decline in residential mortgage banking revenue reflects lower demand • Wealth management remains largest contributor to noninterest income Noninterest Income (in millions) $ 15.4 $14.0 $16.5 $15.8 $18.3 3Q 2017 4Q 2017 1Q 2018 2Q 2018 3Q 2018 All Other Community Banking Revenue Wealth Management Residential Mortgage Commercial FHA (1) Represents service charges, interchange revenue, net gain (loss) on sale of investment securities, and other income (1)

Noninterest Expense and Operating Efficiency 9 • Efficiency Ratio 1 was 63.0% in 3Q18 vs. 67.8% in 2Q18 • Integration and acquisition related expenses » $9.6 million in 3Q18 » $2.0 million in 2Q18 • Loss on mortgage servicing rights held for sale » $0.3 million in 3Q18 » $0.2 million in 2Q18 • Excluding these items, noninterest expense decreased 8.5% on a linked - quarter basis • 2019 quarterly run - rate for noninterest expense projected to be approximately $43 million Noninterest Expense and Efficiency Ratio 1 (Noninterest expense in millions) $50.3 $48.4 $36.2 $49.5 $46.5 $11.9 $3.1 $11.9 $2.2 $9.8 69.0% 64.6% 68.4% 67.8% 63.0% 3Q 2017 4Q 2017 1Q 2018 2Q 2018 3Q 2018 Total Noninterest Expense Adjustments to Noninterest Expense Efficiency Ratio (1) Represents a non - GAAP financial measure. See “Non - GAAP Reconciliation” in the appendix.

Asset Quality NCO / Average Loans 10 • Increase in nonperforming loans primarily attributable to the downgrade of two commercial loans and one commercial real estate loan • Continued low level of charge - offs • Provision for loan losses of $2.1 million in 3Q18 • ALLL/total loans of 0.47% and credit marks/total loans of 0.59% at September 30, 2018 Nonperforming Loans / Total Loans (Total Loans as of quarter - end) 1.06% 0.83% 0.66% 0.69% 0.93% 3Q 2017 4Q 2017 1Q 2018 2Q 2018 3Q 2018 0.01% 0.81% 0.09% 0.13% 0.07% 3Q 2017 4Q 2017 1Q 2018 2Q 2018 3Q 2018

Outlook • Realization of additional operating leverage expected to drive higher level of profitability in 2019 • Continued discipline in balance sheet growth to manage liquidity and protect net interest margin • Loan production will remain focused on areas with most attractive risk - adjusted yields • CEO succession plan » Leon Holschbach to retire from CEO position on December 31, 2018 » Jeffrey Ludwig to assume role of CEO of Midland States Bancorp 11

APPENDIX

13 Adjusted Earnings Reconciliation (dollars in thousands, except per share data) Income before income taxes - GAAP $ 10,933 $ 15,827 $ 3,182 $ 7,766 $ 2,316 Adjustments to noninterest income: (Loss) gain on sales of investment securities, net - (70) 65 2 98 Other (12) (48) 150 37 45 Total adjustments to noninterest income (12) (118) 215 39 143 Adjustments to noninterest expense: Loss on mortgage servicing rights held for sale 270 188 - 442 3,617 Integration and acquisition expenses 9,559 2,019 11,884 2,686 8,303 Total adjustments to noninterest expense 9,829 2,207 11,884 3,128 11,920 Adjusted earnings pre tax 20,774 18,152 14,851 10,855 14,093 Adjusted earnings tax 5,142 3,683 4,586 6,992 4,920 Revaluation of net deferred tax assets - - - (4,540) - Adjusted earnings - non-GAAP 15,632 14,469 10,265 8,403 9,173 Preferred stock dividends, net 35 36 36 37 27 Adjusted earnings available to common shareholders - non-GAAP $ 15,597 $ 14,433 $ 10,229 $ 8,366 $ 9,146 Adjusted diluted earnings per common share $ 0.64 $ 0.59 $ 0.48 $ 0.42 $ 0.46 Adjusted return on average assets 1.09 % 1.03 % 0.87 % 0.76 % 0.82 % Adjusted return on average shareholders' equity 10.45 % 9.93 % 8.34 % 7.34 % 8.03 % Adjusted return on average tangible common equity 16.02 % 15.27 % 11.86 % 9.88 % 10.83 % 2018 2018 2018 2017 2017 September 30, June 30, March 31, December 31, September 30, MIDLAND STATES BANCORP, INC.RECONCILIATIONS OF NON-GAAP FINANCIAL MEASURES For the Quarter Ended

14 Efficiency Ratio Reconciliation (dollars in thousands) Noninterest expense - GAAP $ 50,317 $ 46,452 $ 49,499 $ 36,192 $ 48,363 Loss on mortgage servicing rights held for sale (270) (188) - (442) (3,617) Integration and acquisition expenses (9,559) (2,019) (11,884) (2,686) (8,303) Adjusted noninterest expense $ 40,488 $ 44,245 $ 37,615 $ 33,064 $ 36,443 Net interest income - GAAP $ 45,081 $ 48,286 $ 38,185 $ 36,036 $ 36,765 Effect of tax-exempt income 585 541 394 659 687 Adjusted net interest income 45,666 48,827 38,579 36,695 37,452 Noninterest income - GAAP $ 18,272 $ 15,847 $ 16,502 $ 13,998 $ 15,403 Mortgage servicing rights impairment 297 500 133 494 104 Loss (gain) on sales of investment securities, net - 70 (65) (2) (98) Other 12 48 (150) (37) (45) Adjusted noninterest income 18,581 16,465 16,420 14,453 15,364 Adjusted total revenue $ 64,247 $ 65,292 $ 54,999 $ 51,148 $ 52,816 Efficiency ratio 63.02 % 67.76 % 68.39 % 64.64 % 69.00 % 2018 2018 2018 2017 2017 September 30, June 30, March 31, December 31, September 30, MIDLAND STATES BANCORP, INC.RECONCILIATIONS OF NON-GAAP FINANCIAL MEASURES (continued) For the Quarter Ended
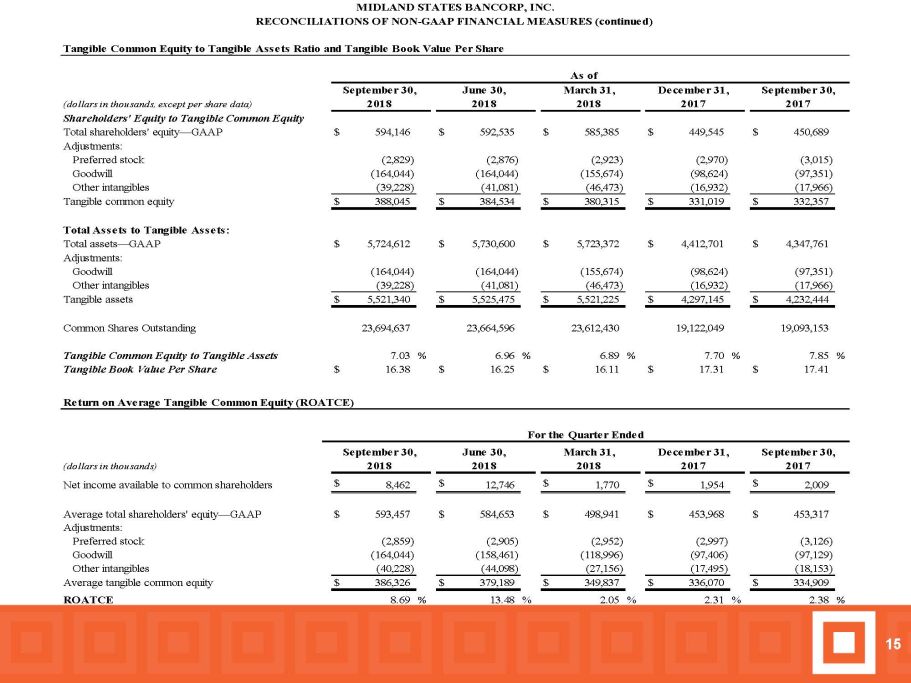
15 Tangible Common Equity to Tangible Assets Ratio and Tangible Book Value Per Share (dollars in thousands, except per share data) Shareholders' Equity to Tangible Common Equity Total shareholders' equity—GAAP $ 594,146 $ 592,535 $ 585,385 $ 449,545 $ 450,689 Adjustments: Preferred stock (2,829) (2,876) (2,923) (2,970) (3,015) Goodwill (164,044) (164,044) (155,674) (98,624) (97,351) Other intangibles (39,228) (41,081) (46,473) (16,932) (17,966) Tangible common equity $ 388,045 $ 384,534 $ 380,315 $ 331,019 $ 332,357 Total Assets to Tangible Assets: Total assets—GAAP $ 5,724,612 $ 5,730,600 $ 5,723,372 $ 4,412,701 $ 4,347,761 Adjustments: Goodwill (164,044) (164,044) (155,674) (98,624) (97,351) Other intangibles (39,228) (41,081) (46,473) (16,932) (17,966) Tangible assets $ 5,521,340 $ 5,525,475 $ 5,521,225 $ 4,297,145 $ 4,232,444 Common Shares Outstanding 23,694,637 23,664,596 23,612,430 19,122,049 19,093,153 Tangible Common Equity to Tangible Assets 7.03 % 6.96 % 6.89 % 7.70 % 7.85 % Tangible Book Value Per Share $ 16.38 $ 16.25 $ 16.11 $ 17.31 $ 17.41 Return on Average Tangible Common Equity (ROATCE) (dollars in thousands) Net income available to common shareholders $ 8,462 $ 12,746 $ 1,770 $ 1,954 $ 2,009 Average total shareholders' equity—GAAP $ 593,457 $ 584,653 $ 498,941 $ 453,968 $ 453,317 Adjustments: Preferred stock (2,859) (2,905) (2,952) (2,997) (3,126) Goodwill (164,044) (158,461) (118,996) (97,406) (97,129) Other intangibles (40,228) (44,098) (27,156) (17,495) (18,153) Average tangible common equity $ 386,326 $ 379,189 $ 349,837 $ 336,070 $ 334,909 ROATCE 8.69 % 13.48 % 2.05 % 2.31 % 2.38 % September 30, June 30, March 31, December 31, September 30, 2018 2018 2018 2017 2017 For the Quarter Ended MIDLAND STATES BANCORP, INC. RECONCILIATIONS OF NON-GAAP FINANCIAL MEASURES (continued) As of September 30, June 30, March 31, December 31, September 30, 2018 2018 2018 2017 2017