Attached files
| file | filename |
|---|---|
| 8-K - 8-K - CMS ENERGY CORP | a18-37172_28k.htm |
CMS limE NYSE. Third Quarter 2018 Results and Outlook October 25, 2018 FOCUSED ON WORLD CLASS PERFORMANCE

This presentation is made as of the date hereof and contains “forward-looking statements” as defined in Rule 3b-6 of the Securities Exchange Act of 1934, Rule 175 of the Securities Act of 1933, and relevant legal decisions. The forward-looking statements are subject to risks and uncertainties. All forward-looking statements should be considered in the context of the risk and other factors detailed from time to time in CMS Energy’s and Consumers Energy’s Securities and Exchange Commission filings. Forward-looking statements should be read in conjunction with “FORWARD-LOOKING STATEMENTS AND INFORMATION” and “RISK FACTORS” sections of CMS Energy’s and Consumers Energy’s most recent Form 10-K and as updated in reports CMS Energy and Consumers Energy file with the Securities and Exchange Commission. CMS Energy’s and Consumers Energy’s “FORWARD-LOOKING STATEMENTS AND INFORMATION” and “RISK FACTORS” sections are incorporated herein by reference and discuss important factors that could cause CMS Energy’s and Consumers Energy’s results to differ materially from those anticipated in such statements. CMS Energy and Consumers Energy undertake no obligation to update any of the information presented herein to reflect facts, events or circumstances after the date hereof. The presentation also includes non-GAAP measures when describing CMS Energy’s results of operations and financial performance. A reconciliation of each of these measures to the most directly comparable GAAP measure is included in the appendix and posted on our website at www.cmsenergy.com. CMS Energy provides historical financial results on both a reported (GAAP) and adjusted (non-GAAP) basis and provides forward-looking guidance on an adjusted basis. During an oral presentation, references to “earnings” are on an adjusted basis. All references to earnings per share are on a diluted basis. Adjustments could include items such as discontinued operations, asset sales, impairments, restructuring costs, regulatory items from prior years, or other items. Management views adjusted earnings as a key measure of the company’s present operating financial performance and uses adjusted earnings for external communications with analysts and investors. Internally, the company uses adjusted earnings to measure and assess performance. Because the company is not able to estimate the impact of specific line items, which have the potential to significantly impact, favorably or unfavorably, the company's reported earnings in future periods, the company is not providing reported earnings guidance nor is it providing a reconciliation for the comparable future period earnings. The adjusted earnings should be considered supplemental information to assist in understanding our business results, rather than as a substitute for the reported earnings. Similarly, management views the ratio of Funds From Operations (FFO)/Average Debt as a key measure of the company’s operating financial performance and its financial position, and uses the ratio for external communications with analysts and investors. Because the company does not establish its target FFO/Average Debt ratio based on a specific target numerator and target denominator, the company is unable to provide a reconciliation to a comparable GAAP financial measure for future periods Investors and others should note that CMS Energy routinely posts important information on its website and considers the Investor Relations section, www.cmsenergy.com/investor-relations, a channel of distribution. 2
-------eMS" ENERG"Y> A=g=e==n=d=a================== 3 •Financial Results & OutlookRejji Hayes Executive VP & CFO •Business UpdatePatti Poppe President & CEO
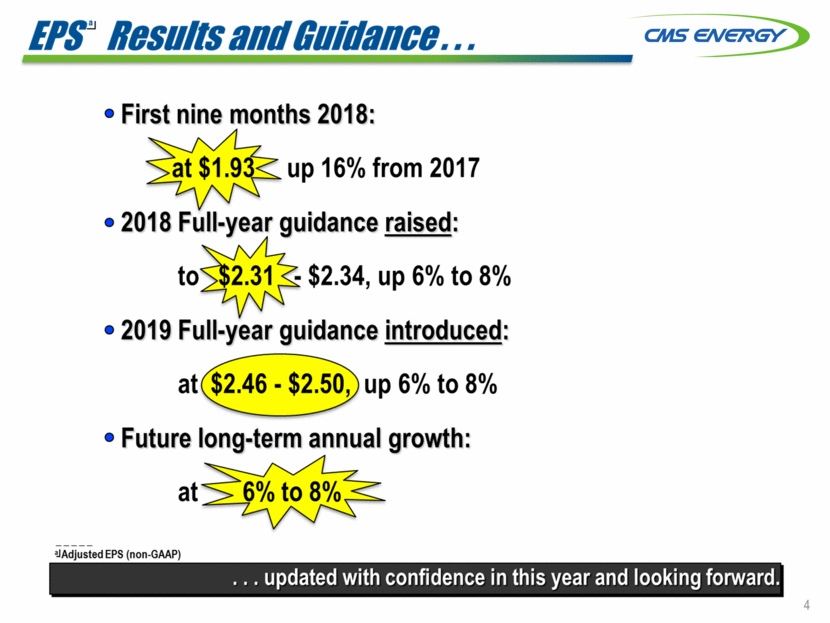
-------eMS" ENERG"Y> I=P=S==R=I=IS=U=I=IS=a==n=d=G=u=id=a=D=C==II•=•=•= • First nine months 2018: up 16o/o from 2017 • 2018 Full-year guidance raised: • 2019 Full-year guidance introduced: • Future long-term annual growth: at aJAdjustedEPS (non-GAAP) 4 ... updated with confidence in this year and looking forward.
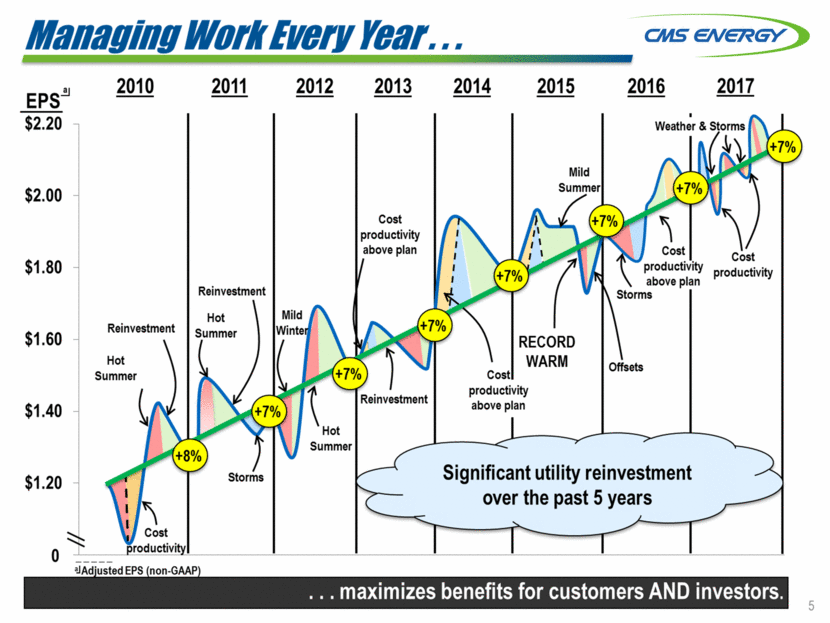
ManagingWorkEVIllY Y11ar••• --------E-N--E-R--G-"Y> eMS" 2010 2013 2014 2015 2016 2017 2011 2012 EPS.!I $2.20 Mild $2.00 Cost productivity above plan Cost $1.80 productivity above plan productivity Storms $1.60 RECORD WARM productivity above plan Hot Summer $1.40 Summer Significant utility reinvestment over the past 5 years $1.20 0 -----!..1 investors. 5 ...maximizes benefits for customers AND
---EN-ERG-Y:> ThllTrA 'Ill BottomlintJ... eMS 6 ... world class performance delivering hometown service. PEOPLE•PLANET•PROFIT PERFORMANCE

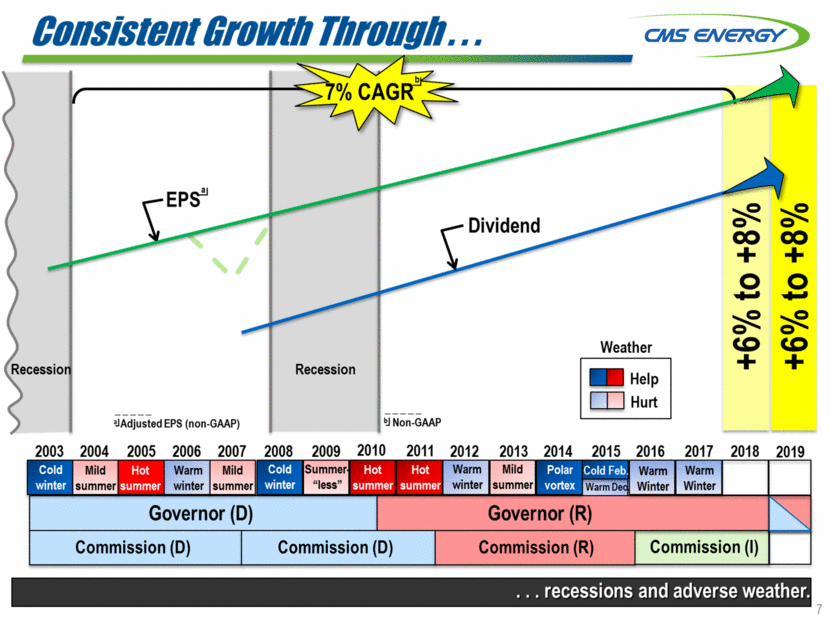
---E-N-E-R-G-"Y> ConsisttJntGrowthThrough••• eMS" ,, 0 0 co co + + .......... 0 0 CD CD Weather + + Recession bJ Non-GAAP •JAdjustedEPS (non-GAAP) Warm winter Mlid summer WarmMild winter summer . Warm Warm 7 ... recessions and adverse weather. Governor (D)Governor (R) Commission (D) Commission (D) Commission (R) Commission (I) Cold Feb WinterWinter : Po lar vortex -Help [I]Hurt
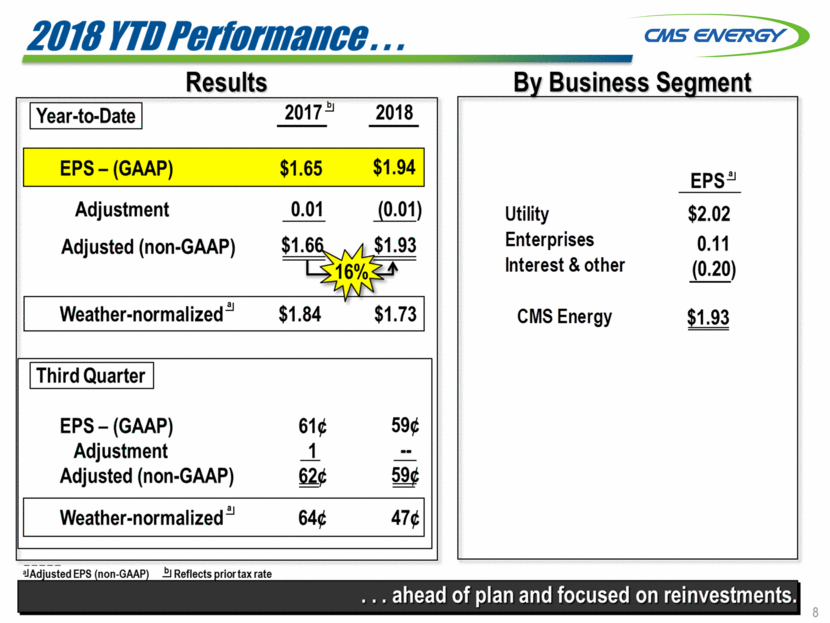
CAtS ENeNGY:> c2=0=1=8="=DPlltf=o=r=m=a=n=c=t=l.=..=== Results B Business Se ment Interest & other (0.20) b • reinvestments. 8 . .. ahead of plan and focused on EPS!J Utility$2.02 Enterprises0.11 CMS Energy$1.93 IYear-to-Date I2017!12018 EPS-(GAAP)$1.65$1.941 Adjustment(0.01) Adjusted (non-GAAP) $1.84$1.73 IThird Quarter I EPS-(GAAP)61¢59¢ Adjustment1 Adjusted (non-GAAP) Weather-normalized.!!64¢ Weather-normalized.!!
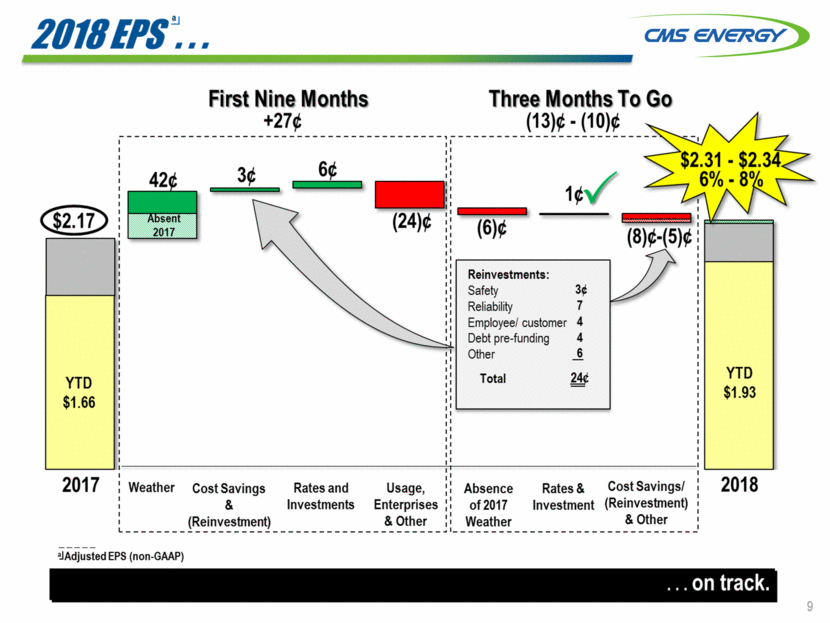
--------eMS" ENERG"Y> 2018/PS:.. First Nine Months Three Months To Go (13)¢ • (10)¢ +27¢ -----------------------------------------, 6¢ 3¢ (8)¢-(5)¢ $1.66 2017 2018 Rates & Investment WeatherCost Savings & Rates and Investments Usage, Enterprises Absence of 2017 Cost Savings/ (Reinvestment) (Reinvestment) & Other Weather & Other ! _1 -----------------------------------------aJAdjusted EPS (non-GAAP) ... on track. 9 YTD YTD $1.93 Reinvestments: Safety 3¢ Reliability 7 Employee/ customer 4 Debt pre-funding4 Other.! Total '''''''''''''''''''''''''''''''''''''''''''''''''''''''''"
M S EMreR_G_Y?> 2019 long-TBrmRtlgulatoryPlanning... C =========================-= 2018 Regulatory I Policy 6/15: Filed long-term generation plan (IRP) U-20165 Q2: Expected IRP order U-20165 order U-18494 order for Gas Utility $49 MM 3/29: Final order U-18322 $72 MM (on 6/28) 10.0% ROE Current Request Mar: Expected final order U-20134 5-Yr electric dist. plan U-17990 Revenue: $44 MM ROE: 10.75% Trackers: $49 MM 1/1: Gas investment tracker $18 MM U-18124 visibility. 10 ... provides significant customer value and long-term FinalSettlement Revenue: $11 MM ROE: 10.0% Trackers: -$9% MM
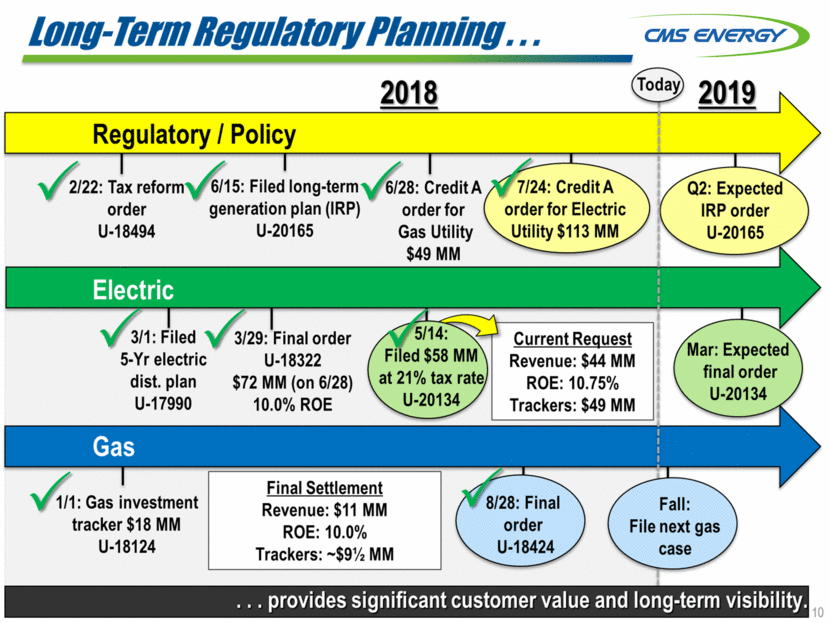
---E-N-ER-G-"Y> GasIDVIISimtJDIIIIIIIdS••• eMS" c=====--========----Customer Experience Leak Reduction Increased Capacity 11 ... prioritize safety, reliability and affordability. Benefits
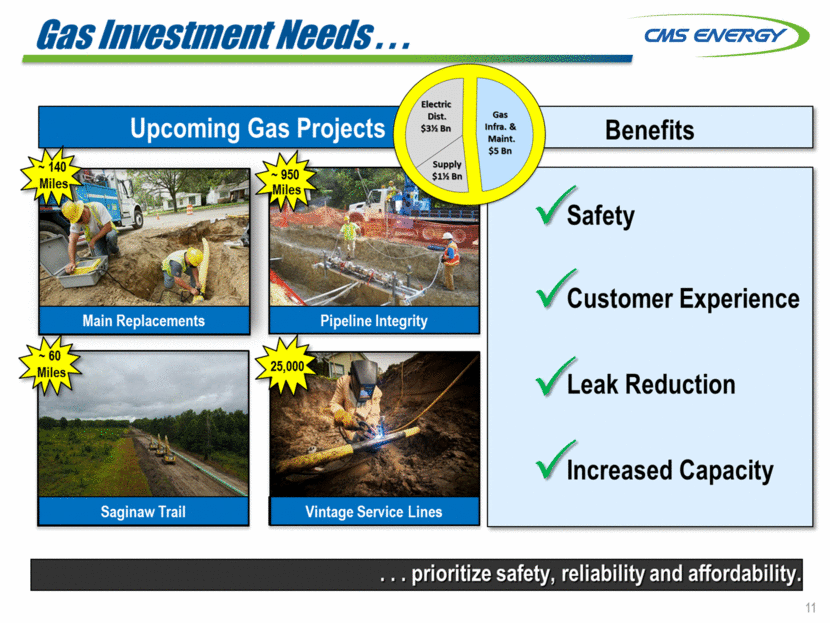
-----eMS" ENERG"Y> cC==u=s=to==m=t=J=r=ln==v=tJ=s=t=m==tJ=n=t=PlanSlttJWIJd••• Large and Aging System Rate Base Growth ? -$-5-0--Bn ..... , ,. $10 Bn 5-yr Plan ... towards gas investments. 12 $21 Bn 20172022 $15 Bn D Electric D Gas
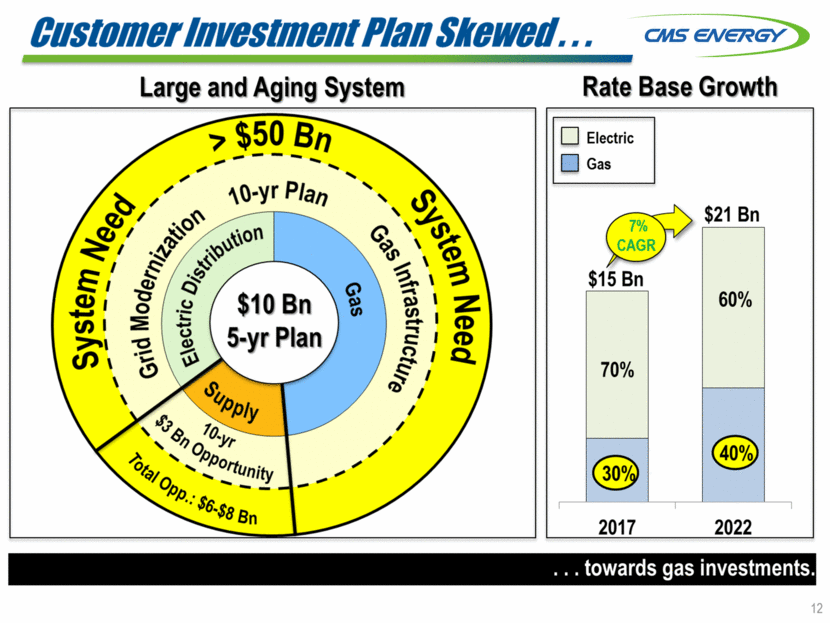
--OMS' ENERGY:> OurEntirtJCostStructurtJ••• c=============--=========-=---Cost ComponentsResidential Electric Bills 100 esidential Gas Bills 2013 2018E .!lSource:bls.gov for historicaldata,Bloombergfor 2018 estimate 13 ... provides opportunities to lower costs and avoid rate fatigue. Taxes Capital Investments Cost of Capital 2018E
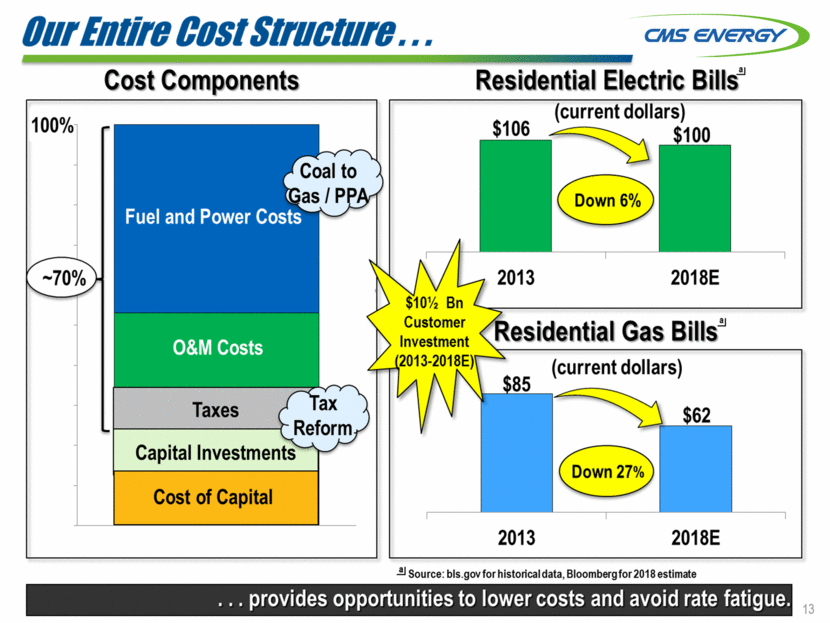
-----eMS" ENERG"Y> cU=t=il=it=Y==D=r=iv=B-n,=l=o=w==R==is=k==G=r=o=w= th••• CMS Energy Long-Term Growth Plan Segments: • Utility • • Needed system upgrades I robust backlog Affordable prices driven by cost controls Largely contracted & utility-like Contracted generation & renewables • • 0-1 • Enterprises • • • Refinancing high coupon debt Tax planning Supportive EnerBank contribution & tax shield 1 • {1) G-siJ • Parent & Other I Total EPS Growth.!] I aJAdjusted EPS (non-GAAP) elivers consistent, industry-leading financial performance. 14 ... d
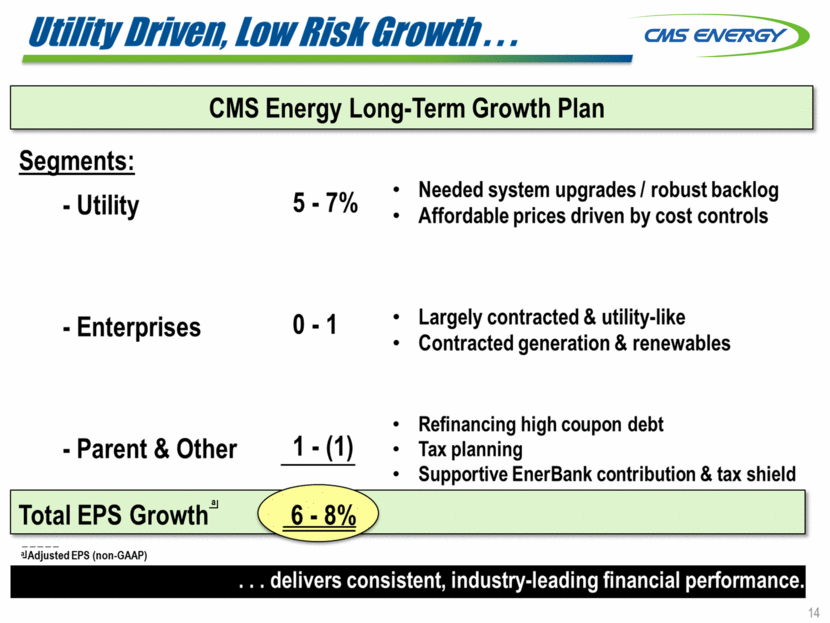
eMS ENERG--- Y:> cC=o==m=p=t=J=/I=in==g=In=v=e==s=tm-e=n=t=T=h=e=sis... Aging Infrastructure 15 ... adaptive to changing conditions.
Thank You! See you at EEl 16

Appendix

--------eMS" ENERG"Y> MichiganPoliticallnvironmllnt =========================-= Gubernatorial Election Senate •••••••••••• 4-year terms, concurrent with Governor's term, 2-term limit House of Representatives •••••• @ •••••• ·•·•:•·•·•·=•·•·•·•:•·•-••·•· 2-year terms, even numbered years, 3-term limit 18 Democrats: 47Republicans: 63 ••·•·••·••·••:••···110··•·•••·••·••·••·•• ··::::·· Democrats:•10••Vacant Seat: 1 •R•ep•ublicans: 27 •••••••• DemocratRepublican Bill Schuette Key Issues: • Economy • Infrastructure • Education
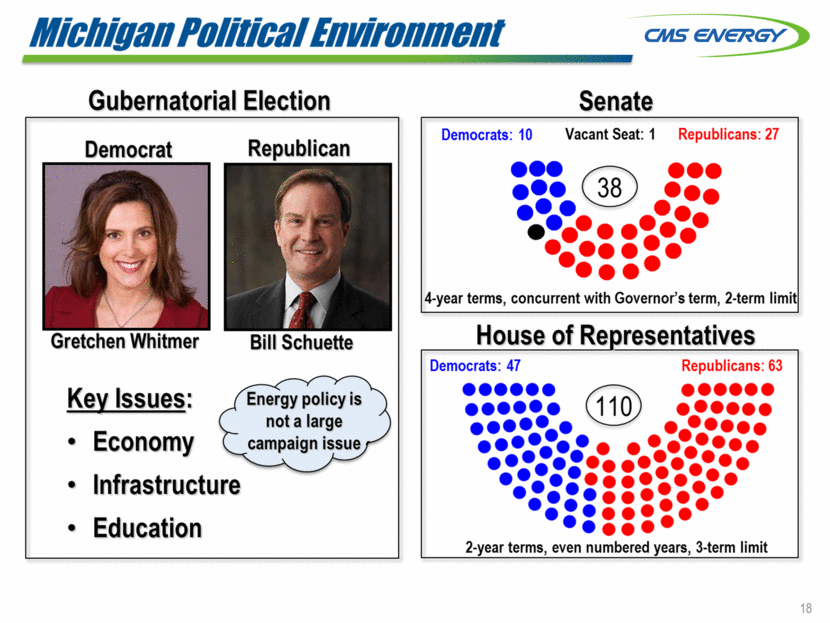
-----eMS" ENERG"Y> liltJdlnttJgrattJdRtJsourctJPlan 1RP':•• =========================-= Clean and Lean Overview Fully utilize future. 19 ... seizing a once in-a-generation opportunity to reshape Michigan's energy File Date: June 15, 2018 Expected Order Date: Q2 2019 Case No.: U-20165 Capital Investment Opportunities: • No Change to 5-year, $10 Bn Plan (IRP includes REP* spend of -$1 Bn) • $3 Bn opportunity in 10-year Plan Financial Incentives: • Energy Efficiency, -$45 MM pre-tax annually by 2021 (vs. $34 MM Plan) • Demand Response, filed 5/31 •RenewableEnergyPlan Modular assets O&M Fuel Lower Risk
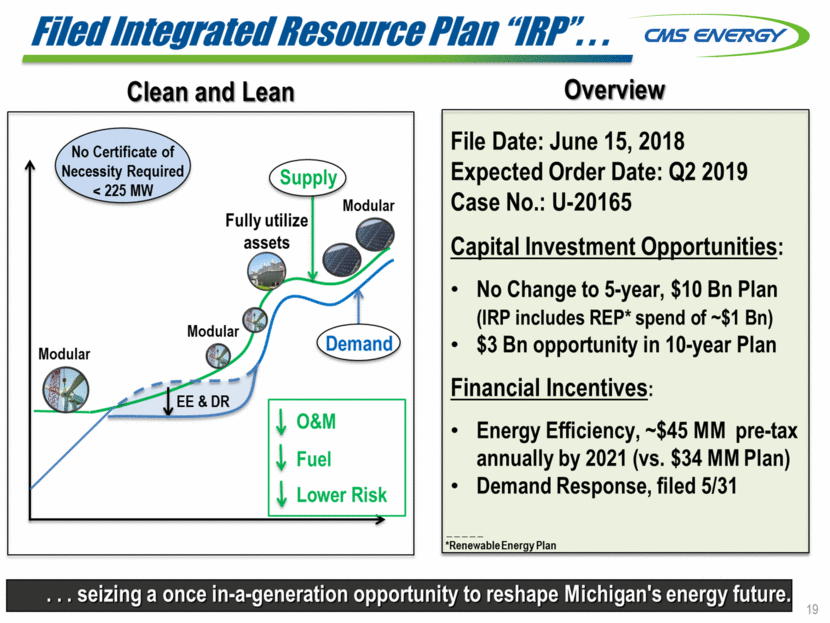
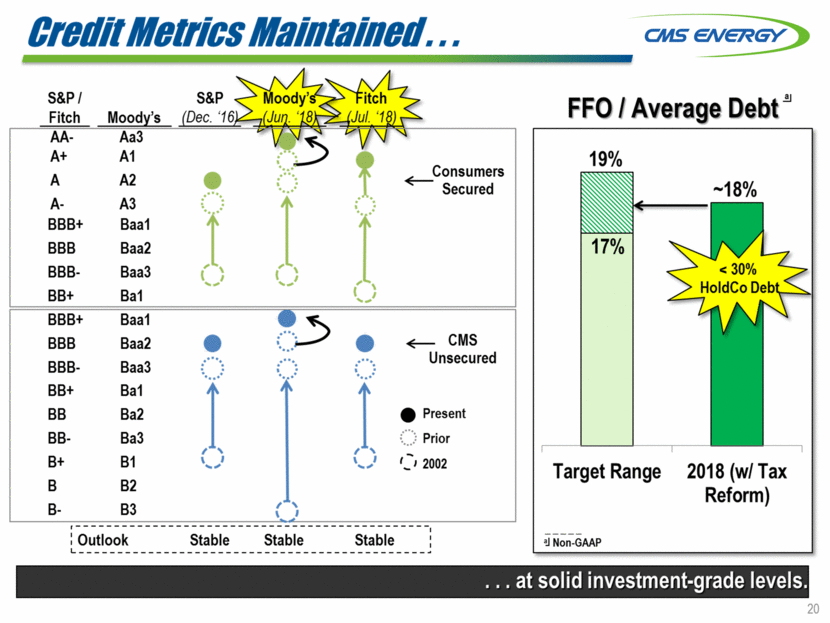
-------eMS" ENERG"Y> CreditMetricsMaintained... S&P/ Fitch FFO I Average Debt!J Moody's ....... .. .. Secured I ,\ (.......I ,\ ..·.·.·... 1 .···. .···. Unsecured 888-8aa3 I • I • 1e Present 88 8a2 Reform) 8-83 \I ,----------------------------------------------, : Outlook Stable Stable Stable : ---------------------------------------------levels. 20 ... at solid investment-grade 19o/o Target Range2018 (w/ Tax •J Non-GAAP AAAa3 A+A1 AA2 A-A3 888+ 8aa1 888 8aa2 888-8aa3 88+ 8a1 Consumers l" (.......I 888+ 8aa1 888 8aa2CMS •.. •.. 88+ 8a1 88-8a3(.) Prior 8+81 \....,I\....,I(:} 2002 882,'
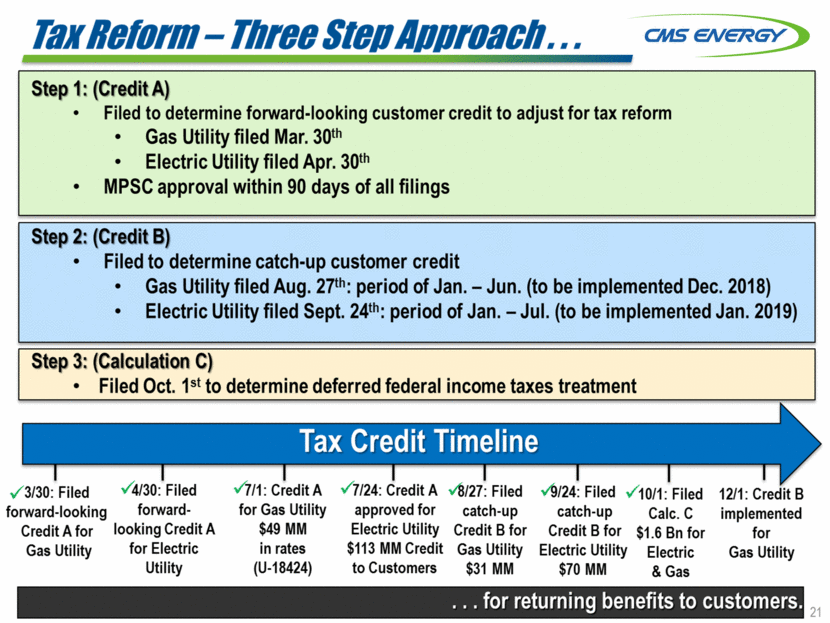
---EN-ER-G-"Y> TaxRtJtorm-Thr1111SttJPApproach••• eMS" Step 3: {Calculation C) • Filed Oct. 1st to determine deferred federal income taxes treatment 7/24: Credit A 1/8/27: Filed 3/30: Filed forward-looking Credit A for Gas Utility v'9/24: Filed 10/1: Filed 12/1: Credit B implemented for Gas Utility for Gas Utility $49 MM in rates (U-18424) approved for Electric Utility $113 MM Credit to Customers catch-up Credit B for Gas Utility $31 MM forward-looking Credit A for Electric Utility catch-up Credit B for Electric Utility $70 MM Calc. C $1.6 Bn for Electric & Gas customers. 21 ... for returning benefits to Step 2: {Credit B) • Filed to determine catch-up customer credit • Gas Utility filed Aug. 27th: period of Jan. -Jun. (to be implemented Dec. 2018) • Electric Utility filed Sept. 24th: period of Jan.-Jul. (to be implemented Jan. 2019) Step 1: {Credit A) • Filed to determine forward-looking customer credit to adjust for tax reform • Gas Utility filed Mar. 30th • Electric Utility filed Apr. 30th • MPSC approval within 90 days of all filings
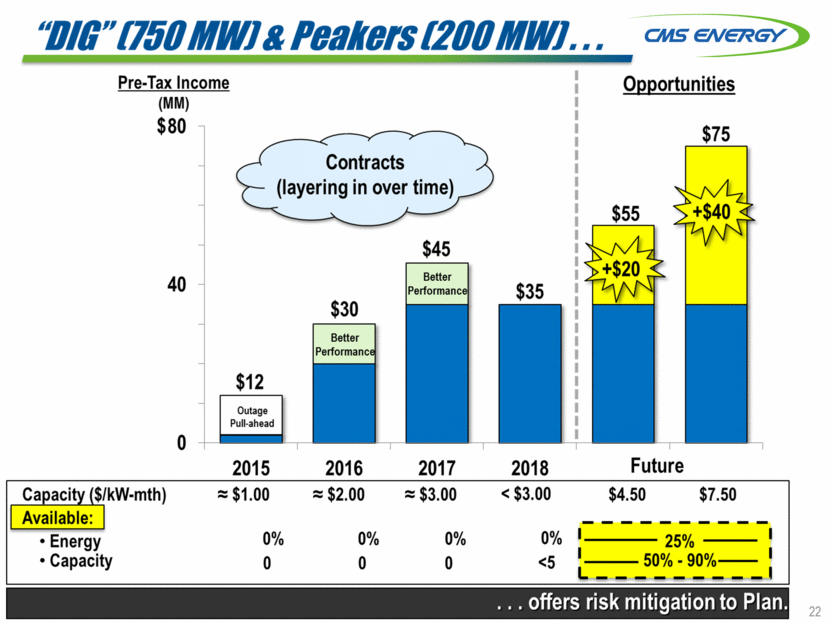
----EN-E-R-G-Y:> 11/G''1150MWJ&PtJaktJrs1200MWJ... Pre-Tax Income (MM) $80 eMS Opportunities $75 40 $12 Outage Pull-a head 2018 Future 2015 2016 2017 I Available: I • Capacity <5 50% • 90% I I 0 0 0 - - - - - --=-'=-Plan. 22 Capacity ($/kW-mth):::: $1.00:::: $2.00:::: $3.00< $3.00$4.50$7.50 • Energy0%0%0%0%I25%I L=-'=-... offers risk mitigation to
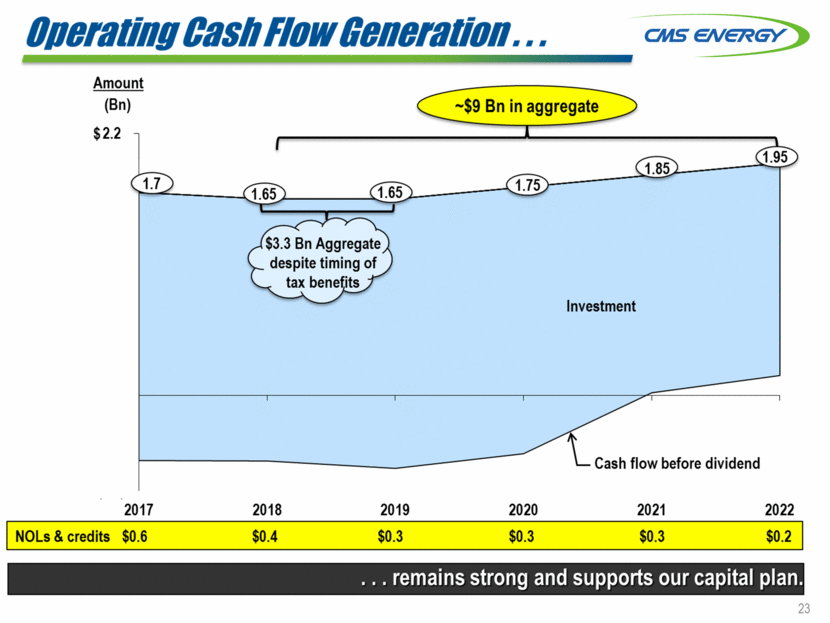
------eMS" ENERG"Y> OptJratingCashFlowGtJntJration••• r=-===================== Amount (Bn) $2.2 -$9 Bn in aggregate Investment Cash flow before dividend 2017 I NOLs & credits $0.6 2018 2019 2020 2021 2022 $0.4 $0.3 $0.3 $0.3 $0.2 1 23 ... remains strong and supports our capital plan.
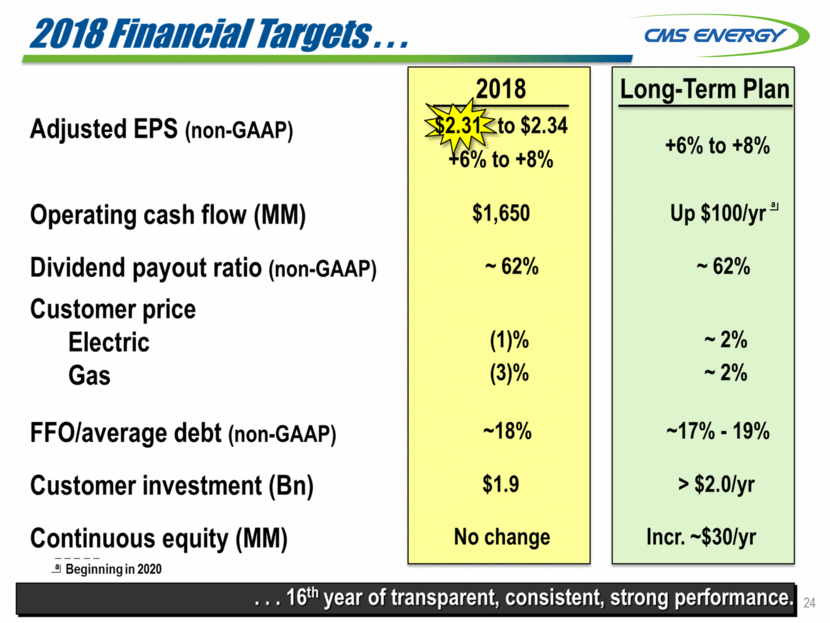
---EN-ER-G"Y> 2018FinancialTargtJts... eMS" Adjusted EPS (non-GAAP) 6 Yo to +8°/o Operating cash flow (MM) Dividend payout ratio (non-GAAP) Customer price Electric Gas FFO/average debt (non-GAAP) Customer investment (Bn) Continuous equity (MM) . .. -----a Begmnmg m 2020 24 ...16th year of transparent, consistent, strong performance. 2018 to $2.34 $1,650 - 62°/o {1)0/o {3)0/o -18°/o $1.9 No change Long-Term Plan +6°/o to +8°/o Up $100/yr !J - 62°/o - 2°/o - 2°/o -17o/o • 19o/o > $2.0/yr Incr. -$30/yr
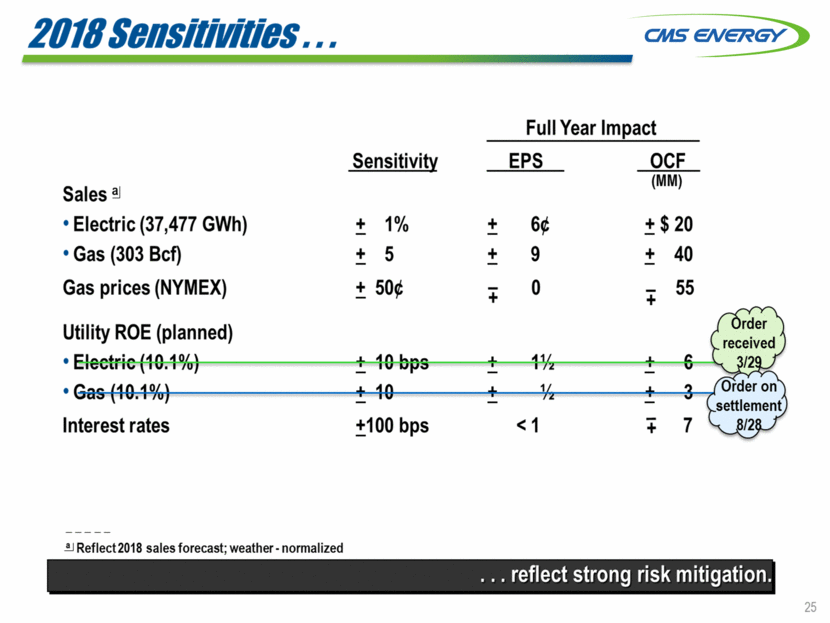
------eMS" ENERG"Y> 2018SIJRSiliviliiJS••• =========================-= Full Year Impact EPS OCF (MM) Sensitivi Sales • Electric (37,477 GWh) • Gas (303 Bcf) Gas prices (NYMEX) -+ -+ + 1o/o 5 50¢ -+ 6¢ 9 0 + $20 -+ -+ -+ -+ 40 55 UtiIity ROE (planned) r&:-1-• I IO"J • • Interest rates +100 bps <1 .!.l Reflect2018 sales forecast;weather-normalized 25 ... reflect strong risk mitigation.
GAAP Reconciliation

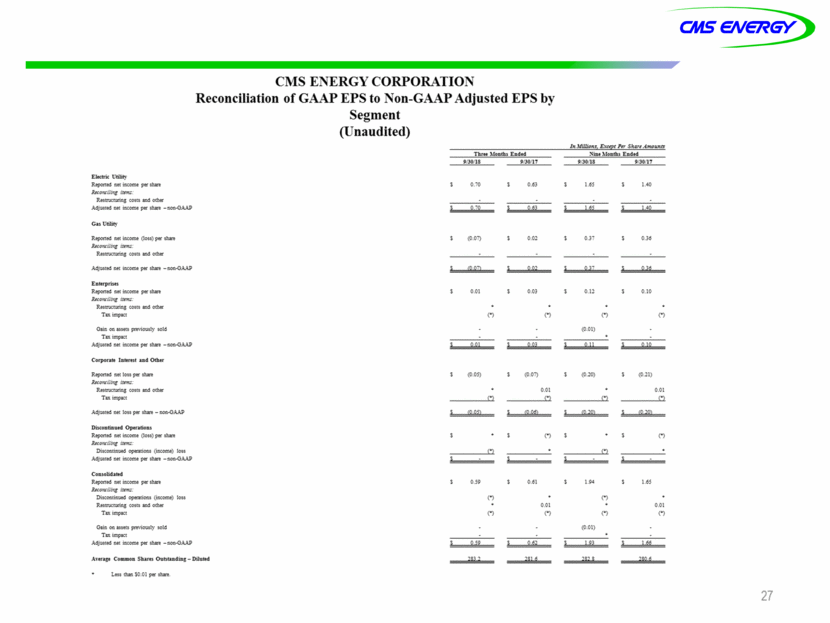
CMS ENERGY CORPORATION Reconciliation of GAAP EPS to Non-GAAP Adjusted EPS by Segment (Unaudited) lr:V"rllil1ru. A«pt Pu Situ'..41ft0wu:s· 'I'1lnt lfontm Eadfd XiDt l ·Ioatln Eadfd 9/30118 9130/17 9130/18 9130/17 DKtric Utility o·. o 0.63 1.65 l.<O o.o· 0.63 1.-40 l.6S GuUt:ilit)· Rtpotttd tl.l'l:11K01M (lou) Pf! shaft (0.()") 0.00 0.37 0.36 tOO 000 QH Q 6 Entupril H RtpOC'Ud tl.o!'l: 11K01M pit slim 0.01 0.03 0.12 0.10 (•) (•) (•) (•) Gain on :nuts JX!"'<'-ily sold Tax irn,pact Adjutttd 11K01M pet slim -Mn-GAAP (0.01) O Q3 QQl Qll Q 10 Corpon.t. htm-tst ud Othu (0.05) (0.07) (0.20) (0.21) Rntrueturin:CO!.ts. and othtr Taxirn.pact 0.01 0.01 mw <P Q5l CQ()§) 'PfO> DiKOiltillUtcl Opt. tioiU R.!pon!d Ml inc:.OIM (lou) per (•) (>) DiKO!ltin'l»d optm.ions (i1Komt) los-. . Adjw.l!d Mt inc:.OIM per shz'! -non-GAAP CoJUolidattd R.!pon!d Ml inc:.OIM per shz'! 0.59 0.61 1.9< 1.65 DiKO!ltin'l»d optm.ions (i1Komt) los-. . R.nlrUCtUrinCO!.ts. and othe" Tax irn,pact (•) (•) 0.01 (•) 0.01 (>) (•) (•) Gain on as.sm pctVi01»ly sold Tax impxt Adju1. .1!d Ml 1ncom• pe: !h3!"t -non-GAAP (0.01) 10 2 l 2 0 :me ]_§1 .\nCollllii.Oil Slu.rti Outu.udiq-Dilultd 2&1 6 l$Q 6 27
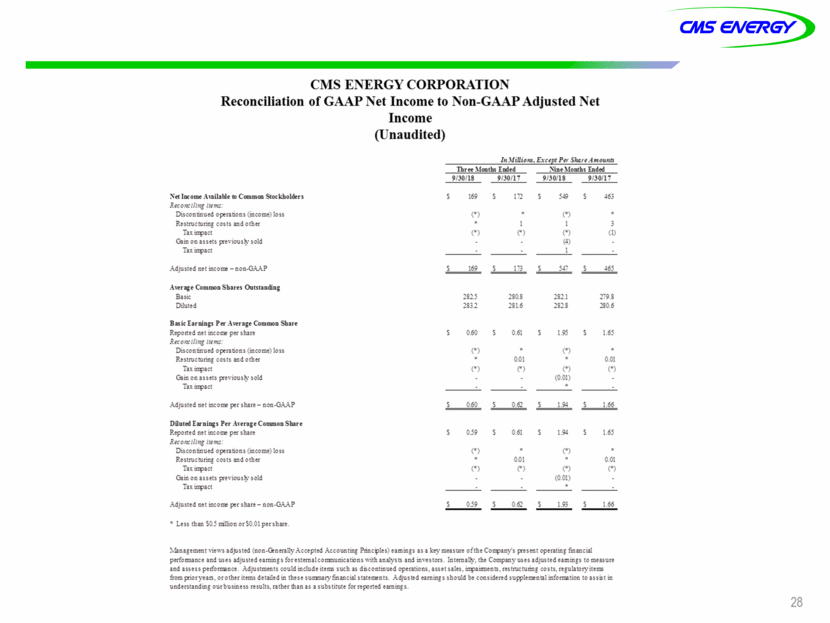
CMS ENERGY CORPORATION Reconciliation of GAAP Net Income to Non-GAAP Adjusted Net Income (Unaudited) In.\Jilli41tu1 Exce f!!. Prr Sh4n Amounll Three loorhs Inded :-.1ne lonrbs Inded 9/30/18 9 /30117 9/30/18 9/30117 et loc-on1e ATailable to Common StO<-kbo lders RvcoTl( i/ing items: Discontinue-d o rations (incom) loss Restruc ruring costs and oth er Tax ac-t Gain on assets pre\·iously sold Tax iq>act 169 112 549 463 (' ) ( ) 1 ( ) ( ) 1 1 (*) 3 (1) (' ) 169 113 541 65 Adjusted ne t incoar -non-G.-\..\P .\vtr ag t Common Shares Outstanding Basic Dilu1ed 2825 S3J 280.8 281.6 282.1 82.8 279.8 280.6 Basic [arnings Per .·\xerage Common Sbilre Reported ne[ incoper share RvcoTl( i/ing items: Discontinue-d o rations (incom) loss Resuucruring costs and O[her Tax ac-t Gain on assets p-e\·iously sold Tax in¥>act 0.60 0.61 1 .95 1.65 (' ) ( ) 0.01 (*) 0.01 ( ) (' ) ( ) (0.01) Adjusted net incoar per s hare - non-G.: - p 0.60 0.62 1 . 1.66 Diluted [arnings Per .\nrag t Conunon Share Reported ne[ incoper share Reconciling irtms: Discontinued operations (income) loss Restruc ruring costs and oth er Tax ac-t Gain on assets P'eviously sold Tax ac-t 059 0.61 1 . 1.65 (' ) ( ) 0.01 (*) 0.01 ( ) (' ) ( ) (001) Adjusted net incoar per s hare - non-G.: - p 059 0.62 1 .93 1.66 • Less <han SO.S nillion orS0.01 pershare. 1anagement \iews ad}.lsted (non-U-neraUy Accepted Accowuing Princples) e-amings a s a key measure of the Cotq:>any's fl"esem operating financial perfonnance and UHS adjustd tamin s for externalcotnnuniatOns with analysts and in\·estors. Internally, the Company UHS adjustd tamin s to masure and assess petfonnance. Adjustments could include items such as discontinued operations, asset sales, aimlents, restructuring costs, regulatory items from prior yean..or other items d e tailed in these suamaryfmancial statetzr;nts. Adjusted earnings s hould be considered suppleurntal info rmation to assist in undtrstanding ourbu sine u results, rathH than a s a substitutfor r JXlned taming s. 28
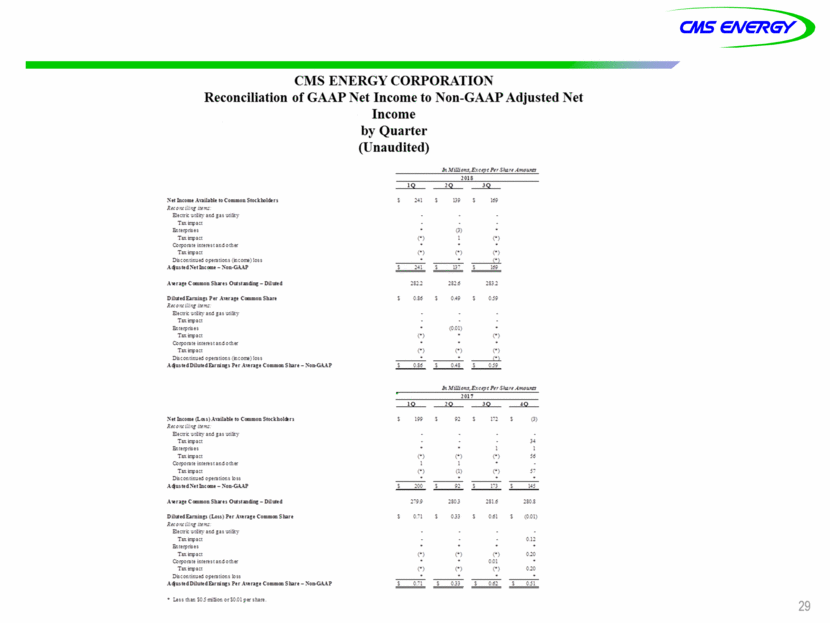
CMS ENERGY CORPORATION Reconciliation of GAAP Net Income to Non-GAAP Adjusted Net Income by Quat'tet· (Unaudited) b.! J/illi.oJu,E xc'?t p SNln AJnDWUJ' lOIS !_Q_ !_Q_ !Q XH lac:ome .\niliblt to Common Stod:boldus Rnowilir.,r!tl1'".: El.tctr;;til-u.d ;n \Otiliy Tu: iq)act Ezm rins Tu.ir.l;.lact Con.tt ir.:tt:'IUir.!C Otbc TU. ICt Disc.orl.ti..r::uc opt tions (c.or.:.)lon .\4tUttcl ttlncomt-:Sod-G\...U' 241 139 1 9 (3) (') ( ) (') (' ) ( ) t_l_ .2&1.:! :!S.2.6 .2S.3.2 O.S9 Oihatd Eua..ia.p hr .h· 1!n;, t C4BUII.oll Shut ?.. ffO Jlll".fi!IW'.: El.tctrk uta-u.d ;n 1.0tilir:y TU.ICt F.::!tt risn Tu.qa u Co ntt ir.tt!'lstar.dodl.r Tu.qa u DiscOfl.tir:uc Opt!'ltions (m.cor.:.)lou .\4wtt ciDiluttdEa.rDI.acs Ptt .\\tra& t Comman Sblu-:Soo.G\..tP Ol6 0.49 (0.01) (') ( ) (') (' ) ( ) !:.1. .b.! \/illitllu,E:xupc Pl r Sltllu A.JnDuna 1017 !.Q l_Q !.Q !.Q tt lncom (Lcas).\nihblt to COIIl.IDou Stoc:kbot•r • R.nQncl.ilr.f!t•w.: Eltctrk utal:}-arA. ;n 1,;-tilil::r Taxqact Et::t! rius Tu. ac:t Co n.tt it:.tt!"Ut&t::dOth!! Taxqac:t Oiscooti.r.:.:Op!!'ltionJ bu A4wttd:Xttlnc«at-oa-C:\.U 199 9l 1"2 (l) J• 1 ( ) (') 1 (') (' ) 1 (!) !6 s· .1...........!: uo.s ( ) _s 9_ .1...........!2 .2 816. r9..9 :!SOJ o.-t ou..Urni.np (Lou) Per A\"t-n:tComJIUI1Sbut RuoN i11r..g rum: EltctrC tail·u-.G :as .:.til:ity Taxqac:t Er.:tt risu Taxqac:t Co:"pOntt it:.tt!lt&r.:doth!! Ta.xir.;lac.t Oiscootif:.:lOp!!'lticr.1bu .\4wttdOiluttdEJ.raiD&S Per .\\trat; t Commao Shu t -:'\oo-G:l.-\P 033 0.01 (0.01) 0.11 (') (' ) ( ) 01 ( ) 020 (') (' ) OlO s 0."1 s 0.33 s 06. 2 s 0.51 .. Uud::znS0.50!1ior.orSO.Ol psbrt . 2
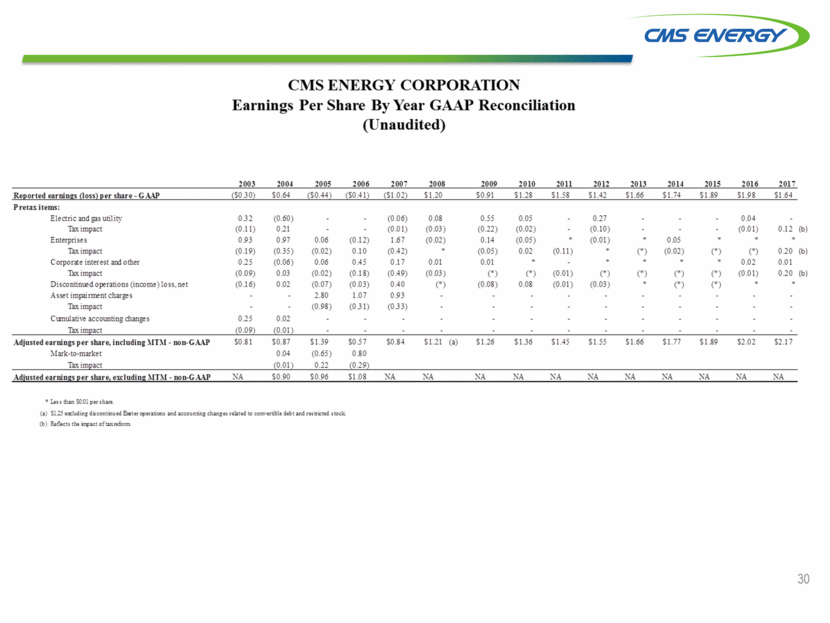
-----------------eMS" ENERG"Y> CMS ENERGY CORPORATION Earnings Per Share By Year GAAP Reconciliation (Unaudited) 2 003 2004 2005 200 6 2007 2008 2009 2010 20 ll 2012 2013 2014 201 5 201 6 2017 Re ort ed earnings {loss) er share - G A. .\I' (SOJO} 0.6-1 (0.44} (0.-11} (1.02} $1.20 0.91 1.28 $1.58 $1.-12 1.66 s 1.7-1 1.89 $1.98 $1.64 P reta:x items: E lectric and gas uti! ity T<L'timpact E nterprise-s Tax impact Corporate int.rest and oth.r Tax impact Discontinued operations (income) loss, net Asset impairment charg.s Tax impact Cunulati'accounting changes T<L'tim act 032 (0.11) 093 (0.19) 015 (0.09) (0.16) (0.60) 021 097 (0.35) (0.06) O.o3 O.o2 (0.06) (0.01) 1.67 (0.42) 0.17 (0.-19) 0.40 0.93 (033) 0.08 (0.03) (0.02) 0.55 (0.22) 0.1-1 (0.05) 0.01 (*) (0.08) 0.05 (0.02) (0.05) 0.02 0.27 (0.10) (0.01) 0.0-1 (0.01) 0.1 2 (b) 0.06 (0.02) 0.06 (0.02) (0.07) 2.80 (0.98) (0.1 2) 0.10 0.45 (0.18) (0.03) 1.07 (O J!) 0.05 (0.02) (0.11 ) (*) (•) (•) 0.02 (0.01) 010 (b) 0.01 010 (b) 0.01 (0.03) (•) (*) 0.08 (0.01 ) (0.01 ) (•) (0.03) (*) (•) (•) (•) (•) O.o2 s1.36 $0.81 $1.39 (0.65) $0.8-1 $1.21 $1.26 $1.55 $1.66 $1.77 $1.89 $2 .02 $2.17 $057 0.80 (a) SL-15 Adjust ed earnings p er share, including :\IBI - uou-GAAP :\!ark-to-market 0.0-1 T<L'tim ac t :\A $0.96 $1.08 :\A :\A :\A :\A :\A :\A Adjust ed ea r nings p er share. excluding :\IBI - uon-GA.\1' :\A :\A :\A :\A :\A • Ins than S0.01 pMsh.a.rt. (.1) Sl15 velin!c!isconcinK E..tit'qMr.a.tions and. accountint c.h.antn n.b.tid to com·M"tibl• cicbt and rHtri:ud stock. (b) Ri-:lects the 1::rp.t-ct o:ux :orm 30
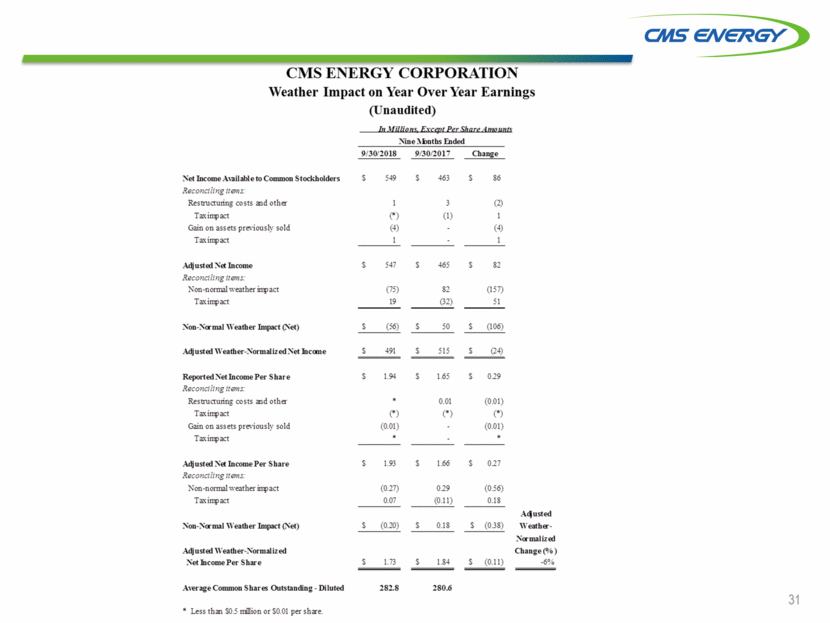
-----------------eMS" ENERG"Y> CMS ENERGY CORPORATION \Veather Impact on Year Over Year Earnings (Unaudited) l1.1. }lilliazu, E.c.ep.cl!.e.c. S:hac.e. til1112UlJt:S. :'\1ne )lmths .Ended 9/30/2018 9/30/2017 Change s s ::"et Income.-\xailableto Common Stockholders Reconciling irems: Restructuring costs and other Taxiact Gain on ass ets preo.i·ously sold Taxiact $ 549 463 86 (2) I (4) 3 (!) (") (4) s s 547 65 82 Adjusted ::"EI Income Reconciling irems: Kon-n ormal weather in:pact Taxiact (75) 19 82 (32) (!57) 51 s s (56) 50 (106) ::"on-::"<rmal Weath er Impact (="et) s s $ 491 51 5 (24) Adjusted Weather-::"orm alized::"et Jncone s s Reported::"et lncomePer Share Reconciling iTems: Restructuring costs and o ther Taxiact Gain on assets preo.·iouslv sold Taxiact 1.94 1.65 029 0.01 (*) (0.01) (*) (0.01) (") (0.01) s s Adjusted ::"EI Income Per S hare Reconciling irems: Kon-normal weather in:pact Taxiact $ 1.93 1.66 027 (0.27) 0.07 029 (0.11) (0.56) 0.18 At1usted Weather-::"<rmalized Cha nge (o/o) -6% $ s 0.18 s (0.38) ::"on-::"<rmal Weather Impact (="et ) (0.20) Adjusted Weather-::"orm alized :"et Income Per Share s s(0.11) $ 1.84 1.73 A\l!rage Common Shares Ou tstanding - Diluted 282.8 280.6 31 * Less than $0.5 mllio n or $0.01 per share.
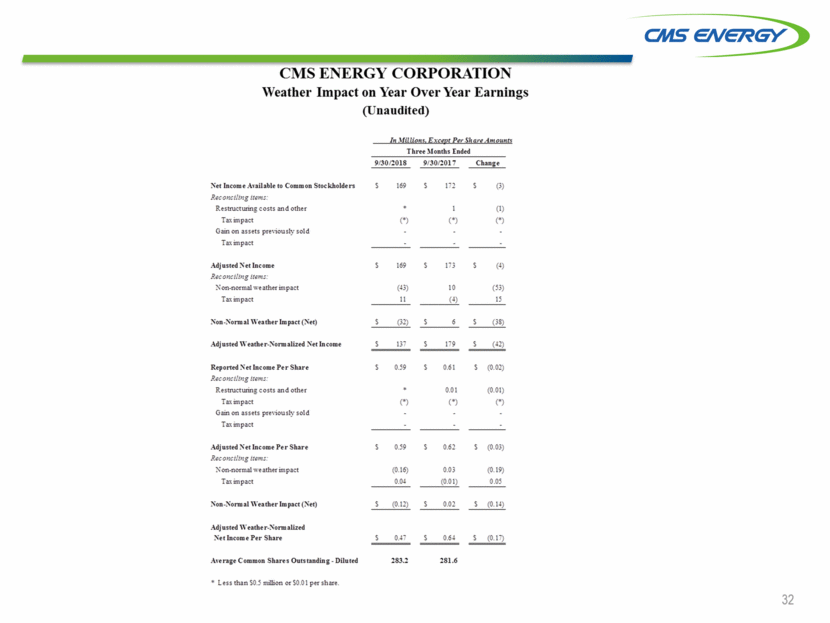
-----------------eMS" ENERG"Y> CMS ENERGY CORPORATION \Veather Impact on Year Over Year Earnings (Unaudited) In \filUons, E cf'pt p,,. Shal'eAmowttt Th ree onths Inded 9130/2018 9/30/2017 Chango 172 Xet Inc-ome Anil:tble to Common Stockho lders Reconciling items: Rt'structwing costs and otht'r Tax impact Gain on asset s pre,"iously sold Tuimpact 169 (3) (I) (*) I (*) (*) Adjustedet Income Reconciling items: X on-normal weather impact Tuimpact 169 17 3 (H) II 10 () (53) 15 :'lon-:'lonu•l Weathe r Impact (:'let) (32) (38) Adjusted \Veather-orm;slizXet Inc-ome 137 179 (4 2) 0.59 ReponXet Income Per Sh:tre Reconciling items: Restructuring costs and other Tax impact Gain on assets pre\'iously sold Tax impact 0.61 (0.02) 0.01 (*) (0.01) (*) (*) 0.59 0.6 2 Adjusted et Income Pe r Sha re Reconciling items: X on-normal weather impact Tax impact (0.03) (0.16) 0. 0.03 (0.01) (0.19) 0.05 :'lon-:'lonual Weather lrupacr (:'let) (0.12) 0.01 (0.1 ) .\d j usred Weathe r-:'lorm alized Xet Inc-ome Per Share 0.7 0.64 (OX) .-\.nra.ge Common Shares Ouu randing - Diluted 283.2 281.6 • Less than S.O.S million or S.O.O1 per share. 32
