Attached files
| file | filename |
|---|---|
| EX-99.1 - EX-99.1 - Apollo Commercial Real Estate Finance, Inc. | d635146dex991.htm |
| 8-K - FORM 8-K - Apollo Commercial Real Estate Finance, Inc. | d635146d8k.htm |

Exhibit 99.2 A P O L L O C O M M E R C I A L R E A L E S T A T E F I N A N C E , I N C . Supplemental Financial Information Q3 2018 October 24, 2018 Information is as of September 30, 2018, except as otherwise noted. It should not be assumed that investments made in the future will be profitable or will equal the performance of the investments in this document.Exhibit 99.2 A P O L L O C O M M E R C I A L R E A L E S T A T E F I N A N C E , I N C . Supplemental Financial Information Q3 2018 October 24, 2018 Information is as of September 30, 2018, except as otherwise noted. It should not be assumed that investments made in the future will be profitable or will equal the performance of the investments in this document.
Forward Looking Statements and Other Disclosures This presentation may contain forward-looking statements that are within the meaning of Section 27A of the Securities Act of 1933, as amended, and Section 21E of the Securities Exchange Act of 1934, as amended, and such statements are intended to be covered by the safe harbor provided by the same. Forward-looking statements are subject to substantial risks and uncertainties, many of which are difficult to predict and are generally beyond management’s control. These forward-looking statements may include information about possible or assumed future results of Apollo Commercial Real Estate Finance, Inc.’s (“ARI” or the “Company”) business, financial condition, liquidity, results of operations, plans and objectives. When used in this presentation, the words “believe,” “expect,” “anticipate,” “estimate,” “plan,” “continue,” “intend,” “should,” “may” or similar expressions, are intended to identify forward-looking statements. Statements regarding the following subjects, among others, may be forward-looking: ARI’s business and investment strategy; ARI’s operating results; ARI’s ability to obtain and maintain financing arrangements; and the return on equity, the yield on investments and risks associated with investing in real estate assets including changes in business conditions and the general economy. The forward-looking statements are based on management’s beliefs, assumptions and expectations of future performance, taking into account all information currently available to ARI. Forward-looking statements are not predictions of future events. These beliefs, assumptions and expectations can change as a result of many possible events or factors, not all of which are known to ARI. Some of these factors are described under “Risk Factors,” and “Management’s Discussion and Analysis of Financial Condition and Results of Operations” included in ARI’s Annual Report on Form 10-K for the fiscal year ended December 31, 2017 and other filings with the Securities and Exchange Commission (“SEC”), which are accessible on the SEC’s website at www.sec.gov. If a change occurs, ARI’s business, financial condition, liquidity and results of operations may vary materially from those expressed in ARI’s forward- looking statements. Any forward-looking statement speaks only as of the date on which it is made. New risks and uncertainties arise over time, and it is not possible for management to predict those events or how they may affect ARI. Except as required by law, ARI is not obligated to, and does not intend to, update or revise any forward-looking statements, whether as a result of new information, future events or otherwise. This presentation contains information regarding ARI’s financial results that is calculated and presented on the basis of methodologies other than in accordance with accounting principles generally accepted in the United States (“GAAP”), including Operating Earnings and Operating Earnings per share. Please refer to slide 19 for a definition of “Operating Earnings” and the reconciliation of the applicable GAAP financial measures to non-GAAP financial measures set forth on slide 18. This presentation may contain statistics and other data that in some cases has been obtained from or compiled from information made available by third-party service providers. ARI makes no representation or warranty, expressed or implied, with respect to the accuracy, reasonableness or completeness of such information. Past performance is not indicative nor a guarantee of future returns. Index performance and yield data are shown for illustrative purposes only and have limitations when used for comparison or for other purposes due to, among other matters, volatility, credit or other factors (such as number and types of securities). Indices are unmanaged, do not charge any fees or expenses, assume reinvestment of income and do not employ special investment techniques such as leveraging or short selling. No such index is indicative of the future results of any investment by ARI. 1Forward Looking Statements and Other Disclosures This presentation may contain forward-looking statements that are within the meaning of Section 27A of the Securities Act of 1933, as amended, and Section 21E of the Securities Exchange Act of 1934, as amended, and such statements are intended to be covered by the safe harbor provided by the same. Forward-looking statements are subject to substantial risks and uncertainties, many of which are difficult to predict and are generally beyond management’s control. These forward-looking statements may include information about possible or assumed future results of Apollo Commercial Real Estate Finance, Inc.’s (“ARI” or the “Company”) business, financial condition, liquidity, results of operations, plans and objectives. When used in this presentation, the words “believe,” “expect,” “anticipate,” “estimate,” “plan,” “continue,” “intend,” “should,” “may” or similar expressions, are intended to identify forward-looking statements. Statements regarding the following subjects, among others, may be forward-looking: ARI’s business and investment strategy; ARI’s operating results; ARI’s ability to obtain and maintain financing arrangements; and the return on equity, the yield on investments and risks associated with investing in real estate assets including changes in business conditions and the general economy. The forward-looking statements are based on management’s beliefs, assumptions and expectations of future performance, taking into account all information currently available to ARI. Forward-looking statements are not predictions of future events. These beliefs, assumptions and expectations can change as a result of many possible events or factors, not all of which are known to ARI. Some of these factors are described under “Risk Factors,” and “Management’s Discussion and Analysis of Financial Condition and Results of Operations” included in ARI’s Annual Report on Form 10-K for the fiscal year ended December 31, 2017 and other filings with the Securities and Exchange Commission (“SEC”), which are accessible on the SEC’s website at www.sec.gov. If a change occurs, ARI’s business, financial condition, liquidity and results of operations may vary materially from those expressed in ARI’s forward- looking statements. Any forward-looking statement speaks only as of the date on which it is made. New risks and uncertainties arise over time, and it is not possible for management to predict those events or how they may affect ARI. Except as required by law, ARI is not obligated to, and does not intend to, update or revise any forward-looking statements, whether as a result of new information, future events or otherwise. This presentation contains information regarding ARI’s financial results that is calculated and presented on the basis of methodologies other than in accordance with accounting principles generally accepted in the United States (“GAAP”), including Operating Earnings and Operating Earnings per share. Please refer to slide 19 for a definition of “Operating Earnings” and the reconciliation of the applicable GAAP financial measures to non-GAAP financial measures set forth on slide 18. This presentation may contain statistics and other data that in some cases has been obtained from or compiled from information made available by third-party service providers. ARI makes no representation or warranty, expressed or implied, with respect to the accuracy, reasonableness or completeness of such information. Past performance is not indicative nor a guarantee of future returns. Index performance and yield data are shown for illustrative purposes only and have limitations when used for comparison or for other purposes due to, among other matters, volatility, credit or other factors (such as number and types of securities). Indices are unmanaged, do not charge any fees or expenses, assume reinvestment of income and do not employ special investment techniques such as leveraging or short selling. No such index is indicative of the future results of any investment by ARI. 1
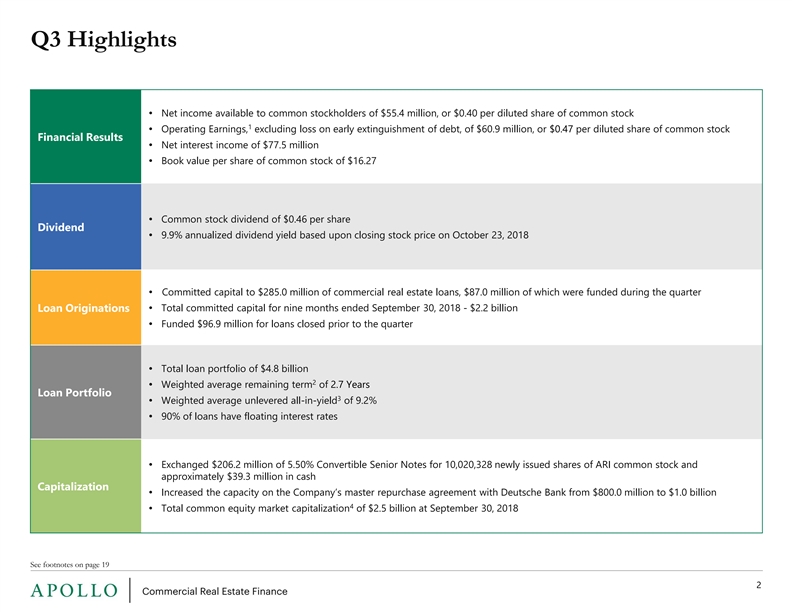
Q3 Highlights • Net income available to common stockholders of $55.4 million, or $0.40 per diluted share of common stock 1 • Operating Earnings, excluding loss on early extinguishment of debt, of $60.9 million, or $0.47 per diluted share of common stock Financial Results • Net interest income of $77.5 million • Book value per share of common stock of $16.27 • Common stock dividend of $0.46 per share Dividend • 9.9% annualized dividend yield based upon closing stock price on October 23, 2018 • Committed capital to $285.0 million of commercial real estate loans, $87.0 million of which were funded during the quarter • Total committed capital for nine months ended September 30, 2018 - $2.2 billion Loan Originations • Funded $96.9 million for loans closed prior to the quarter • Total loan portfolio of $4.8 billion 2 • Weighted average remaining term of 2.7 Years Loan Portfolio 3 • Weighted average unlevered all-in-yield of 9.2% • 90% of loans have floating interest rates • Exchanged $206.2 million of 5.50% Convertible Senior Notes for 10,020,328 newly issued shares of ARI common stock and approximately $39.3 million in cash Capitalization • Increased the capacity on the Company’s master repurchase agreement with Deutsche Bank from $800.0 million to $1.0 billion 4 • Total common equity market capitalization of $2.5 billion at September 30, 2018 See footnotes on page 19 2Q3 Highlights • Net income available to common stockholders of $55.4 million, or $0.40 per diluted share of common stock 1 • Operating Earnings, excluding loss on early extinguishment of debt, of $60.9 million, or $0.47 per diluted share of common stock Financial Results • Net interest income of $77.5 million • Book value per share of common stock of $16.27 • Common stock dividend of $0.46 per share Dividend • 9.9% annualized dividend yield based upon closing stock price on October 23, 2018 • Committed capital to $285.0 million of commercial real estate loans, $87.0 million of which were funded during the quarter • Total committed capital for nine months ended September 30, 2018 - $2.2 billion Loan Originations • Funded $96.9 million for loans closed prior to the quarter • Total loan portfolio of $4.8 billion 2 • Weighted average remaining term of 2.7 Years Loan Portfolio 3 • Weighted average unlevered all-in-yield of 9.2% • 90% of loans have floating interest rates • Exchanged $206.2 million of 5.50% Convertible Senior Notes for 10,020,328 newly issued shares of ARI common stock and approximately $39.3 million in cash Capitalization • Increased the capacity on the Company’s master repurchase agreement with Deutsche Bank from $800.0 million to $1.0 billion 4 • Total common equity market capitalization of $2.5 billion at September 30, 2018 See footnotes on page 19 2

Financial Summary Income Statement 3Q18 2Q18 1Q18 ($ mm, except in per share data) Net interest income $77.5 $70.8 $63.2 Net income available to common stockholders 55.4 48.5 42.6 Diluted weighted average shares of common stock outstanding 153.9 124.6 111.9 Net income per diluted share of common stock $0.40 $0.39 $0.38 1 Operating Earnings 58.3 54.9 47.8 1 Operating Earnings, per share of common stock $0.45 $0.44 $0.43 1 Operating Earnings, excluding loss from early extinguishment of debt 60.9 54.9 47.8 1 Operating Earnings, excluding loss on early extinguishment of debt, per share of common stock $0.47 $0.44 $0.43 Balance Sheet 9/30/2018 12/31/2017 ($ mm) Investments at Amortized Cost, net $4,828 $3,680 5 Invested Net Equity at Cost 2,814 2,335 Common Stockholders' Equity 2,176 1,746 Preferred Stockholders' Equity (liquidation preference) 342 342 Convertible Senior Notes, net 370 585 6 Secured Debt Arrangements, net 1,997 1,331 7 Debt to Common Equity 1.0x 0.9x 8 Fixed Charge Coverage 2.7x 2.8x See footnotes on page 19 3Financial Summary Income Statement 3Q18 2Q18 1Q18 ($ mm, except in per share data) Net interest income $77.5 $70.8 $63.2 Net income available to common stockholders 55.4 48.5 42.6 Diluted weighted average shares of common stock outstanding 153.9 124.6 111.9 Net income per diluted share of common stock $0.40 $0.39 $0.38 1 Operating Earnings 58.3 54.9 47.8 1 Operating Earnings, per share of common stock $0.45 $0.44 $0.43 1 Operating Earnings, excluding loss from early extinguishment of debt 60.9 54.9 47.8 1 Operating Earnings, excluding loss on early extinguishment of debt, per share of common stock $0.47 $0.44 $0.43 Balance Sheet 9/30/2018 12/31/2017 ($ mm) Investments at Amortized Cost, net $4,828 $3,680 5 Invested Net Equity at Cost 2,814 2,335 Common Stockholders' Equity 2,176 1,746 Preferred Stockholders' Equity (liquidation preference) 342 342 Convertible Senior Notes, net 370 585 6 Secured Debt Arrangements, net 1,997 1,331 7 Debt to Common Equity 1.0x 0.9x 8 Fixed Charge Coverage 2.7x 2.8x See footnotes on page 19 3

Q3 Investment Activity 3Q18 Investment Summary Outstanding Portfolio ($ mm) Loans Closed 2 Commitments to New Loans $285 9 Add-on Fundings $97 3 Weighted Average Unlevered All-in-Yield 7.7% 12 10 Weighted Average Loan-to-Value (“LTV”) 49% See footnotes on page 19 4Q3 Investment Activity 3Q18 Investment Summary Outstanding Portfolio ($ mm) Loans Closed 2 Commitments to New Loans $285 9 Add-on Fundings $97 3 Weighted Average Unlevered All-in-Yield 7.7% 12 10 Weighted Average Loan-to-Value (“LTV”) 49% See footnotes on page 19 4

YTD Investment Activity YTD Investment Summary Outstanding Portfolio ($ mm) Loans Closed 21 Commitments to New Loans $2,175 13 Add-on Fundings $175 3 Weighted Average Unlevered All-in-Yield 8.3% 12 10 Weighted Average Loan-to-Value (“LTV”) 58% See footnotes on page 19 5YTD Investment Activity YTD Investment Summary Outstanding Portfolio ($ mm) Loans Closed 21 Commitments to New Loans $2,175 13 Add-on Fundings $175 3 Weighted Average Unlevered All-in-Yield 8.3% 12 10 Weighted Average Loan-to-Value (“LTV”) 58% See footnotes on page 19 5

Q3 Investment Activity Summary of New Investments 14 • £154.5 million ($198.0 million) floating-rate senior mortgage loan (none of which was funded at closing) for the redevelopment and repositioning of a ~275,000 square ft. office tower located in London, U.K. • $87.0 million floating-rate senior mortgage loan (all of which was funded at closing) secured by a 453-key full-service landmark hotel in Detroit, Michigan Summary of Repayments and Sales • $75 million floating-rate mezzanine loan secured by a pledge of equity interest in ~754,800 square ft. of office and retail space located in Brooklyn, New York • $65 million floating-rate senior mortgage loan secured by two low-rise retail properties with ~84,000 square ft. of retail space located in Manhattan, New York • $36 million floating-rate senior mortgage loan secured by a ten-story retail/office building with ~57,000 square ft. located in Manhattan, New York • Sold $75 million ($18 million of which was funded) floating-rate mezzanine loan for the construction of an office campus aggregating ~675,000 square feet of office space in Renton, Washington; ARI still holds the $190 million first mortgage loan ($65 million of which is funded) • $32 million in partial repayments, $28 million of which were from first mortgage loans and $4 million of which were from subordinate loans See footnotes on page 19 6Q3 Investment Activity Summary of New Investments 14 • £154.5 million ($198.0 million) floating-rate senior mortgage loan (none of which was funded at closing) for the redevelopment and repositioning of a ~275,000 square ft. office tower located in London, U.K. • $87.0 million floating-rate senior mortgage loan (all of which was funded at closing) secured by a 453-key full-service landmark hotel in Detroit, Michigan Summary of Repayments and Sales • $75 million floating-rate mezzanine loan secured by a pledge of equity interest in ~754,800 square ft. of office and retail space located in Brooklyn, New York • $65 million floating-rate senior mortgage loan secured by two low-rise retail properties with ~84,000 square ft. of retail space located in Manhattan, New York • $36 million floating-rate senior mortgage loan secured by a ten-story retail/office building with ~57,000 square ft. located in Manhattan, New York • Sold $75 million ($18 million of which was funded) floating-rate mezzanine loan for the construction of an office campus aggregating ~675,000 square feet of office space in Renton, Washington; ARI still holds the $190 million first mortgage loan ($65 million of which is funded) • $32 million in partial repayments, $28 million of which were from first mortgage loans and $4 million of which were from subordinate loans See footnotes on page 19 6

Commercial Real Estate Loan Portfolio Overview Loan Position at Amortized Cost Loan Position by Invested Net Equity at Amortized Cost ($ mm) 9/30/2018 6/30/2018 Number of Loans 68 Loans 70 Loans Amortized Cost $4,828 $4,867 5 Invested Net Equity at Cost $2,814 $2,886 11 Unfunded Loan Commitments $884 $818 Weighted Average Unlevered Yield on Floating-Rate Loans L+6.8% L+ 6.9% 3 Weighted Average Unlevered All-in-Yield on Loan Portfolio 9.2% 9.1% 2 Weighted Average Remaining Term 2.7 Years 2.8 Years See footnotes on page 19 7Commercial Real Estate Loan Portfolio Overview Loan Position at Amortized Cost Loan Position by Invested Net Equity at Amortized Cost ($ mm) 9/30/2018 6/30/2018 Number of Loans 68 Loans 70 Loans Amortized Cost $4,828 $4,867 5 Invested Net Equity at Cost $2,814 $2,886 11 Unfunded Loan Commitments $884 $818 Weighted Average Unlevered Yield on Floating-Rate Loans L+6.8% L+ 6.9% 3 Weighted Average Unlevered All-in-Yield on Loan Portfolio 9.2% 9.1% 2 Weighted Average Remaining Term 2.7 Years 2.8 Years See footnotes on page 19 7

Commercial Real Estate Loan Portfolio Diversification Geographic Diversification by Amortized Cost Property Type by Amortized Cost ($ mm) Mid United Other Manhattan, NY Brooklyn, NY Northeast Midwest Southeast West Atlantic Southwest Kingdom International Property Type Total Hotel $433 / 9% - - $86 / 2% $276 / 6% $199 / 4% $58 / 1% $88 / 2% - $90 / 2% $1,229 / 25% Residential-for-sale: inventory 206 / 4% 77 / 2% - - - - 28 / 1% - 291 / 6% - 603 / 13% Residential-for-sale: construction 329 / 7% - - - - 57 / 1% - - - - 385 / 8% Urban Predevelopment - 143 / 3% - - 222 / 5% 63 / 1% - - 250 / 5% - 677 / 14% Office 135 / 3% - - 249 / 5% - 63 / 1% - - 73 / 2% - 521 / 11% Multifamily 123 / 3% 112 / 2% 1 / 0% 56 / 1% 10 / 0% 64 / 1% - 6 / 0% 43 / 1% 35 / 1% 450 / 9% Mixed Use 139 / 3% - - 175 / 4% 7 / 0% - - - - - 321 / 7% Healthcare - - 22 / 0% 30 / 1% 47 / 1% 58 / 1% 30 / 1% 19 / 0% 49 / 1% - 256 / 5% Retail Center - - - 171 / 4% 31 / 1% - - - - - 202 / 4% 15 Other - - 15 / 0% 22 / 0% 13 / 0% 6 / 0% 95 / 2% - - - 151 / 3% Industrial - - - 10 / 0% 4 / 0% 13 / 0% 2 / 0% 3 / 0% - - 32 / 1% 16 Total $1,365 / 28% $332 / 7% $37 / 1% $800 / 16% $609 / 13% $523 / 11% $214 / 4% $116 / 2% $706 / 15% $125 / 3% $4,828 / 100% See footnotes on page 19 8Commercial Real Estate Loan Portfolio Diversification Geographic Diversification by Amortized Cost Property Type by Amortized Cost ($ mm) Mid United Other Manhattan, NY Brooklyn, NY Northeast Midwest Southeast West Atlantic Southwest Kingdom International Property Type Total Hotel $433 / 9% - - $86 / 2% $276 / 6% $199 / 4% $58 / 1% $88 / 2% - $90 / 2% $1,229 / 25% Residential-for-sale: inventory 206 / 4% 77 / 2% - - - - 28 / 1% - 291 / 6% - 603 / 13% Residential-for-sale: construction 329 / 7% - - - - 57 / 1% - - - - 385 / 8% Urban Predevelopment - 143 / 3% - - 222 / 5% 63 / 1% - - 250 / 5% - 677 / 14% Office 135 / 3% - - 249 / 5% - 63 / 1% - - 73 / 2% - 521 / 11% Multifamily 123 / 3% 112 / 2% 1 / 0% 56 / 1% 10 / 0% 64 / 1% - 6 / 0% 43 / 1% 35 / 1% 450 / 9% Mixed Use 139 / 3% - - 175 / 4% 7 / 0% - - - - - 321 / 7% Healthcare - - 22 / 0% 30 / 1% 47 / 1% 58 / 1% 30 / 1% 19 / 0% 49 / 1% - 256 / 5% Retail Center - - - 171 / 4% 31 / 1% - - - - - 202 / 4% 15 Other - - 15 / 0% 22 / 0% 13 / 0% 6 / 0% 95 / 2% - - - 151 / 3% Industrial - - - 10 / 0% 4 / 0% 13 / 0% 2 / 0% 3 / 0% - - 32 / 1% 16 Total $1,365 / 28% $332 / 7% $37 / 1% $800 / 16% $609 / 13% $523 / 11% $214 / 4% $116 / 2% $706 / 15% $125 / 3% $4,828 / 100% See footnotes on page 19 8

Senior Loan Portfolio Overview Unfunded Fully-extended Property Type Risk Rating Origination Date Amortized Cost Commitment Construction Loan Maturity Location 1/2016 $222 - 7/2019 Miami, FL Urban Predevelopment 3 3/2018 220 - 3/2021 London, UK Residential-for-sale: inventory 3 Hotel 3 9/2016 215 - 8/2021 Manhattan, NY 4/2017 182 - 3/2019 London, UK Urban Predevelopment 3 11/2017 174 - 1/2023 Chicago, IL Office 3 11/2014 171 - 9/2020 Cincinnati, OH Retail Center 4 Hotel 3 4/2018 151 2 4/2023 Honolulu, HI 3/2017 143 - 7/2020 Brooklyn, NY Urban Predevelopment 3 17 9/2015 140 - 6/2023 Manhattan, NY Hotel 3 5/2018 139 - 6/2023 Miami, FL Hotel 3 9/2016 133 - 10/2020 Chicago, IL Mixed Use 3 7/2017 125 - 6/2019 Manhattan, NY Mixed Use 2 11/2017 122 126 Y 12/2022 Manhattan, NY Office 3 6/2018 99 - 6/2020 Manhattan, NY Residential-for-sale: inventory 3 7/2018 86 - 8/2021 Detroit, MI Hotel 3 4/2014 80 - 7/2023 Various Multifamily 3 10/2016 80 - 8/2019 Manassas, VA Other 2 Residential-for-sale: inventory 3 5/2018 77 2 6/2020 Brooklyn, NY 3/2017 77 - 3/2022 Atlanta, GA Hotel 2 12/2017 75 58 3/2022 London, UK Office 3 6/2018 71 - 6/2020 London, UK Residential-for-sale: inventory 3 7/2017 68 11 4/2019 London, UK Urban Predevelopment 3 10/2017 67 - 11/2021 Brooklyn, NY Multifamily 3 12/2016 63 18 12/2020 Los Angeles, CA Urban Predevelopment 3 1/2018 63 125 Y 1/2022 Renton, WA Office 3 4/2018 63 - 5/2023 Scottsdale, AZ Hotel 3 12/2017 63 27 Y 12/2022 Manhattan, NY Hotel 3 1/2017 60 - 1/2022 Miami, FL Hotel 2 Multifamily 3 11/2014 59 - 11/2021 Various 3/2018 59 28 4/2023 Chicago, IL Office 3 5/2018 50 - 4/2021 Manhattan, NY Residential-for-sale: inventory 3 5/2016 46 6 6/2019 Brooklyn, NY Multifamily 3 Multifamily 3 10/2017 43 - 10/2022 London, UK 12/2015 42 2 12/2020 St. Thomas, USVI Hotel 3 12/2017 40 - 1/2020 Manhattan, NY Multifamily 3 2/2018 38 - 3/2023 Pittsburgh, PA Hotel 3 18 11/2014 34 - 11/2019 Williston, ND Multifamily 5 2/2017 31 - 10/2018 Miami, FL Retail Center 3 18 2/2014 28 - 4/2019 Bethesda, MD Residential-for-sale: inventory 5 Residential-for-sale: construction 3 1/2018 16 63 Y 1/2023 Manhattan, NY 7/2017 14 - 2/2019 Manhattan, NY Mixed Use 3 3/2018 (1) 115 Y 3/2023 San Francisco, CA Residential-for-sale: construction 2 8/2018 (2) 201 Y 12/2022 London, UK Office 3 Sub Total/W.A. - Senior Loans $3,724 $783 7% 2.6 Years 3 Weighted Average Yield on Loans with Floating Rate – L+5.6% - Weighted Average All-in Yield on Senior Loans – 7.8% See footnotes on page 19 9Senior Loan Portfolio Overview Unfunded Fully-extended Property Type Risk Rating Origination Date Amortized Cost Commitment Construction Loan Maturity Location 1/2016 $222 - 7/2019 Miami, FL Urban Predevelopment 3 3/2018 220 - 3/2021 London, UK Residential-for-sale: inventory 3 Hotel 3 9/2016 215 - 8/2021 Manhattan, NY 4/2017 182 - 3/2019 London, UK Urban Predevelopment 3 11/2017 174 - 1/2023 Chicago, IL Office 3 11/2014 171 - 9/2020 Cincinnati, OH Retail Center 4 Hotel 3 4/2018 151 2 4/2023 Honolulu, HI 3/2017 143 - 7/2020 Brooklyn, NY Urban Predevelopment 3 17 9/2015 140 - 6/2023 Manhattan, NY Hotel 3 5/2018 139 - 6/2023 Miami, FL Hotel 3 9/2016 133 - 10/2020 Chicago, IL Mixed Use 3 7/2017 125 - 6/2019 Manhattan, NY Mixed Use 2 11/2017 122 126 Y 12/2022 Manhattan, NY Office 3 6/2018 99 - 6/2020 Manhattan, NY Residential-for-sale: inventory 3 7/2018 86 - 8/2021 Detroit, MI Hotel 3 4/2014 80 - 7/2023 Various Multifamily 3 10/2016 80 - 8/2019 Manassas, VA Other 2 Residential-for-sale: inventory 3 5/2018 77 2 6/2020 Brooklyn, NY 3/2017 77 - 3/2022 Atlanta, GA Hotel 2 12/2017 75 58 3/2022 London, UK Office 3 6/2018 71 - 6/2020 London, UK Residential-for-sale: inventory 3 7/2017 68 11 4/2019 London, UK Urban Predevelopment 3 10/2017 67 - 11/2021 Brooklyn, NY Multifamily 3 12/2016 63 18 12/2020 Los Angeles, CA Urban Predevelopment 3 1/2018 63 125 Y 1/2022 Renton, WA Office 3 4/2018 63 - 5/2023 Scottsdale, AZ Hotel 3 12/2017 63 27 Y 12/2022 Manhattan, NY Hotel 3 1/2017 60 - 1/2022 Miami, FL Hotel 2 Multifamily 3 11/2014 59 - 11/2021 Various 3/2018 59 28 4/2023 Chicago, IL Office 3 5/2018 50 - 4/2021 Manhattan, NY Residential-for-sale: inventory 3 5/2016 46 6 6/2019 Brooklyn, NY Multifamily 3 Multifamily 3 10/2017 43 - 10/2022 London, UK 12/2015 42 2 12/2020 St. Thomas, USVI Hotel 3 12/2017 40 - 1/2020 Manhattan, NY Multifamily 3 2/2018 38 - 3/2023 Pittsburgh, PA Hotel 3 18 11/2014 34 - 11/2019 Williston, ND Multifamily 5 2/2017 31 - 10/2018 Miami, FL Retail Center 3 18 2/2014 28 - 4/2019 Bethesda, MD Residential-for-sale: inventory 5 Residential-for-sale: construction 3 1/2018 16 63 Y 1/2023 Manhattan, NY 7/2017 14 - 2/2019 Manhattan, NY Mixed Use 3 3/2018 (1) 115 Y 3/2023 San Francisco, CA Residential-for-sale: construction 2 8/2018 (2) 201 Y 12/2022 London, UK Office 3 Sub Total/W.A. - Senior Loans $3,724 $783 7% 2.6 Years 3 Weighted Average Yield on Loans with Floating Rate – L+5.6% - Weighted Average All-in Yield on Senior Loans – 7.8% See footnotes on page 19 9

Subordinate Loan Portfolio Overview Unfunded Fully-extended Property Type Risk Rating Origination Date Amortized Cost Commitment Construction Loan Maturity Location 19 6/2015 $177 - Y 7/2020 Manhattan, NY Residential-for-sale: construction 3 10/2016 112 - 10/2021 Various Healthcare 3 6/2018 95 - 5/2019 Various Healthcare 3 Residential-for-sale: construction 3 2/2016 78 - Y 2/2021 Manhattan, NY 9/2017 72 - 9/2022 Various Other 3 10/2015 61 2 6/2019 Manhattan, NY Multifamily 3 Residential-for-sale: construction 3 12/2017 58 - Y 4/2023 Los Angeles, CA 1/2015 49 - 12/2019 Various Healthcare 3 6/2018 48 - 2/2023 Various Hotel 3 Mixed Use 3 1/2017 42 - 2/2027 Cleveland, OH 19 11/2017 39 - Y 7/2020 Manhattan, NY Residential-for-sale: construction 3 10/2016 34 - 10/2020 Manhattan, NY Residential-for-sale: inventory 3 5/2013 32 - 5/2023 Various Industrial 3 6/2015 25 - 7/2025 Phoenix, AZ Hotel 3 6/2017 24 - 12/2020 Manhattan, NY Residential-for-sale: inventory 3 5/2018 21 - 5/2028 Cleveland, OH Multifamily 3 6/2015 20 - 7/2019 Washington, DC Hotel 3 Hotel 3 2/2015 20 - 1/2020 Burbank, CA 6/2018 20 - 6/2023 Las Vegas, NV Hotel 3 12/2017 19 90 Y 6/2022 Manhattan, NY Residential-for-sale: construction 3 Hotel 3 9/2015 15 9 6/2023 Manhattan, NY 17 7/2013 14 - 7/2022 Manhattan, NY Office 3 9/2012 9 - 10/2022 Kansas City, MO Office 3 Hotel 3 5/2017 8 - 6/2027 Anaheim, CA 8/2017 8 - 9/2024 Troy, MI Office 3 7/2012 7 - 8/2022 Chapel Hill, NC Mixed Use 3 Sub Total/W.A. - Subordinate Loans $1,104 $101 34% 3.0 Years Total/W.A. Loans $4,828 $884 13% 2.7 Years 3 Weighted Average Yield on Loans with Floating Rate – L+11.7% - Weighted Average All-in Yield on Subordinate Loans – 13.6% TOTAL PORTFOLIO WEIGHTED AVERAGE: 3 Yield on Loans with Floating Rate – L+6.8% - All-in-Yield – 9.2% See footnotes on page 19 10Subordinate Loan Portfolio Overview Unfunded Fully-extended Property Type Risk Rating Origination Date Amortized Cost Commitment Construction Loan Maturity Location 19 6/2015 $177 - Y 7/2020 Manhattan, NY Residential-for-sale: construction 3 10/2016 112 - 10/2021 Various Healthcare 3 6/2018 95 - 5/2019 Various Healthcare 3 Residential-for-sale: construction 3 2/2016 78 - Y 2/2021 Manhattan, NY 9/2017 72 - 9/2022 Various Other 3 10/2015 61 2 6/2019 Manhattan, NY Multifamily 3 Residential-for-sale: construction 3 12/2017 58 - Y 4/2023 Los Angeles, CA 1/2015 49 - 12/2019 Various Healthcare 3 6/2018 48 - 2/2023 Various Hotel 3 Mixed Use 3 1/2017 42 - 2/2027 Cleveland, OH 19 11/2017 39 - Y 7/2020 Manhattan, NY Residential-for-sale: construction 3 10/2016 34 - 10/2020 Manhattan, NY Residential-for-sale: inventory 3 5/2013 32 - 5/2023 Various Industrial 3 6/2015 25 - 7/2025 Phoenix, AZ Hotel 3 6/2017 24 - 12/2020 Manhattan, NY Residential-for-sale: inventory 3 5/2018 21 - 5/2028 Cleveland, OH Multifamily 3 6/2015 20 - 7/2019 Washington, DC Hotel 3 Hotel 3 2/2015 20 - 1/2020 Burbank, CA 6/2018 20 - 6/2023 Las Vegas, NV Hotel 3 12/2017 19 90 Y 6/2022 Manhattan, NY Residential-for-sale: construction 3 Hotel 3 9/2015 15 9 6/2023 Manhattan, NY 17 7/2013 14 - 7/2022 Manhattan, NY Office 3 9/2012 9 - 10/2022 Kansas City, MO Office 3 Hotel 3 5/2017 8 - 6/2027 Anaheim, CA 8/2017 8 - 9/2024 Troy, MI Office 3 7/2012 7 - 8/2022 Chapel Hill, NC Mixed Use 3 Sub Total/W.A. - Subordinate Loans $1,104 $101 34% 3.0 Years Total/W.A. Loans $4,828 $884 13% 2.7 Years 3 Weighted Average Yield on Loans with Floating Rate – L+11.7% - Weighted Average All-in Yield on Subordinate Loans – 13.6% TOTAL PORTFOLIO WEIGHTED AVERAGE: 3 Yield on Loans with Floating Rate – L+6.8% - All-in-Yield – 9.2% See footnotes on page 19 10

Loan Portfolio Maturity Profile 20,21,22 ($ mm) Fully Extended Loan Maturities and Estimated Future Fundings See footnotes on page 19 11Loan Portfolio Maturity Profile 20,21,22 ($ mm) Fully Extended Loan Maturities and Estimated Future Fundings See footnotes on page 19 11

Capital Structure Overview ~$5.3 billion Total Capitalization Capital Structure Composition Capital Structure Detail ($mm, except per share data) Amount ($) Capacity W.A. Rate Maturity Outstanding 23,24 2 Credit Facilities $3,001 USD L+2.26%/ Jan 2021 $2,014 GBP L+2.27% Convertible Notes 2019 Notes - 5.50% Mar 2019 36 2022 Notes - 4.75% Aug 2022 345 Total Convertible Debt $381 Total Debt $2,395 Preferred Stock 8.0% Series B Preferred $169 8.0% Series C Preferred (currently callable) 173 Total Preferred Stock $342 Common Equity Market Capitalization Stock Price as of 9/30/2018 $18.87 Shares outstanding (mm) 134 4 Common Equity Market Capitalization $2,524 Total Capitalization $5,261 7 Debt to Common Equity Ratio : 1.0x 8 See footnotes on page 19 Fixed Charge Coverage : 2.7x 12Capital Structure Overview ~$5.3 billion Total Capitalization Capital Structure Composition Capital Structure Detail ($mm, except per share data) Amount ($) Capacity W.A. Rate Maturity Outstanding 23,24 2 Credit Facilities $3,001 USD L+2.26%/ Jan 2021 $2,014 GBP L+2.27% Convertible Notes 2019 Notes - 5.50% Mar 2019 36 2022 Notes - 4.75% Aug 2022 345 Total Convertible Debt $381 Total Debt $2,395 Preferred Stock 8.0% Series B Preferred $169 8.0% Series C Preferred (currently callable) 173 Total Preferred Stock $342 Common Equity Market Capitalization Stock Price as of 9/30/2018 $18.87 Shares outstanding (mm) 134 4 Common Equity Market Capitalization $2,524 Total Capitalization $5,261 7 Debt to Common Equity Ratio : 1.0x 8 See footnotes on page 19 Fixed Charge Coverage : 2.7x 12

Liquidity ($ mm) 25 See footnotes on page 19 13Liquidity ($ mm) 25 See footnotes on page 19 13

Interest Rate Sensitivity 20 26 Net Interest Income Sensitivity to LIBOR Rate Profile of Loan Portfolio See footnotes on page 19 14Interest Rate Sensitivity 20 26 Net Interest Income Sensitivity to LIBOR Rate Profile of Loan Portfolio See footnotes on page 19 14

FinancialsFinancials

Consolidated Balance Sheets (in thousands - except share data) September 30, 2018 December 31, 2017 Assets: Cash $99,188 $77,671 Commercial mortgage loans, net (includes $3,245,600 and $2,148,368 pledged as collateral under secured debt arrangements in 2018 and 2017, respectively) 3,723,550 2,653,826 Subordinate loans, net 1,104,496 1,025,932 Loan proceeds held by servicer — 302,756 Other assets 31,894 28,420 Derivative assets, net 15,341 — Total Assets $4,974,469 $4,088,605 Liabilities and Stockholders' Equity Liabilities: Secured debt arrangements, net (net of deferred financing costs of $16,746 and $14,348 in 2018 and 2017, respectively) $1,996,871 $1,330,847 Convertible senior notes, net 370,174 584,897 Derivative liabilities, net — 5,644 Accounts payable, accrued expenses and other liabilities 79,538 70,906 Payable to related party 9,515 8,168 Total Liabilities 2,456,098 2,000,462 Stockholders’ Equity: Preferred stock, $0.01 par value, 50,000,000 shares authorized: Series B preferred stock, 6,770,393 shares issued and outstanding ($169,260 aggregate liquidation preference) in 2018 and 2017 68 68 Series C preferred stock, 6,900,000 shares issued and outstanding ($172,500 aggregate liquidation preference) in 2018 and 2017 69 69 Common stock, $0.01 par value, 450,000,000 shares authorized, 133,765,392 and 107,121,235 shares issued and outstanding in 2018 and 2017, respectively 1,338 1,071 Additional paid-in-capital 2,630,468 2,170,078 Accumulated deficit (113,572) (83,143) Total Stockholders’ Equity 2,518,371 2,088,143 Total Liabilities and Stockholders’ Equity $4,974,469 $4,088,605 16Consolidated Balance Sheets (in thousands - except share data) September 30, 2018 December 31, 2017 Assets: Cash $99,188 $77,671 Commercial mortgage loans, net (includes $3,245,600 and $2,148,368 pledged as collateral under secured debt arrangements in 2018 and 2017, respectively) 3,723,550 2,653,826 Subordinate loans, net 1,104,496 1,025,932 Loan proceeds held by servicer — 302,756 Other assets 31,894 28,420 Derivative assets, net 15,341 — Total Assets $4,974,469 $4,088,605 Liabilities and Stockholders' Equity Liabilities: Secured debt arrangements, net (net of deferred financing costs of $16,746 and $14,348 in 2018 and 2017, respectively) $1,996,871 $1,330,847 Convertible senior notes, net 370,174 584,897 Derivative liabilities, net — 5,644 Accounts payable, accrued expenses and other liabilities 79,538 70,906 Payable to related party 9,515 8,168 Total Liabilities 2,456,098 2,000,462 Stockholders’ Equity: Preferred stock, $0.01 par value, 50,000,000 shares authorized: Series B preferred stock, 6,770,393 shares issued and outstanding ($169,260 aggregate liquidation preference) in 2018 and 2017 68 68 Series C preferred stock, 6,900,000 shares issued and outstanding ($172,500 aggregate liquidation preference) in 2018 and 2017 69 69 Common stock, $0.01 par value, 450,000,000 shares authorized, 133,765,392 and 107,121,235 shares issued and outstanding in 2018 and 2017, respectively 1,338 1,071 Additional paid-in-capital 2,630,468 2,170,078 Accumulated deficit (113,572) (83,143) Total Stockholders’ Equity 2,518,371 2,088,143 Total Liabilities and Stockholders’ Equity $4,974,469 $4,088,605 16

Consolidated Statements of Operations (in thousands - except share data and per share data) Three months ended Nine months ended September 30, 2018 September 30, 2017 September 30, 2018 September 30, 2017 Net interest income: Interest income from commercial mortgage loans $71,179 $41,203 $188,434 $112,690 Interest income from subordinate loans 37,308 47,268 105,236 121,298 Interest income from securities — 2,625 — 13,379 Interest expense (31,007) (19,855) (82,184) (56,089) Net interest income $77,480 $71,241 $211,486 $191,278 Operating expenses: General and administrative expenses (includes equity-based compensation of $4,048 and $11,404 in 2018 and $2,635 and $9,887 of equity-based compensation in 2017, respectively) (5,843) (4,629) (16,493) (15,587) Management fees to related party (9,515) (8,309) (26,620) (23,484) Total operating expenses ($15,358) ($12,938) ($43,113) ($39,071) Loss from unconsolidated joint venture — — — (2,847) Other income 427 359 973 710 Provision for loan losses and impairments — — (5,000) (5,000) Realized loss on sale of assets — (4,076) — (5,118) Unrealized gain on securities — 13,488 — 11,830 Foreign currency gain (loss) (4,050) 7,763 (23,574) 17,848 Loss on early extinguishment of debt (2,573) — (2,573) — Gain (loss) on derivative instruments (includes unrealized gains (losses) of $5,045 and $20,986 in 2018 and $(7,302) and $(17,626) in 2017, respectively) 6,291 (7,481) 28,797 (17,916) Net income $62,217 $68,356 $166,996 $151,714 Preferred dividends (6,836) (11,148) (20,505) (29,768) Net income available to common stockholders $55,381 $57,208 $146,491 $121,946 Net income per basic share of common stock $0.42 $0.54 $1.19 $1.23 Net income per diluted share of common stock $0.40 $0.54 $1.14 $1.23 Basic weighted average shares of common stock outstanding 129,188,343 105,446,704 120,876,240 97,546,437 Diluted weighted average shares of common stock outstanding 153,918,435 106,812,721 150,424,889 98,919,689 Dividend declared per share of common stock $0.46 $0.46 $1.38 $1.38 17Consolidated Statements of Operations (in thousands - except share data and per share data) Three months ended Nine months ended September 30, 2018 September 30, 2017 September 30, 2018 September 30, 2017 Net interest income: Interest income from commercial mortgage loans $71,179 $41,203 $188,434 $112,690 Interest income from subordinate loans 37,308 47,268 105,236 121,298 Interest income from securities — 2,625 — 13,379 Interest expense (31,007) (19,855) (82,184) (56,089) Net interest income $77,480 $71,241 $211,486 $191,278 Operating expenses: General and administrative expenses (includes equity-based compensation of $4,048 and $11,404 in 2018 and $2,635 and $9,887 of equity-based compensation in 2017, respectively) (5,843) (4,629) (16,493) (15,587) Management fees to related party (9,515) (8,309) (26,620) (23,484) Total operating expenses ($15,358) ($12,938) ($43,113) ($39,071) Loss from unconsolidated joint venture — — — (2,847) Other income 427 359 973 710 Provision for loan losses and impairments — — (5,000) (5,000) Realized loss on sale of assets — (4,076) — (5,118) Unrealized gain on securities — 13,488 — 11,830 Foreign currency gain (loss) (4,050) 7,763 (23,574) 17,848 Loss on early extinguishment of debt (2,573) — (2,573) — Gain (loss) on derivative instruments (includes unrealized gains (losses) of $5,045 and $20,986 in 2018 and $(7,302) and $(17,626) in 2017, respectively) 6,291 (7,481) 28,797 (17,916) Net income $62,217 $68,356 $166,996 $151,714 Preferred dividends (6,836) (11,148) (20,505) (29,768) Net income available to common stockholders $55,381 $57,208 $146,491 $121,946 Net income per basic share of common stock $0.42 $0.54 $1.19 $1.23 Net income per diluted share of common stock $0.40 $0.54 $1.14 $1.23 Basic weighted average shares of common stock outstanding 129,188,343 105,446,704 120,876,240 97,546,437 Diluted weighted average shares of common stock outstanding 153,918,435 106,812,721 150,424,889 98,919,689 Dividend declared per share of common stock $0.46 $0.46 $1.38 $1.38 17

1 Reconciliation of GAAP Net Income to Operating Earnings (in thousands - except share and per share data) Three months ended Nine months ended 1 Operating Earnings : September 30, 2018 September 30, 2017 September 30, 2018 September 30, 2017 Net income available to common stockholders $55,381 $57,208 $146,491 $121,946 Adjustments: Equity-based compensation expense 4,048 2,635 11,404 9,887 Unrealized gain on securities — (13,488) — (11,830) (Gain) loss on derivative instruments (6,291) 7,481 (28,798) 17,916 Foreign currency (gain) loss, net 4,471 (7,850) 23,906 (18,135) Amortization of the convertible senior notes related to equity reclassification 728 769 3,024 1,995 Loss from unconsolidated joint venture — — — 2,847 Provision for loan losses and impairments — — 5,000 5,000 Series A preferred stock redemption charge — 3,016 — 3,016 Realized gain from unconsolidated joint venture — — — 346 Total adjustments: 2,956 (7,437) 14,536 11,042 1 Operating Earnings $58,337 $49,771 $161,027 $132,988 Realized loss and costs from sale of CMBS — 4,076 — 5,118 Loss on early extinguishment of debt 2,573 — 2,573 — 1 Operating Earnings excluding realized loss and costs from sale of CMBS and loss on early extinguishment of debt $60,910 $53,847 $163,600 $138,106 Weighted average diluted shares - Operating Earnings Weighted average diluted shares - GAAP 153,918,435 106,812,721 150,424,889 98,919,689 Weighted average unvested RSUs 1,593,070 — 1,617,398 — Reversal of hypothetical conversion of the Notes (24,730,092) — (29,548,649) — Weighted average diluted shares - Operating Earnings 130,781,413 106,812,721 122,493,638 98,919,689 1 Operating Earnings Per Share $0.45 $0.47 $1.31 $1.34 1 Operating Earnings, excluding realized loss and costs from sale of CMBS and loss on early extinguishment of debt, per share $0.47 $0.51 $1.34 $1.40 1 Computation of Share Count for Operating Earnings Basic weighted average shares of common stock outstanding 129,188,343 105,446,704 120,876,240 97,546,437 Weighted average unvested RSUs 1,593,070 1,366,017 1,617,398 1,373,252 Weighted average diluted shares - Operating Earnings 130,781,413 106,812,721 122,493,638 98,919,689 See footnotes on page 19 181 Reconciliation of GAAP Net Income to Operating Earnings (in thousands - except share and per share data) Three months ended Nine months ended 1 Operating Earnings : September 30, 2018 September 30, 2017 September 30, 2018 September 30, 2017 Net income available to common stockholders $55,381 $57,208 $146,491 $121,946 Adjustments: Equity-based compensation expense 4,048 2,635 11,404 9,887 Unrealized gain on securities — (13,488) — (11,830) (Gain) loss on derivative instruments (6,291) 7,481 (28,798) 17,916 Foreign currency (gain) loss, net 4,471 (7,850) 23,906 (18,135) Amortization of the convertible senior notes related to equity reclassification 728 769 3,024 1,995 Loss from unconsolidated joint venture — — — 2,847 Provision for loan losses and impairments — — 5,000 5,000 Series A preferred stock redemption charge — 3,016 — 3,016 Realized gain from unconsolidated joint venture — — — 346 Total adjustments: 2,956 (7,437) 14,536 11,042 1 Operating Earnings $58,337 $49,771 $161,027 $132,988 Realized loss and costs from sale of CMBS — 4,076 — 5,118 Loss on early extinguishment of debt 2,573 — 2,573 — 1 Operating Earnings excluding realized loss and costs from sale of CMBS and loss on early extinguishment of debt $60,910 $53,847 $163,600 $138,106 Weighted average diluted shares - Operating Earnings Weighted average diluted shares - GAAP 153,918,435 106,812,721 150,424,889 98,919,689 Weighted average unvested RSUs 1,593,070 — 1,617,398 — Reversal of hypothetical conversion of the Notes (24,730,092) — (29,548,649) — Weighted average diluted shares - Operating Earnings 130,781,413 106,812,721 122,493,638 98,919,689 1 Operating Earnings Per Share $0.45 $0.47 $1.31 $1.34 1 Operating Earnings, excluding realized loss and costs from sale of CMBS and loss on early extinguishment of debt, per share $0.47 $0.51 $1.34 $1.40 1 Computation of Share Count for Operating Earnings Basic weighted average shares of common stock outstanding 129,188,343 105,446,704 120,876,240 97,546,437 Weighted average unvested RSUs 1,593,070 1,366,017 1,617,398 1,373,252 Weighted average diluted shares - Operating Earnings 130,781,413 106,812,721 122,493,638 98,919,689 See footnotes on page 19 18

Footnotes 1. Operating Earnings is a non-GAAP financial measure that is used by the Company to approximate cash available for distribution and is defined by the Company as net income available to common stockholders, computed in accordance with GAAP, adjusted for (i) equity-based compensation expense (a portion of which may become cash-based upon final vesting and settlement of awards should the holder elect net share settlement to satisfy income tax withholding); (ii) any unrealized gains or losses or other non-cash items included in net income available to common stockholders, (iii) unrealized income from unconsolidated joint ventures, (iv) foreign currency gains/losses, other than realized gains/(losses) related to interest income; (v) the non-cash amortization expense related to the reclassification of a portion of the convertible senior notes to stockholders’ equity in accordance with GAAP; and (vi) provision for loan losses and impairments. Please see slide 18 for a reconciliation of GAAP net income to Operating Earnings. Operating Earnings may also be adjusted to exclude certain other non-cash items, as determined by ACREFI Management, LLC, the Company’s external manager (the “Manager”) and approved by a majority of the Company's independent directors. 2. Assumes exercise of all extension options. 3. Weighted Average Unlevered All-in-Yield on the loan portfolio is based on the applicable benchmark rates as of September 30, 2018 on the floating rate loans and includes accrual of origination, extension, and exit fees. 4. Common equity market capitalization represents shares of common stock outstanding times the closing stock price on September 30, 2018. 5. Invested Net Equity at Cost is the amortized cost of loans less principal balance of secured debt arrangements; does not include debt secured by proceeds held by servicer. 6. Total debt balance less $16,746 and $14,348 at September 30, 2018 and December 31, 2017, respectively, in deferred financing costs. 7. Represents total secured debt arrangements and convertible senior notes, less cash and loan proceeds held by servicer to common equity. 8. Fixed charge coverage is EBITDA divided by interest expense and preferred stock dividends. 9. For loans closed prior to Q3 2018. 10. Reflects LTV as of date loans were originated or acquired. 11. Unfunded loan commitments are primarily funded to finance property improvements or lease-related expenditures by the borrowers. These future commitments are funded over the term of each loan, subject in certain cases to an expiration date. 12. Includes foreign currency appreciation/depreciation, PIK interest, loan loss reserves, and the accretion of loan costs and fees. 13. For loans closed prior to 2018. 14. Conversion to USD on the date of investment. 15. Other includes a data center and water park resorts. 16. Amounts and percentages may not foot due to rounding. 17. Both loans are secured by the same property. 18. Amortized cost for these loans is net of the recorded provisions for loan losses and impairments. 19. Both loans are secured by the same property. 20. Based upon face amount of loans. 21. Maturities reflect the fully funded amounts of the loans. 22. Future funding dates are based upon the Manager’s estimates based upon the best information available to the Manager at the time. There is no assurance that the payments will occur in accordance with these estimates or at all, which could affect the Company’s operating results. 23. Debt balance as of September 30, 2018, includes asset specific borrowing: currently $187 million max capacity, all of which is drawn. 24. Debt balance includes GBP converted to USD using applicable September 30, 2018 spot rate. 25. Subject to availability of qualifying collateral assets, and approval of lenders. 26. Any such hypothetical impact on interest rates on the Company’s variable rate borrowings does not consider the effect of any change in overall economic activity that could occur in a rising interest rate environment. Further, in the event of a change in interest rates of that magnitude, the Company may take actions to further mitigate the Company’s exposure to such a change. However, due to the uncertainty of the specific actions that would be taken and their possible effects, this analysis assumes no changes in the Company’s financial structure. The analysis incorporates movements in both USD LIBOR and GBP LIBOR. 19Footnotes 1. Operating Earnings is a non-GAAP financial measure that is used by the Company to approximate cash available for distribution and is defined by the Company as net income available to common stockholders, computed in accordance with GAAP, adjusted for (i) equity-based compensation expense (a portion of which may become cash-based upon final vesting and settlement of awards should the holder elect net share settlement to satisfy income tax withholding); (ii) any unrealized gains or losses or other non-cash items included in net income available to common stockholders, (iii) unrealized income from unconsolidated joint ventures, (iv) foreign currency gains/losses, other than realized gains/(losses) related to interest income; (v) the non-cash amortization expense related to the reclassification of a portion of the convertible senior notes to stockholders’ equity in accordance with GAAP; and (vi) provision for loan losses and impairments. Please see slide 18 for a reconciliation of GAAP net income to Operating Earnings. Operating Earnings may also be adjusted to exclude certain other non-cash items, as determined by ACREFI Management, LLC, the Company’s external manager (the “Manager”) and approved by a majority of the Company's independent directors. 2. Assumes exercise of all extension options. 3. Weighted Average Unlevered All-in-Yield on the loan portfolio is based on the applicable benchmark rates as of September 30, 2018 on the floating rate loans and includes accrual of origination, extension, and exit fees. 4. Common equity market capitalization represents shares of common stock outstanding times the closing stock price on September 30, 2018. 5. Invested Net Equity at Cost is the amortized cost of loans less principal balance of secured debt arrangements; does not include debt secured by proceeds held by servicer. 6. Total debt balance less $16,746 and $14,348 at September 30, 2018 and December 31, 2017, respectively, in deferred financing costs. 7. Represents total secured debt arrangements and convertible senior notes, less cash and loan proceeds held by servicer to common equity. 8. Fixed charge coverage is EBITDA divided by interest expense and preferred stock dividends. 9. For loans closed prior to Q3 2018. 10. Reflects LTV as of date loans were originated or acquired. 11. Unfunded loan commitments are primarily funded to finance property improvements or lease-related expenditures by the borrowers. These future commitments are funded over the term of each loan, subject in certain cases to an expiration date. 12. Includes foreign currency appreciation/depreciation, PIK interest, loan loss reserves, and the accretion of loan costs and fees. 13. For loans closed prior to 2018. 14. Conversion to USD on the date of investment. 15. Other includes a data center and water park resorts. 16. Amounts and percentages may not foot due to rounding. 17. Both loans are secured by the same property. 18. Amortized cost for these loans is net of the recorded provisions for loan losses and impairments. 19. Both loans are secured by the same property. 20. Based upon face amount of loans. 21. Maturities reflect the fully funded amounts of the loans. 22. Future funding dates are based upon the Manager’s estimates based upon the best information available to the Manager at the time. There is no assurance that the payments will occur in accordance with these estimates or at all, which could affect the Company’s operating results. 23. Debt balance as of September 30, 2018, includes asset specific borrowing: currently $187 million max capacity, all of which is drawn. 24. Debt balance includes GBP converted to USD using applicable September 30, 2018 spot rate. 25. Subject to availability of qualifying collateral assets, and approval of lenders. 26. Any such hypothetical impact on interest rates on the Company’s variable rate borrowings does not consider the effect of any change in overall economic activity that could occur in a rising interest rate environment. Further, in the event of a change in interest rates of that magnitude, the Company may take actions to further mitigate the Company’s exposure to such a change. However, due to the uncertainty of the specific actions that would be taken and their possible effects, this analysis assumes no changes in the Company’s financial structure. The analysis incorporates movements in both USD LIBOR and GBP LIBOR. 19