Attached files
| file | filename |
|---|---|
| 8-K - HOWARD BANCORP, INC. 8-K - Howard Bancorp Inc | a51888007.htm |
Exhibit 99.1

2018 Third QuarterEarnings Presentation October 2018 DRAFT v21

This presentation contains estimates, predictions, opinions, projections and other "forward-looking statements" within the meaning of Section 27A of the Securities Act of 1933, as amended (the “Securities Act”), and Section 21E of the Securities Exchange Act of 1934, as amended (the “Exchange Act”). Forward-looking statements often use words such as “anticipate,” “believe,” “contemplate,” “estimate,” “expect,” “forecast,” “intend,” “may,” “plan,” “project,” “should” “will,” or other words of similar meaning. You can also identify them by the fact that they do not relate strictly to historical or current facts. Such statements include, without limitation, references to Howard Bancorp, Inc.'s (“Howard”) beliefs, plans, objectives, goals, expectations, anticipations, assumptions, estimates, intensions and future performance, including our growth strategy and expansion plans, including potential acquisitions. Forward-looking statements involve known and unknown risks, uncertainties and other factors, which may be beyond our control, and which may cause our actual results, performance or achievements to be materially different from future results, performance or achievements expressed or implied by such forward-looking statements. 2 Forward Looking Statements Counsel to review
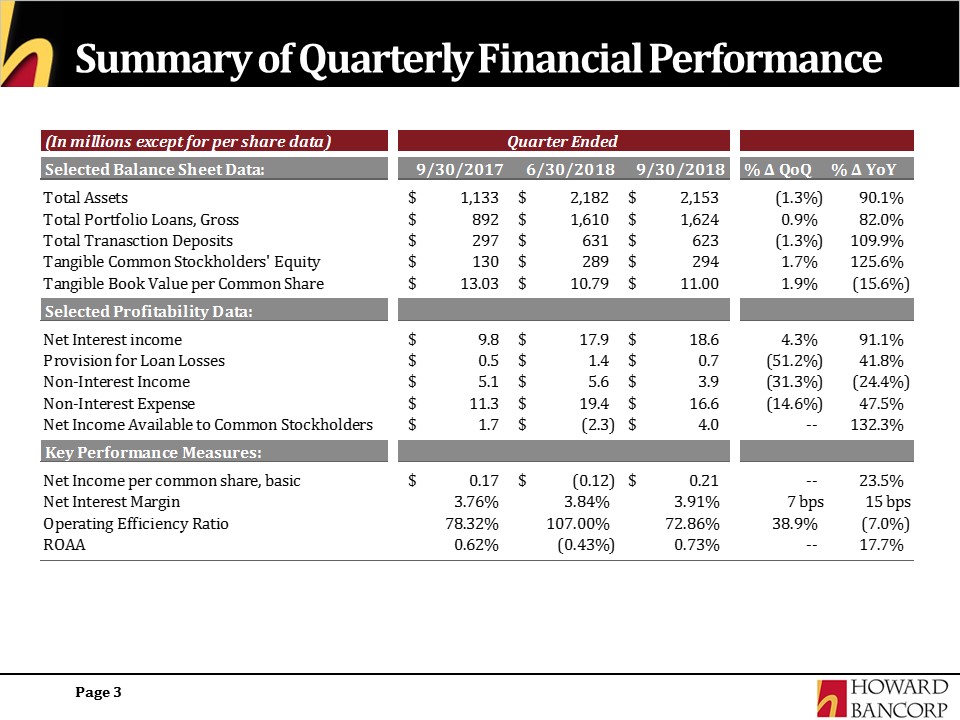
Summary of Quarterly Financial Performance 3
Third Quarter Highlights Net income and earnings per basic share improved as the company experienced lower merger related expenses. Earnings per basic share improved by 23.5% over 3rd Quarter 2017Third quarter sequential loan growth equaled 1% reflecting focus on growth in commercial loans (increasing 3.8%); acknowledging cyclical headwinds in non-owner occupied commercial real estateTransaction deposit levels remained strong at 38% of total deposits while overall deposits grew 4% sequentially during the quarter as we focused funding on local customers (CDs at comparable rates) versus FHLB advances. Cost of interest bearing deposits remained low at 0.80% for the quarterNet interest margin, net of fair market value adjustments, remained stable at 3.66%Cost savings from the merger are on track to exceed initial estimates Mortgage originations were $130 million and the team continues to focus both on higher margin and larger revenue generating loans 4
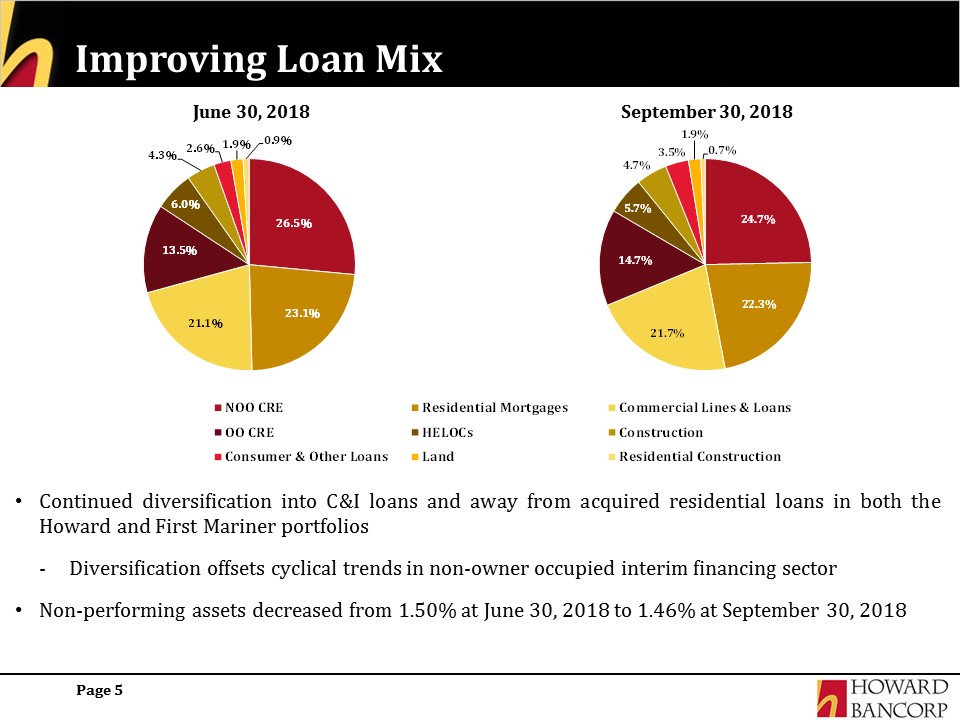
Improving Loan Mix 5 June 30, 2018 September 30, 2018 Continued diversification into C&I loans and away from acquired residential loans in both the Howard and First Mariner portfolios Diversification offsets cyclical trends in non-owner occupied interim financing sectorNon-performing assets decreased from 1.50% at June 30, 2018 to 1.46% at September 30, 2018
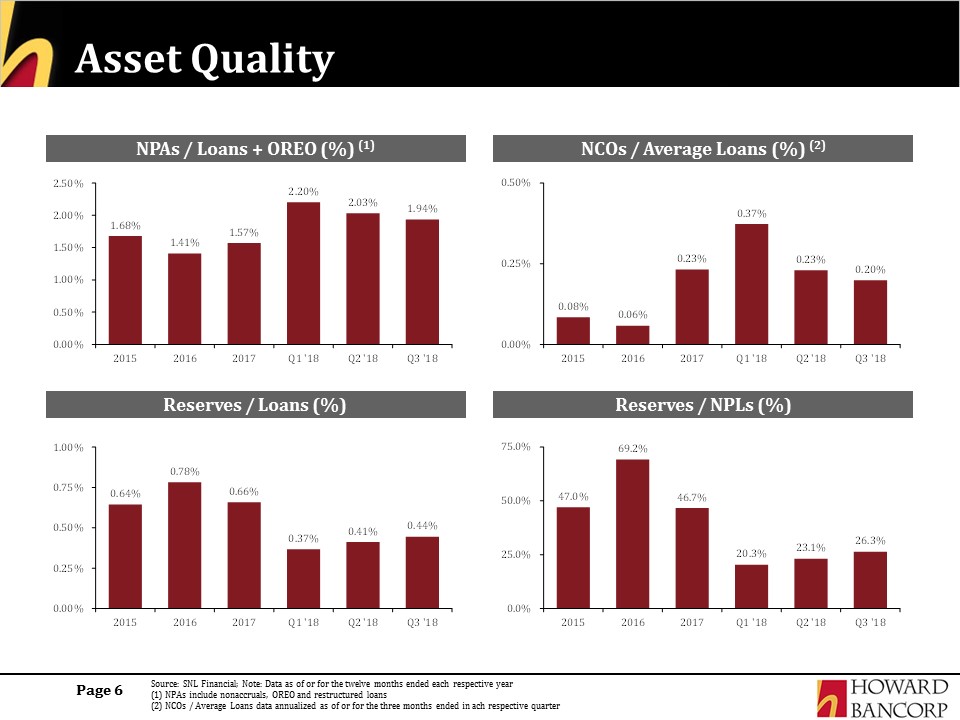
Asset Quality 6 NPAs / Loans + OREO (%) (1) NCOs / Average Loans (%) (2) Reserves / NPLs (%) Reserves / Loans (%) Source: SNL Financial; Note: Data as of or for the twelve months ended each respective year(1) NPAs include nonaccruals, OREO and restructured loans(2) NCOs / Average Loans data annualized as of or for the three months ended in ach respective quarter
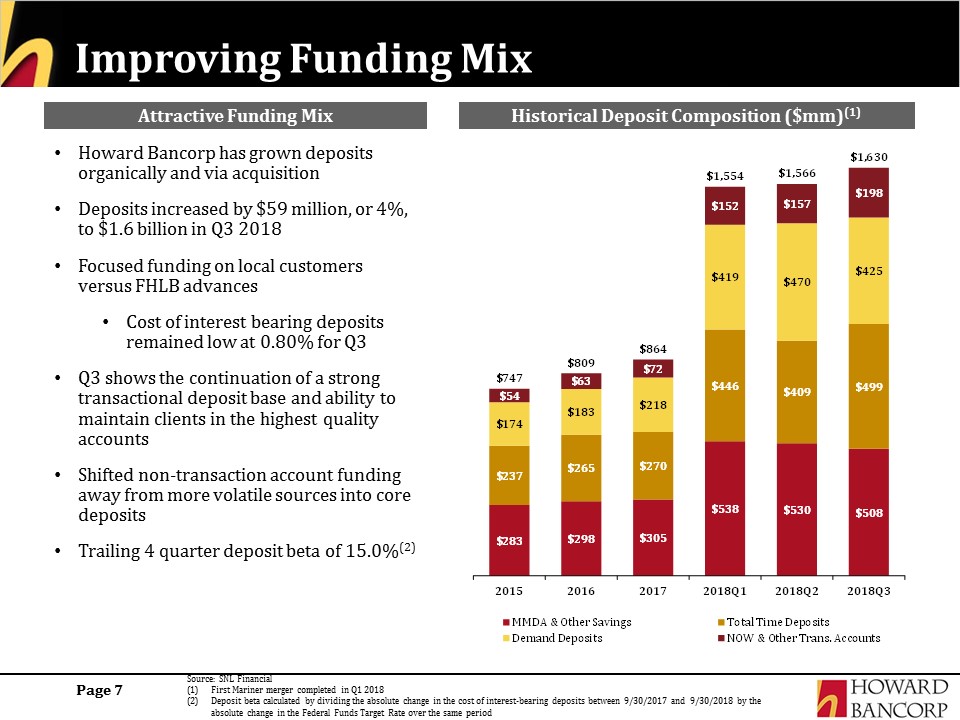
Improving Funding Mix 7 Howard Bancorp has grown deposits organically and via acquisition Deposits increased by $59 million, or 4%, to $1.6 billion in Q3 2018Focused funding on local customers versus FHLB advancesCost of interest bearing deposits remained low at 0.80% for Q3Q3 shows the continuation of a strong transactional deposit base and ability to maintain clients in the highest quality accounts Shifted non-transaction account funding away from more volatile sources into core depositsTrailing 4 quarter deposit beta of 15.0%(2) Historical Deposit Composition ($mm)(1) Attractive Funding Mix Source: SNL FinancialFirst Mariner merger completed in Q1 2018Deposit beta calculated by dividing the absolute change in the cost of interest-bearing deposits between 9/30/2017 and 9/30/2018 by the absolute change in the Federal Funds Target Rate over the same period
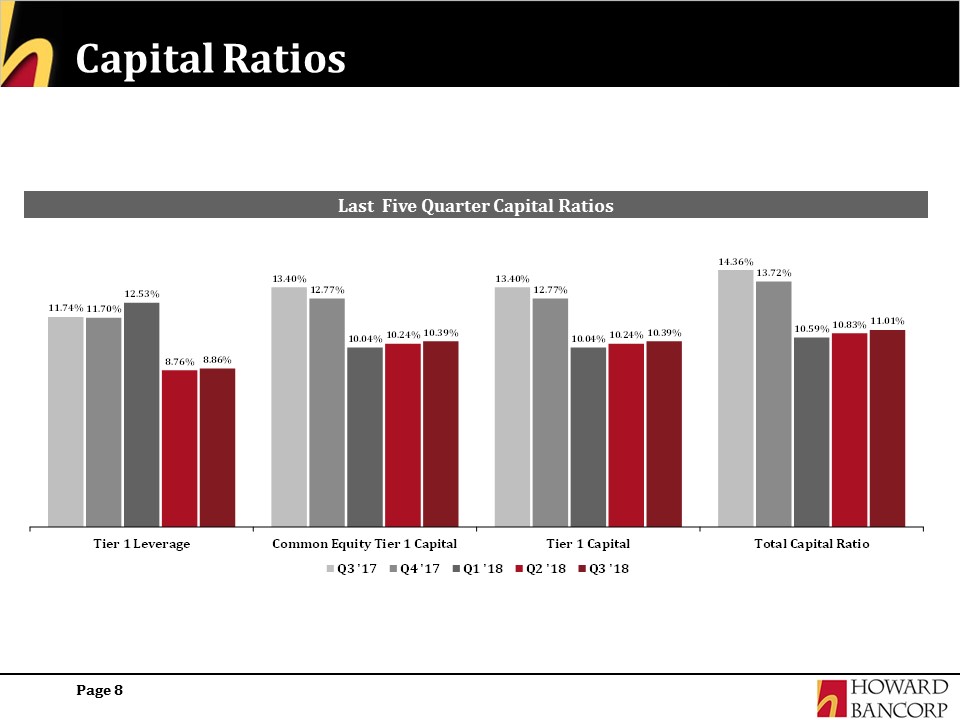
Capital Ratios 8 Last Five Quarter Capital Ratios
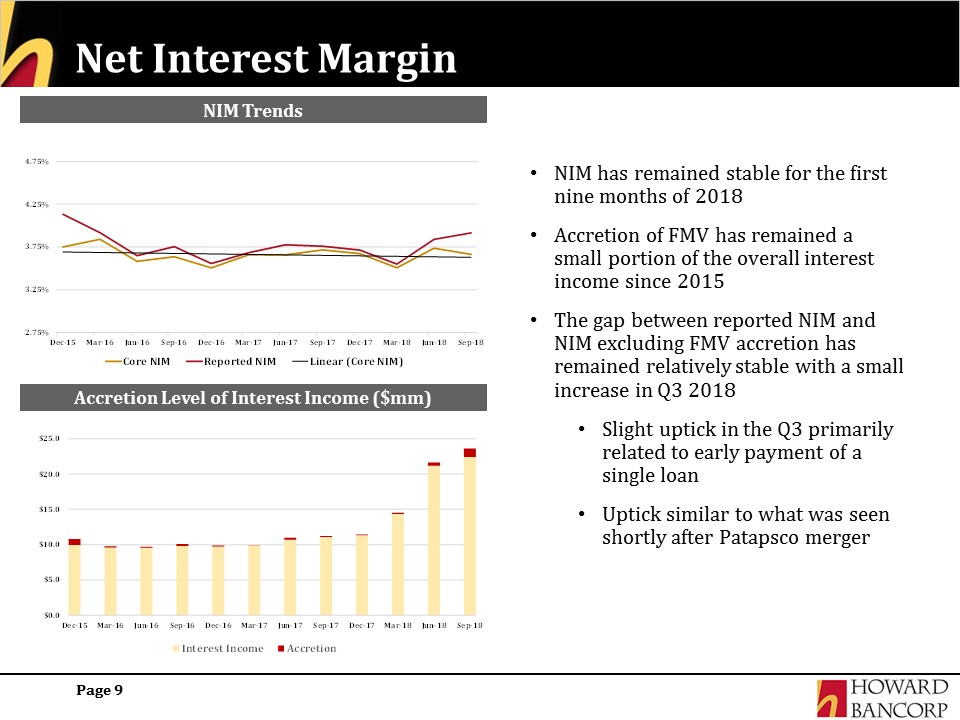
Net Interest Margin NIM has remained stable for the first nine months of 2018Accretion of FMV has remained a small portion of the overall interest income since 2015The gap between reported NIM and NIM excluding FMV accretion has remained relatively stable with a small increase in Q3 2018Slight uptick in the Q3 primarily related to early payment of a single loanUptick similar to what was seen shortly after Patapsco merger 9 NIM Trends Accretion Level of Interest Income ($mm)
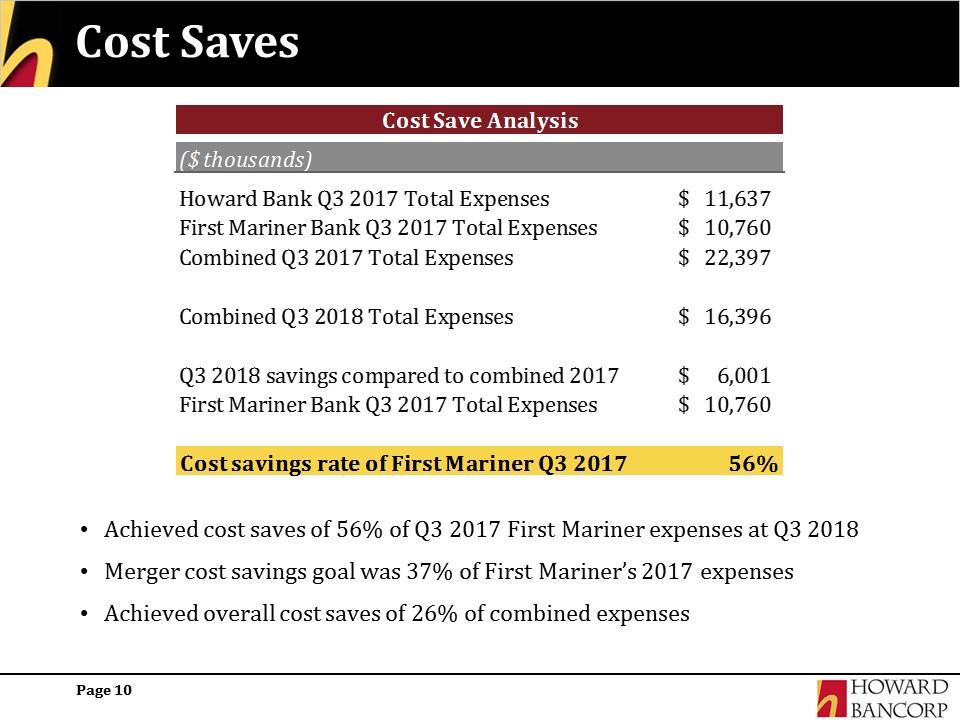
Cost Saves Achieved cost saves of 56% of Q3 2017 First Mariner expenses at Q3 2018 Merger cost savings goal was 37% of First Mariner’s 2017 expenses Achieved overall cost saves of 26% of combined expenses 10
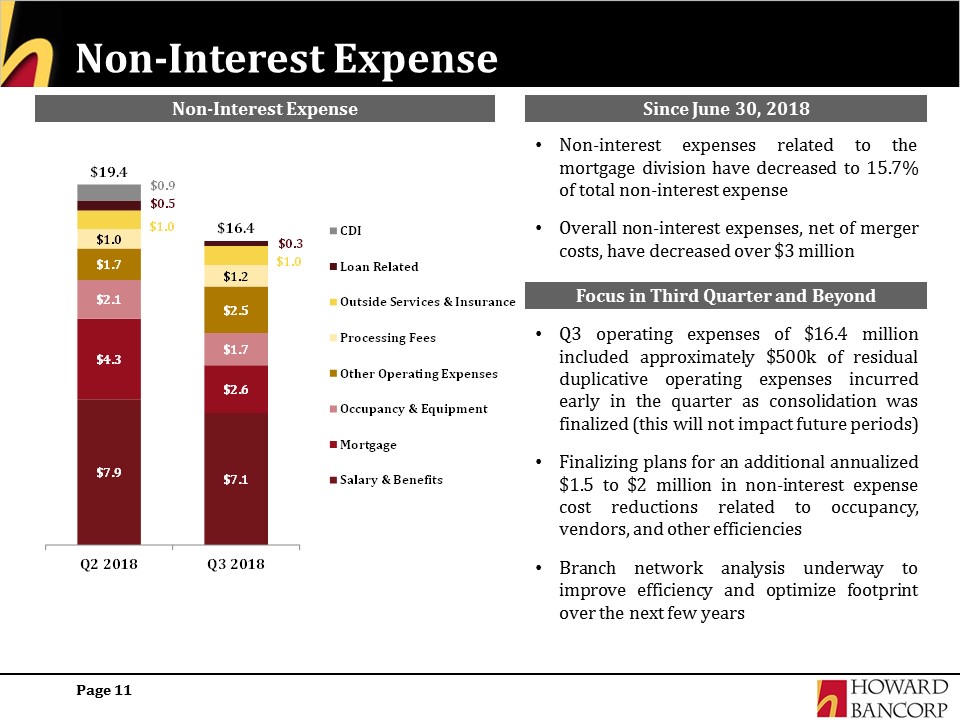
Non-Interest Expense Non-interest expenses related to the mortgage division have decreased to 15.7% of total non-interest expenseOverall non-interest expenses, net of merger costs, have decreased over $3 million 11 Since June 30, 2018 Focus in Third Quarter and Beyond Q3 operating expenses of $16.4 million included approximately $500k of residual duplicative operating expenses incurred early in the quarter as consolidation was finalized (this will not impact future periods)Finalizing plans for an additional annualized $1.5 to $2 million in non-interest expense cost reductions related to occupancy, vendors, and other efficienciesBranch network analysis underway to improve efficiency and optimize footprint over the next few years Non-Interest Expense

Mortgage Operations 12 Continue efforts to reduce overall volatility of the revenue streamThird quarter production was $130 million down from $242 million in the second quarter. The consumer direct channel was $70 million in the second quarterFocus both on higher margin and larger revenue generating loansRelationship based in market complements our platformManageable impact on future results
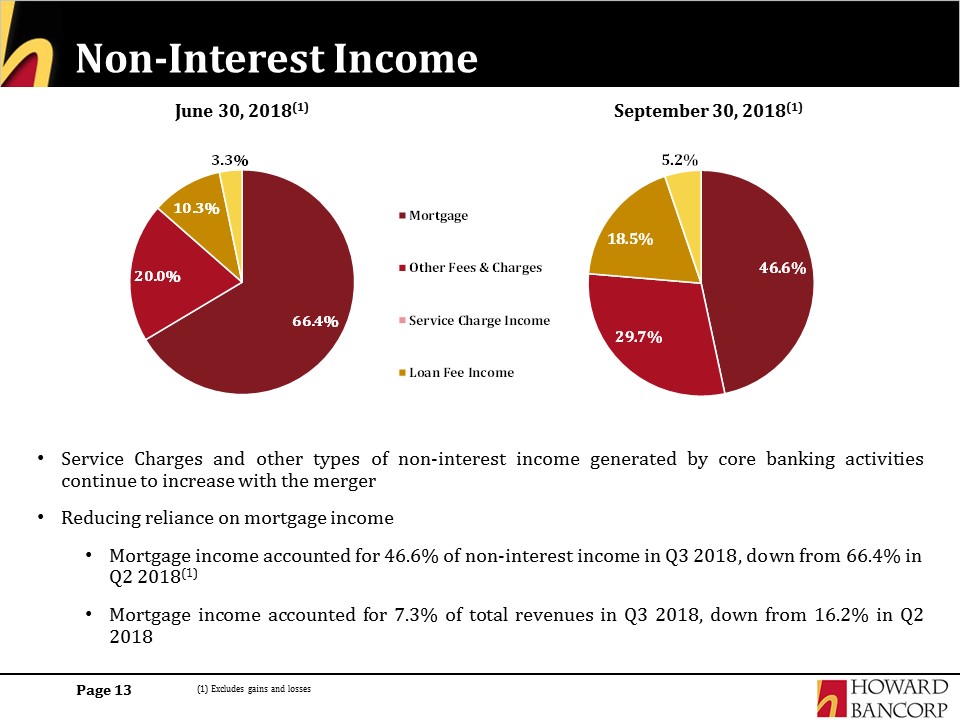
Non-Interest Income Service Charges and other types of non-interest income generated by core banking activities continue to increase with the mergerReducing reliance on mortgage income Mortgage income accounted for 46.6% of non-interest income in Q3 2018, down from 66.4% in Q2 2018(1)Mortgage income accounted for 7.3% of total revenues in Q3 2018, down from 16.2% in Q2 2018 13 June 30, 2018(1) September 30, 2018(1) (1) Excludes gains and losses

Operating Leverage 14 Recent initiatives will increase operating leverage Achieved cost savings and experiencing benefits of scale from First Mariner merger Optimizing lower profitability lines of business such as mortgageFurther branch optimizationBalance sheet positioned for growthImproved loan mixStrong core deposit base providing low cost of funds Low deposit beta to benefit future earnings growth in current environmentUnique positioning in the marketStable NIM and asset growth to increase return on assetsStable net interest margin of 3.66%High single digit asset growth

Summary Remarks 20% EPS accretion between Q3 2017 and Q3 2018 Double digit C&I loan growthFurther opportunities in core base plus verticals Higher value added loan mix High level of transaction deposits Increasing reliance on core deposits (38% Transaction Deposits)Higher value added deposit mix (0.80% cost of deposits)Stable core net interest margin Reduced reliance on volatile and marginally profitable mortgage banking income Higher quality non interest income mix Exceeding 37% target cost savings with First Mariner merger 56% actual and 26% combined cost savingsAdditional savings identified to be actualized in 2019Unique positioning as largest locally headquartered bank in the attractive consolidating Greater Baltimore marketOnly bank focused on SME 15
APPENDIX 16

Quarterly Financial Performance 17
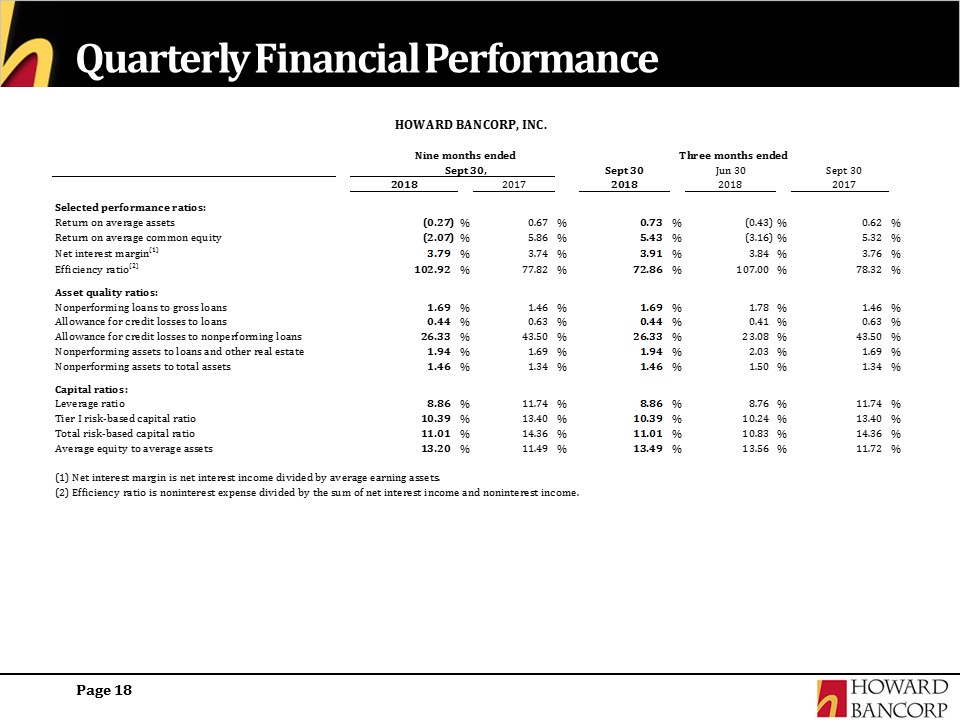
Quarterly Financial Performance 18