Attached files
| file | filename |
|---|---|
| EX-99.1 - EXHIBIT 99.1 - Franklin Financial Network Inc. | tv505435_ex99-1.htm |
| 8-K - FORM 8-K - Franklin Financial Network Inc. | tv505435_8k.htm |
Exhibit 99.2

Franklin Financial Network, Inc. (NYSE:FSB) Third Quarter 2018 Investor Call October 25, 2018

Forward - Looking Statements Except for the historical information contained herein, this presentation contains forward - looking statements within the meaning of Section 27A of the Securities Act of 1933, as amended, and Section 21E of the Securities Exchange Act of 1934, as amended. The forward - looking statements include, among other things, statements regarding intent, belief or expectations of the Company and can be identified by the use of words such as "may," "will," "should," "would," "assume," "outlook," "seek," "plan," "believe," "expect," "anticipate," "intend," "estimate," "forecast," and other comparable terms. The Company intends that all such statements be subject to the “safe harbor” provisions of those Acts. Because forward - looking statements involve risks and uncertainties, actual results may differ materially from those expressed or implied. Investors are cautioned not to place undue reliance on these forward - looking statements and are advised to carefully review the discussion of forward - looking statements and risk factors in documents the Company files with the Securities and Exchange Commission. The Company undertakes no obligation to publicly update or revise any forward - looking statements, whether as a result of new information, future events or otherwise, unless otherwise required by law. 1

Our Strategy – Proven and Consistent Strong Foundation in Place Leadership and governance Leading position in great markets Strong capital and pristine credit Scalable, efficient technology and systems Building Shareholder Value Soundness Growth Profitability 2

Experienced Leadership Team Industry Experience Years at FSB Richard E. Herrington Chairman, CEO & President 48 11 Sarah Meyerrose Executive VP & Chief Financial Officer 40 2 J. Myers Jones, III Executive VP & Chief Credit Officer 43 9 Lee M. Moss* President, Franklin Synergy Bank 45 4 David McDaniel Executive VP, Chief Lending Officer & Williamson County President 26 7 Kevin A. Herrington Executive VP & Chief Operating Officer, Franklin Synergy Bank 21 11 Terry R. Howell Executive VP & Corporate Risk Officer 36 2 Sally E. Bowers Executive VP & Chief Mortgage Officer 47 11 Sally P. Kimble Executive VP & Chief Administrative Officer 39 6 * Joined FSB as part of MidSouth Bank acquisition in July 2014. 3

Ranked 30 th in Forbes 2016 Best Places for Business and Careers Nashville is the state capital with MSA population of 1.9 million Nashville ranked 6th among nation’s top cities for real estate investing in 2017 Leading Industries: tourism, health care service, HCIT, logistics, publishing, insurance, music and entertainment Source: Nashville Chamber of Commerce, the Council for Community and Economic Research, Bureau of Economic Analysis, U.S. Dep art ment of Commerce, Forbes, Fortune, Red Report, Bureau of Labor Statistics, and SNL Financial Nashville - Davidson - Murfreesboro - Franklin, TN Metropolitan Statistical Area No state personal income tax on wages or estate tax MSA ranked 3rd by Bureau of Labor Statistics for best job growth in 2017 in MSAs with >1 million population County unemployment rate: 3.0% as of August 2018 21 accredited 4 - year colleges/universities Wealthiest county in Tennessee; 7 th wealthiest county in the nation; fastest growing county (2014 to 2017) in Tennessee Franklin 8 th fastest growing city in the U.S as of May 2018 Home to 40 corporate HQs and 7 Fortune 1,000 companies Three AAA rated government entities County ranked #1 fastest growing job market in the US in 2016 County unemployment rate: 2.8% as of August 2018 Median household income $113,712 (2018E) Williamson Rutherford One of the wealthiest counties in Tennessee and 2 nd fastest growing in 2017 Murfreesboro 2017 population growth of 3.8% Home of Nissan USA’s largest manufacturing facility; regional headquarters of General Mills, Amazon Fulfillment Center County unemployment rate: 3.1% as of August 2018 Median household income $65,746 (2018E) Ranked 7th in U.S. for job growth for 2017 577878_1.WOR / NY00813G 577878_1.WOR / NY00813G 577878_1.WOR / NY00813G 577878_1.WOR / NY00813G 577878_1.WOR / NY00813G 577878_1.WOR / NY00813G 577878_1.WOR / NY00813G 577878_1.WOR / NY00813G 577878_1.WOR / NY00813G 577878_1.WOR / NY00813G 577878_1.WOR / NY00813G 577878_1.WOR / NY00813G 577878_1.WOR / NY00813G 577878_1.WOR / NY00813G 577878_1.WOR / NY00813G 577878_1.WOR / NY00813G 577878_1.WOR / NY00813G 577878_1.WOR / NY00813G 577878_1.WOR / NY00813G 577878_1.WOR / NY00813G 577878_1.WOR / NY00813G 577878_1.WOR / NY00813G 577878_1.WOR / NY00813G 577878_1.WOR / NY00813G 577878_1.WOR / NY00813G 577878_1.WOR / NY00813G 577878_1.WOR / NY00813G 577878_1.WOR / NY00813G 577878_1.WOR / NY00813G 577878_1.WOR / NY00813G 577878_1.WOR / NY00813G 577878_1.WOR / NY00813G 577878_1.WOR / NY00813G 577878_1.WOR / NY00813G 577878_1.WOR / NY00813G 577878_1.WOR / NY00813G 577878_1.WOR / NY00813G 577878_1.WOR / NY00813G 577878_1.WOR / NY00813G 577878_1.WOR / NY00813G 577878_1.WOR / NY00813G 577878_1.WOR / NY00813G 577878_1.WOR / NY00813G 577878_1.WOR / NY00813G 577878_1.WOR / NY00813G 577878_1.WOR / NY00813G 577878_1.WOR / NY00813G 577878_1.WOR / NY00813G 577878_1.WOR / NY00813G Nashville Nashville Nashville Nashville Nashville Nashville Nashville Nashville Nashville Nashville Nashville Nashville Nashville Nashville Nashville Nashville Nashville Nashville Nashville Nashville Nashville Nashville Nashville Nashville Nashville Nashville Nashville Nashville Nashville Nashville Nashville Nashville Nashville Nashville Nashville Nashville Nashville Nashville Nashville Nashville Nashville Nashville Nashville Nashville Nashville Nashville Nashville Nashville Nashville Brentwood Brentwood Brentwood Brentwood Brentwood Brentwood Brentwood Brentwood Brentwood Brentwood Brentwood Brentwood Brentwood Brentwood Brentwood Brentwood Brentwood Brentwood Brentwood Brentwood Brentwood Brentwood Brentwood Brentwood Brentwood Brentwood Brentwood Brentwood Brentwood Brentwood Brentwood Brentwood Brentwood Brentwood Brentwood Brentwood Brentwood Brentwood Brentwood Brentwood Brentwood Brentwood Brentwood Brentwood Brentwood Brentwood Brentwood Brentwood Brentwood Franklin Franklin Franklin Franklin Franklin Franklin Franklin Franklin Franklin Franklin Franklin Franklin Franklin Franklin Franklin Franklin Franklin Franklin Franklin Franklin Franklin Franklin Franklin Franklin Franklin Franklin Franklin Franklin Franklin Franklin Franklin Franklin Franklin Franklin Franklin Franklin Franklin Franklin Franklin Franklin Franklin Franklin Franklin Franklin Franklin Franklin Franklin Franklin Franklin Murfreesboro Murfreesboro Murfreesboro Murfreesboro Murfreesboro Murfreesboro Murfreesboro Murfreesboro Murfreesboro Murfreesboro Murfreesboro Murfreesboro Murfreesboro Murfreesboro Murfreesboro Murfreesboro Murfreesboro Murfreesboro Murfreesboro Murfreesboro Murfreesboro Murfreesboro Murfreesboro Murfreesboro Murfreesboro Murfreesboro Murfreesboro Murfreesboro Murfreesboro Murfreesboro Murfreesboro Murfreesboro Murfreesboro Murfreesboro Murfreesboro Murfreesboro Murfreesboro Murfreesboro Murfreesboro Murfreesboro Murfreesboro Murfreesboro Murfreesboro Murfreesboro Murfreesboro Murfreesboro Murfreesboro Murfreesboro Murfreesboro Knoxville Knoxville Knoxville Knoxville Knoxville Knoxville Knoxville Knoxville Knoxville Knoxville Knoxville Knoxville Knoxville Knoxville Knoxville Knoxville Knoxville Knoxville Knoxville Knoxville Knoxville Knoxville Knoxville Knoxville Knoxville Knoxville Knoxville Knoxville Knoxville Knoxville Knoxville Knoxville Knoxville Knoxville Knoxville Knoxville Knoxville Knoxville Knoxville Knoxville Knoxville Knoxville Knoxville Knoxville Knoxville Knoxville Knoxville Knoxville Knoxville Memphis Memphis Memphis Memphis Memphis Memphis Memphis Memphis Memphis Memphis Memphis Memphis Memphis Memphis Memphis Memphis Memphis Memphis Memphis Memphis Memphis Memphis Memphis Memphis Memphis Memphis Memphis Memphis Memphis Memphis Memphis Memphis Memphis Memphis Memphis Memphis Memphis Memphis Memphis Memphis Memphis Memphis Memphis Memphis Memphis Memphis Memphis Memphis Memphis Highly Attractive Markets 4
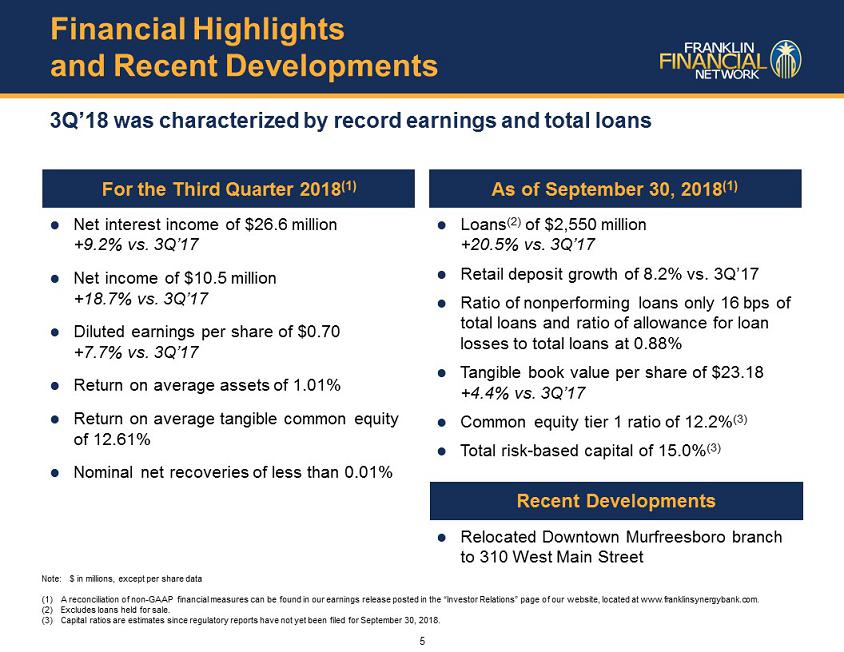
Financial Highlights and Recent Developments For the Third Quarter 2018 (1) As of September 30, 2018 (1) Net interest income of $26 . 6 million +9.2% vs. 3Q’17 Net income of $10.5 million +18.7% vs. 3Q’17 Diluted earnings per share of $0.70 +7.7% vs. 3Q’17 Return on average assets of 1.01% Return on average tangible common equity of 12.61% Nominal net recoveries of less than 0.01% Loans (2) of $2,550 million +20.5% vs. 3Q’17 Retail deposit growth of 8.2% vs. 3Q’17 Ratio of nonperforming loans only 16 bps of total loans and ratio of allowance for loan losses to total loans at 0.88% Tangible book value per share of $23.18 +4.4% vs. 3Q’17 Common equity tier 1 ratio of 12.2% (3) Total risk - based capital of 15.0% (3) Recent Developments Relocated Downtown Murfreesboro branch to 310 West Main Street Note: $ in millions, except per share data (1) A reconciliation of non - GAAP financial measures can be found in our earnings release posted in the “Investor Relations” page of our website, located at www.franklinsynergybank.com. (2) Excludes loans held for sale. (3) Capital ratios are estimates since regulatory reports have not yet been filed for September 30, 2018. 3Q’18 was characterized by record earnings, net interest income and total loans 5

Solid Credit and Low Risk Balance Sheet (1) Source: SNL Financial (2) Current quarter items listed in the “Capacity” and “Risk Weight” sections for 3Q’18 are estimates based on current Low risk, liquid balance sheet Growth Profitability Soundness (1) 6 (1) (2)

ALLL as % of Nonperforming Assets 7 193 203 171 188 189 173 181 183 1,069 359 324 328 403 412 439 488 386 - 200 400 600 800 1,000 1,200 2016Q3 2016Q4 2017Q1 2017Q2 2017Q3 2017Q4 2018Q1 2018Q2 2018Q3 $3B - $10B Banks Franklin Synergy Bank

Well Diversified Loan Portfolio Loan Growth ($ mm) Diversified Portfolio Real Estate 80% Franchise defined by strong loan growth while maintaining diversification and credit discipline Growth Profitability Soundness $296 $432 $806 $1,318 $1,797 $2,269 $2,565 2012 2013 2014 2015 2016 2017 3Q'18 8
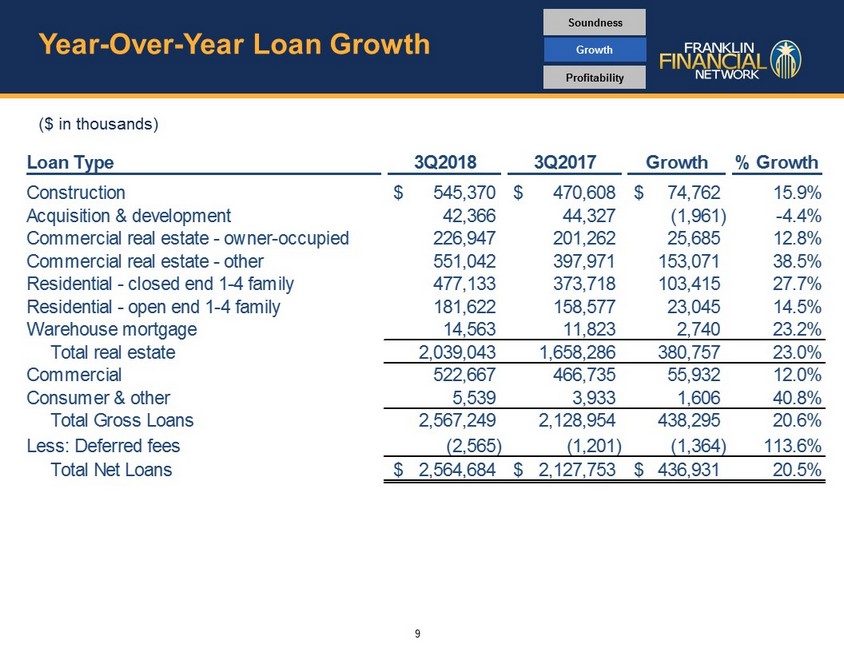
Year - Over - Year Loan Growth Loan Type 3Q2018 3Q2017 Growth % Growth Construction 545,370$ 470,608$ 74,762$ 15.9% Acquisition & development 42,366 44,327 (1,961) -4.4% Commercial real estate - owner-occupied 226,947 201,262 25,685 12.8% Commercial real estate - other 551,042 397,971 153,071 38.5% Residential - closed end 1-4 family 477,133 373,718 103,415 27.7% Residential - open end 1-4 family 181,622 158,577 23,045 14.5% Warehouse mortgage 14,563 11,823 2,740 23.2% Total real estate 2,039,043 1,658,286 380,757 23.0% Commercial 522,667 466,735 55,932 12.0% Consumer & other 5,539 3,933 1,606 40.8% Total Gross Loans 2,567,249 2,128,954 438,295 20.6% Less: Deferred fees (2,565) (1,201) (1,364) 113.6% Total Net Loans 2,564,684$ 2,127,753$ 436,931$ 20.5% ($ in thousands) Growth Profitability Soundness 9

Strategic Deposit Sources Source: Senate Bill 2155, 2018 Davis Polk & Wardwell report Legislative Relief – Reciprocal Deposits Deposit Growth ($ mm) Continued focus on retail deposits while opportunistically banking local governments Growth Profitability Soundness The Bipartisan Banking Act exempts certain reciprocal deposits from the definition of brokered deposits This is a positive change for the Franklin Financial franchise, allowing local government customers to receive FDIC insurance on balances above the $250K threshold Removes the need for Franklin Financial to pledge securities to local government customers in return for larger balance deposits Rotating our earning assets from securities into loans has the potential to improve profitability and asset sensitivity Approximately $300 million of potential balance sheet rotation has been identified The earning asset rotation into loans will take time and will not result in any changes to our credit standards At September 30, 2018, the Company has $117.4 million in reciprocal deposits. 10

Building Earnings Momentum and Tangible Book Value Diluted Earnings Per Share Tangible Book Value Per Share Note: 2017 metrics adjusted for DTA write - down that was recorded in December 2017 related to the change in income tax regula tions that resulted from the Tax Cuts and Jobs Act that was passed in late December 2017 Record earnings continue to support the growth and future profitability of the franchise while building tangible book value per share Growth Profitability Soundness $1.02 $1.10 $1.27 $1.54 $2.42 $2.04 $0.65 $0.70 2012 2013 2014 2015 2016 2017 3Q'17 3Q'18 $11.37 $11.29 $12.88 $15.85 $19.91 $22.24 $23.18 2012 2013 2014 2015 2016 2017 3Q'18 11

Continued Performance Net Income Net Interest Income Note: 2017 metrics adjusted for DTA write - down that was recorded in December 2017 related to the change in income tax regula tions that resulted from the Tax Cuts and Jobs Act that was passed in late December 2017 NIM: 3.17% 3.41% 3.74% 3.62% 3.42% 3.06% 2.70% Return on Average Tangible Common Equity Non - Interest Expenses Strong, sustainable earnings and return metrics driven by loan growth and disciplined credit and expenses Growth Profitability Soundness 12 $3.7 $4.5 $8.3 $16.0 $28.0 $28.1 $8.9 $10.2 $10.5 0.80% 0.72% 0.80% 0.92% 1.10% 0.82% 1.03% 0.98% 1.01% 2012 2013 2014 2015 2016 2017 3Q'17 2Q'18 3Q'18 Net Income ROAA $16.0 $21.0 $37.7 $59.4 $81.6 $97.0 $24.3 $26.9 $26.6 2012 2013 2014 2015 2016 2017 3Q'17 2Q'18 3Q'18 2.74% 3.05% $16.9 $19.7 $31.8 $42.1 $51.7 $60.8 $15.3 $18.1 $18.3 69% 71% 67% 58% 53% 54% 55% 58% 61% 2012 2013 2014 2015 2016 2017 3Q'17 2Q'18 3Q'18 Non-Int. Expenses Efficiency Ratio 10.5% 10.1% 10.1% 10.8% 14.4% 10.1% 12.3% 12.7% 12.6% 2012 2013 2014 2015 2016 2017 3Q'17 2Q'18 3Q'18

l l l l l l l l l l l l l l l l l l l l l l l l l l l l l l l l l l l l l l l l l l l l l l l l l l l l l l l l l l l l l l l l l l l l l l l l l l l l l l l l l l l l l l l l l ll l l l l l l l l l l l l l l l l l l l l l l l l l l l l l l l l l l l l l l l l l l l l F:\Word Processing\MapInfo\MapInfo Jobs\Van Meter, Cliff\04-11-18\Combined_v02.WOR Significant Recent Developments – Building Scale in Key Markets Recent Developments Civic Bank & Trust Acquisition Closed on April 1, 2018 Expands presence in Nashville market and strengthens overall Middle Tennessee footprint First full service branch office in Nashville Further builds retail deposit funding Financially attractive acquisition and immediately accretive to tangible book value per share Relocation of Downtown Murfreesboro Branch Relocated to new location at 310 West Main Street to continue to serve the downtown business district. Located in Rutherford County, Tennessee’s 5 th largest county and one of the youngest, fastest growing counties in Tennessee Source: SNL Financial, 2017 American Community Survey, United States Census Bureau FSB (13) Civic (1) Nashville Branch Footprint F:\Word Processing\MapInfo\MapInfo Jobs\Van Meter, Cliff\04-11-18\Combined_v02.WOR Davidson Williamson Rutherford Maury Nashville 65 24 40 40 840 Davidson Nashville 40 40 F:\Word Processing\MapInfo\MapInfo Jobs\Van Meter, Cliff\04-11-18\Combined_v02.WOR Rutherford 24 840 Murfreesboro Murfreesboro 13

Market Share in Leading Markets 0.3% 0.5% 0.7% 0.8% 1.2% 1.3% 1.7% 3.1% 4.3% 4.8% 5.5% 1.6% 3.3% 4.3% 5.4% 8.9% 9.7% 12.0% 18.9% 25.8% 25.3% 28.2% 6.2% 6.8% 12.2% 13.4% 2008 2009 2010 2011 2012 2013 2014 2015 2016 2017 2018 #1 #2 #6 Williamson County Rutherford County Nashville MSA Leading market share in attractive geographies provides support for our business with ample room for growth 14 Source: FDIC Summary of Deposit Market Share reports.

Growth Real Estate Lending Asset Quality Proven, Successful Banking Model Key Elements of FSB Performance