Attached files
| file | filename |
|---|---|
| EX-99.2 - EXHIBIT 99.2 - UNITED COMMUNITY BANKS INC | tv505260_ex99-2.pdf |
| EX-99.1 - EXHIBIT 99.1 - UNITED COMMUNITY BANKS INC | tv505260_ex99-1.pdf |
| EX-99.1 - EXHIBIT 99.1 - UNITED COMMUNITY BANKS INC | tv505260_ex99-1.htm |
| 8-K - 8-K - UNITED COMMUNITY BANKS INC | tv505260_8k.htm |
Exhibit 99.2

2018 INVESTOR PRESENTATION THIRD QUARTER 2018 October 23, 2018

ucbi.com | 2 Disclosures CAUTIONARY STATEMENT This investor presentation may contain forward - looking statements, as defined by federal securities laws, including statements about United and its financial outlook and business environment . These statements are based on current expectations and are provided to assist in the understanding of our operations and future financial performance . Our operations and such performance involves risks and uncertainties that may cause actual results to differ materially from those expressed or implied in any such statements . For a discussion of some of the risks and other factors that may cause such forward - looking statements to differ materially from actual results, please refer to United Community Banks, Inc . ’s filings with the Securities and Exchange Commission, including its 2017 Annual Report on Form 10 - K under the section entitled “Forward - Looking Statements . ” Forward - looking statements speak only as of the date they are made, and we undertake no obligation to update or revise forward - looking statements . NON - GAAP MEASURES This presentation includes financial information determined by methods other than in accordance with generally accepted accounting principles (“GAAP”) . This financial information includes certain operating performance measures, which exclude merger - related and other charges that are not considered part of recurring operations . Such measures include : “Net income – operating,” “Net income available to common shareholders – operating,” “Earnings per share – operating,” “Diluted earnings per share – operating,” “Tangible book value per share,” “Return on common equity – operating,” “Return on tangible common equity – operating,” “Return on assets – operating,” “Efficiency ratio – operating,” “Expenses – operating,” “Tangible common equity to risk - weighted assets,” and “Average tangible equity to average assets . ” Management has included these non - GAAP measures because we believe they may provide useful supplemental information for evaluating our underlying performance trends . Further, management uses these measures in managing and evaluating our business and intends to refer to them in discussions about our operations and performance . Operating performance measures should be viewed in addition to, and not as an alternative to or substitute for, measures determined in accordance with GAAP, and are not necessarily comparable to non - GAAP measures that may be presented by other companies . To the extent applicable, reconciliations of these non - GAAP measures to the most directly comparable GAAP measures can be found in the ‘Non - GAAP Reconciliation Tables’ included in the exhibits to this presentation . ucbi.com | 2
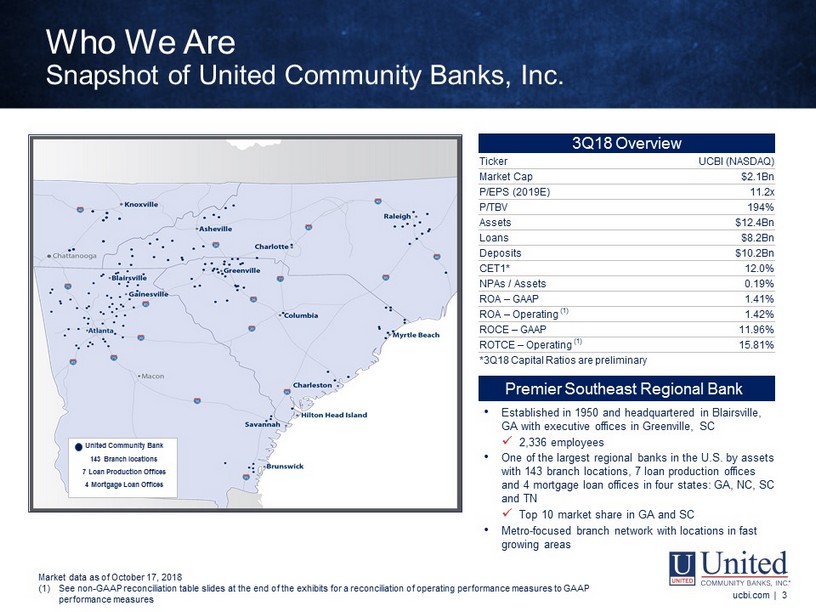
• Established in 1950 and headquartered in Blairsville, GA with executive offices in Greenville, SC x 2,336 employees • One of the largest regional banks in the U.S. by assets with 143 branch locations, 7 loan production offices and 4 mortgage loan offices in four states: GA, NC, SC and TN x Top 10 market share in GA and SC • Metro - focused branch network with locations in fast growing areas Premier Southeast Regional Bank United Community Bank 143 Branch locations 7 Loan Production Offices 4 Mortgage Loan Offices Who We Are Snapshot of United Community Banks, Inc. Market data as of October 17, 2018 (1) See non - GAAP reconciliation table slides at the end of the exhibits for a reconciliation of operating performance measures to GA AP performance measures ucbi.com | 3 3Q18 Overview Ticker UCBI (NASDAQ) Market Cap $ 2.1Bn P/EPS (2019E) 11.2x P/TBV 194% Assets $12.4Bn Loans $8.2Bn Deposits $ 10.2Bn CET1* 12.0% NPAs / Assets 0.19% ROA – GAAP 1.41% ROA – Operating (1) 1.42% ROCE – GAAP 11.96% ROTCE – Operating (1) 15.81% *3Q18 Capital Ratios are preliminary

3 Q18 Highlights ucbi.com | 4 $16.50 $17.29 $17.56 $14.11 $13.25 $13.54 3Q17 2Q18 3Q18 Book Value Per Share (2) Book Value (GAAP) Tangible Book Value (non-GAAP) (1) $0.38 $0.49 $0.54 $0.41 $0.53 $0.55 3Q17 2Q18 3Q18 Earnings Per Share GAAP Operating (1) 1.01% 1.30% 1.41% 1.09% 1.39% 1.42% 3Q17 2Q18 3Q18 Return on Assets GAAP Operating (1) (1) See non - GAAP reconciliation table slides at the end of the exhibits for a reconciliation of operating performance measures to G AAP performance measures ucbi.com | 4 (1) See non - GAAP reconciliation table slides at the end of the exhibits for a reconciliation of operating performance measures to GA AP performance measures (2) Excludes effect of acquisition - related intangibles and associated amortization » Operating diluted earnings per share of $ 0.55 compared with GAAP diluted earnings per share of $ 0.54 » GAAP EPS up 42% vs. last year » Operating EPS rose 34% over the same time frame » GAAP ROA of 1.41% in 3Q » Operating ROA moved to 1.42% exceeding our stated goal of 1.40%, up 3 bps from 2Q18 » Quarterly dividend of $0.15 up 50% vs. last year » Annualized loan growth of 2.1% for the quarter, excluding indirect auto runoff of $41 mm » Total deposits up $263 mm in 3Q18 or 10.6% annualized $0.10 $0.15 $0.15 3Q17 2Q18 3Q18 Dividends Per Share

$89.8 $108.5 $112.1 3Q17 2Q18 3Q18 3.54% 3.90% 3.95% ucbi.com | 5 (1) Net interest margin is calculated on a fully taxable equivalent basis (2) E xcludes brokered deposits Net Interest Revenue / Margin (1) ucbi.com | 5 (1) Net interest margin is calculated on a fully - taxable equivalent basis $ in millions Net Interest Revenue Net Interest Margin » Net interest revenue of $ 112.1 mm increased $3.6 mm (3.4%) vs. 2Q18 and $ 22.3 mm ( 24.9%) vs. 3Q17 » Benefit of Navitas acquisition and an increase in average balances, in addition to rising short - term interest rates » Net interest margin up 5 bps vs. 2Q18 impacted by » Accretable yield contributed $ 2.2 mm or 7.5 bps to 3Q18 NIM vs. 2.4 bps in 2Q18 » Higher loan yield of 16 bps due to higher short - term interest rates and improving portfolio mix from Navitas growth » Net interest margin up 41 bps vs. 3Q17 due to higher short - term rates, stable core deposit base and the impact of acquisitions
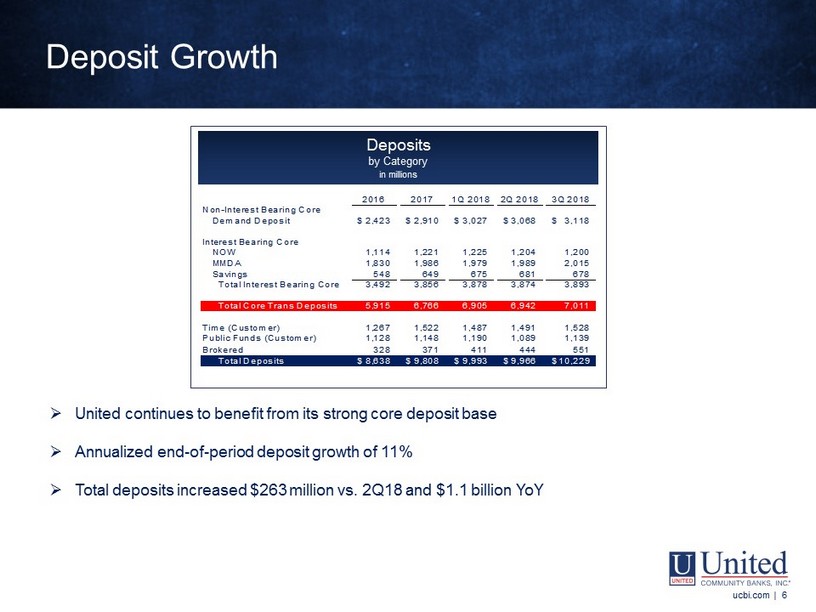
2016 2017 1Q 2018 2Q 2018 3Q 2018 Non-Interest Bearing Core Demand Deposit 2,423$ 2,910$ 3,027$ 3,068$ 3,118$ Interest Bearing Core Total CommercialNOW 1,114 1,221 1,225 1,204 1,200 MMDA 1,830 1,986 1,979 1,989 2,015 Savings 548 649 675 681 678 Total Interest Bearing Core 3,492 3,856 3,878 3,874 3,893 Total Core Trans Deposits 5,915 6,766 6,905 6,942 7,011 Time (Customer) 1,267 1,522 1,487 1,491 1,528 Public Funds (Customer) 1,128 1,148 1,190 1,089 1,139 Brokered 328 371 411 444 551 Total LoansTotal Deposits 8,638$ 9,808$ 9,993$ 9,966$ 10,229$ ucbi.com | 6 NOTE - Certain prior period amounts in the loans by category table have been reclassified to conform to the current presentation Deposit Growth Deposits by Category in millions ucbi.com | 6 » United continues to benefit from its strong core deposit base » Annualized end - of - period deposit growth of 11% » Total deposits increased $263 million vs. 2Q18 and $1.1 billion YoY

0 10 20 30 40 50 60 42 bps 26 bps 82% 94% Low - Cost Deposit Base Sufficient Liquidity to Support Future Growth Loans / Deposits (1) (2) Cost of Total Deposits (bps) (1) (2) 52 bps 33 bps Deposits KRX Peer KRX Peer Note – Peer comparison banks comprise the KBW Regional Bank Index (ticker:KRX) (1) Source: S&P Global Market Intelligence (2) United results as of 3Q18 ; KRX results as of 2Q18 (Source: S&P Global Market Intelligence) ucbi.com | 7

ucbi.com | 8 $2.9 $2.9 $2.9 $1.4 $1.8 $1.8 $0.6 $0.7 $0.8 $1.8 $1.9 $1.9 $0.5 $0.4 $0.3 $ 0.5 $0.5 $7.2 $8.2 $8.2 3Q17 2Q18 3Q18 C&I (1) CRE Comml Construction Residential Other Consumer Equipment Finance 25.2% 8.1% 19.6% 39.9% 21.7% 34.9% 9.3% 23.5% 4.4% 22.2% 34.9% 8.9% 23.4% 4.9% 6.2% 5.7% Loans ucbi.com | 8 $ in billions 7.2% » Annualized end - of - period loan growth was 0.3%, or 2.1% excluding indirect auto runoff of $41 mm » Diversified portfolio, weighted towards C&I » Well within regulatory guidance on construction and CRE levels » The 100%/300% ratios stand at 74% and 197%, respectively (1) C&I includes commercial and industrial loans as well as owner - occupied CRE loans

ucbi.com | 9 Loan Growth Drivers ucbi.com | 9 » Continued expansion in our metro markets, including our new Myrtle Beach and Raleigh markets » Ongoing evaluation and addition of new Commercial Banking products and verticals » Successful execution of the Navitas growth strategy » Continued development of our unique partnership model where the community banks partner with Commercial Banking Solutions to drive growth » Growth in the mortgage business via expansion into newly acquired markets and with the addition of on - balance sheet adjustable rate products
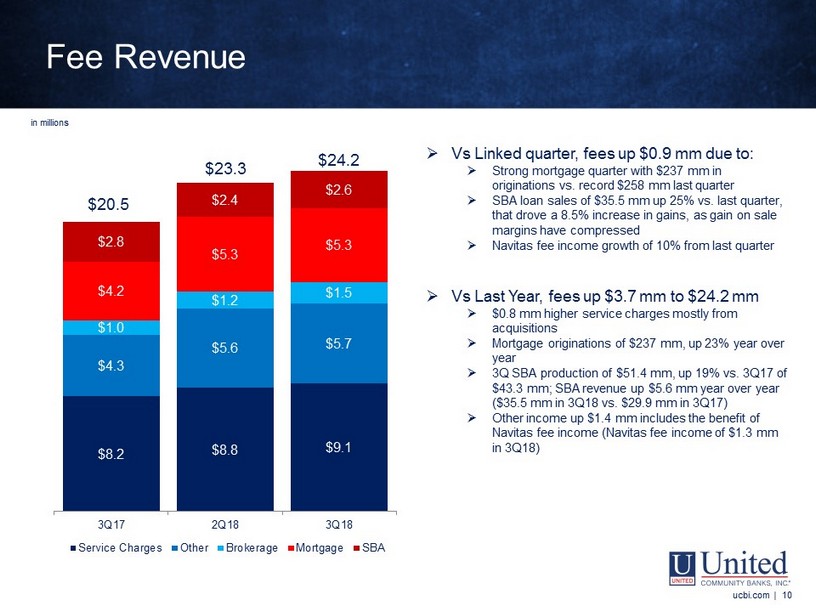
$8.2 $8.8 $9.1 $4.3 $5.6 $5.7 $1.0 $1.2 $1.5 $4.2 $5.3 $5.3 $2.8 $2.4 $2.6 3Q17 2Q18 3Q18 Service Charges Other Brokerage Mortgage SBA ucbi.com | 10 Fee Revenue ucbi.com | 10 in millions » Vs Linked quarter, fees up $0.9 mm due to: » Strong mortgage quarter with $237 mm in originations vs. record $258 mm last quarter » SBA loan sales of $35.5 mm up 25% vs. last quarter, that drove a 8.5% increase in gains, as gain on sale margins have compressed » Navitas fee income growth of 10% from last quarter » Vs Last Year, fees up $3.7 mm to $24.2 mm » $0.8 mm higher service charges mostly from acquisitions » Mortgage originations of $237 mm, up 23% year over year » 3 Q SBA production of $ 51.4 mm, up 19% vs. 3Q17 of $43.3 mm; SBA revenue up $5.6 mm year over year ($35.5 mm in 3Q18 vs. $29.9 mm in 3Q17 ) » Other income up $ 1.4 mm includes the benefit of Navitas fee income ( Navitas fee income of $1.3 mm in 3Q18) $20.5 $ 23.3 $ 24.2

59.3% 57.9% 56.8% 56.2% 55.8% 56.4% $65.7 $76.9 $77.7 $62.3 $74.0 $77.1 3Q17 2Q18 3Q18 ucbi.com | 11 (1) Net interest margin is calculated on a fully taxable equivalent basis (2) E xcludes brokered deposits Expense Discipline ucbi.com | 11 GAAP Operating (1) (1) See non - GAAP reconciliation table slides at the end of the exhibits for a reconciliation of operating performance measures to G AAP performance measures » Linked quarter, GAAP and operating expenses grew 1% and 4%, respectively » Operating efficiency ratio relatively stable at 56.4% » Operating expenses up $ 3.1 mm vs. 2Q18 » The majority of the increase driven by higher salaries and incentives compared to the prior quarter » Market expansions and acquisitions drove year - over - year GAAP and operating expenses higher by 18% and 24%, respectively » Operating efficiency ratio increased slightly to 56.4% from 56.2% last year Efficiency Ratio (1) $ in millions

Credit Quality ucbi.com | 12 (1) See non - GAAP reconciliation table slides at the end of the exhibits for a reconciliation of operating performance measures to G AAP performance measures ucbi.com | 12 0.09% 0.07% 0.07% 3Q17 2Q18 3Q18 Net Charge - Offs as % of Average Loans 0.23% 0.20% 0.19% 3Q17 2Q18 3Q18 Non - Performing Assets as % of Total Assets $1.0 $1.8 $1.8 3Q17 2Q18 3Q18 Provision for Credit Losses $ in millions 0.81% 0.74% 0.74% 3Q17 2Q18 3Q18 Allowance for Loan Losses

ucbi.com | 13 Holding Company 3Q17 2Q18 3 Q18 Common Equity Tier I Capital 12.2% 11.6% 12.0% Tier I Risk - Based Capital 12.3 12.0 12.3 Total Risk - Based Capital 13.0 13.8 14.2 Leverage 9.3 9.3 9.5 Tangible Common Equity to Risk - Weighted Assets 12.8 11.4 11.6 Average Tangible Equity to Average Assets 9.5 8.8 9.0 ► Profitability continues to provide significant capital ratio improvement each quarter ► All regulatory capital ratios significantly above “well - capitalized” ► Quarterly dividend of $0.15 per share (up 50% YoY ) ucbi.com | 13 Capital Ratios Note: 3Q18 ratios are preliminary

ucbi.com | 14 Key Strengths ucbi.com | 14 » Culture and business model that attracts both bankers and potential acquisition partners » Positioned well in many of the South's fastest - growing markets » Superior customer service helps drive great core deposit growth » Well - developed credit model to drive consistent performance through cycles » Liquid balance sheet and strong capital offer flexibility in a rising rate environment

2018 INVESTOR PRESENTATION Exhibits THIRD QUARTER 2018 October 23, 2018

Cultural Pillars Customer Service Is at Our Foundation High - Quality Balance Sheet » Underwriting conservatism and portfolio diversification » Top quartile credit quality performance » Prudent capital, liquidity and interest - rate risk management » Focused on improving return to shareholders with increasing ROTCE and dividend growth Profitability » Managing a steady margin with minimal accretion income » Fee revenue expansion through focused growth initiatives » Continued operating expense discipline while investing in growth opportunities » Executing on M&A cost savings » High - quality, low - cost core deposit base Growth » Addition of Commercial Banking Solutions platforms (middle - market banking, SBA lending, senior care, income - property lending, asset - based lending, builder finance, renewable energy, equipment finance) and actively pursuing additional lending platforms » Entered into and continue to target new markets with team lift - outs (Charleston, Greenville, Atlanta, Raleigh) » Continuous emphasis on and enhancement of Mortgage product offerings to drive loan and revenue growth » Acquisitions that fit our footprint and culture and deliver desired financial returns Who We Are Full - Service Regional Bank with a Strong Culture Rooted in Sound Credit Underwriting & Growth ucbi.com | 16

17 Who We Are The Bank That Service Built ucbi.com | 17

Fastest Growing Southeast MSAs (1) 2019 - 2024 Proj . Population Growth 2019 Population 2024 Proj . Median Household Income 1. Myrtle Beach, SC 9.66% 485,770 $55,203 2. Cape Coral, FL 8.46% 757,170 $62,988 3. Orlando, FL 8.13% 2,589,416 $65,275 4. Charleston, SC 8.11% 799,117 $70,920 5. Raleigh, NC 8.02% 1,366,959 $85,734 6. Naples, FL 7.86% 381,728 $73,715 7. Lakeland, FL 7.55% 705,037 $54,996 8. North Port, FL 7.53% 825,378 $66,059 9. Charlotte, NC 7.29% 2,591,118 $73,487 10. Jacksonville, FL 6.92% 1,549,094 $67,247 17. Atlanta, GA 6.52% 6,017,552 $77,092 19. Greenville, SC 6.18% 912,621 $62,654 20. Savannah, GA 6.15% 395,004 $68,589 23. Spartanburg, SC 5.93% 340,535 $55,507 10.8% 8.8% UCBI US ’19 – ’24 Proj . Household Income Growth 5.2% 3.6% UCBI US ’19 – ’24 Proj . Population Growth Strong Demographic Profile (2) $57,412 $63,174 UCBI US Median Household Income Notes 1. Includes MSAs with a population of greater than 300,000 2. Weighted by State deposits UCBI MSA Presence ucbi.com | 18 Who We Are Focused on High - Growth MSAs in Southeast

ucbi.com | 19 3Q18 2Q18 3Q17 2Q18 3Q17 Commercial & Industrial 280.1$ 227.4$ 136.1$ 52.7$ 144.0$ Owner-Occupied CRE 77.8 74.7 72.2 3.1 5.6 Income-Producing CRE 77.1 112.3 80.0 (35.2) (2.9) Commercial Constr. 146.1 186.8 139.1 (40.7) 7.0 Total Commercial 581.1 601.2 427.4 (20.1) 153.7 Residential Mortgage 42.9 63.9 54.7 (21.0) (11.8) Residential HELOC 65.4 66.6 68.1 (1.2) (2.7) Residential Construction 70.6 63.4 53.5 7.2 17.1 Consumer 18.2 17.7 13.1 0.5 5.1 Total 778.2$ 812.8$ 616.8$ (34.6)$ 161.4$ Variance-Incr(Decr) NOTE - Certain prior period amounts have been reclassified to conform to the current presentation (1) Represents new loans funded and net loan advances (net of payments on lines of credit) New Loans Funded and Advances $616.8 $812.8 $778.2 3Q17 2Q18 3Q18 New Loans Funded and Advances by Region New Loans Funded and Advances by Category 3Q18 2Q18 3Q17 2Q18 3Q17 Atlanta 120.0$ 142.3$ 151.5$ (22.3)$ (31.5) Coastal Georgia 34.7 43.3 41.1 (8.6) (6.4) North Georgia 68.3 65.2 63.8 3.1 4.5 North Carolina 93.4 113.2 34.8 (19.8) 58.6 Tennessee 24.7 32.7 24.1 (8.0) 0.6 Gainesville 18.7 15.4 9.7 3.3 9.0 South Carolina 126.2 145.1 109.2 (18.9) 17.0 Total Community Banks 486.0 557.2 434.2 (71.2) 51.8 Asset-based Lending 9.9 1.0 8.4 8.9 1.5 Commercial RE 12.0 38.2 42.8 (26.2) (30.8) Senior Care 26.8 32.9 14.8 (6.1) 12.0 Middle Market 18.3 9.4 35.9 8.9 (17.6) SBA 75.2 36.2 43.4 39.0 31.8 Renewable Energy 6.7 0.4 - 6.3 6.7 Navitas 107.8 100.2 - 7.6 107.8 Builder Finance 35.5 37.3 37.3 (1.8) (1.8) 292.2 255.6 182.6 36.6 109.6 Indirect Auto - - - - - Total 778.2$ 812.8$ 616.8$ (34.6)$ 161.4$ Variance-Incr(Decr) Total Commercial Banking Solutions New Loans Funded and Advances (1) ucbi.com | 19 (1) Represents new loans funded and net loan advances (net of payments on lines of credit) $ in millions

Commercial RE Diversification – 9/30/2018 ucbi.com | 20 Assisted Living/Nursing Home/Rehab Cntr 296$ 22.4 % 125$ 16.4 % Residential Construction in Process: SPEC 139 10.5 89 11.7 Residential Land Development - Lots Already Developed in Hands of Builders 62 4.7 58 7.6 Retail Building 75 5.7 53 7.0 Office Buildings 99 7.5 51 6.8 Vacant (Improved) 54 4.0 46 6.1 Residential Construction in Process: PRESOLD 72 5.4 44 5.8 Multi-Residential Properties 144 10.9 43 5.7 Hotels Motels 74 5.6 38 4.9 Warehouse 45 3.4 32 4.2 Other Properties 48 3.7 31 4.1 Raw Land - Vacant (Unimproved) 35 2.6 30 4.0 Self Storage 46 3.5 29 3.8 Residential Land Development - Subdivisions in Process 34 2.5 25 3.2 Residential Raw Land in the Hands of Builders/Developers 17 1.3 16 2.0 Restaurants /Franchise Fast Food / Franchise Other 24 1.8 13 1.8 Commercial Land Development 10 0.8 9 1.1 Churches 9 0.7 8 1.0 Automotive Service 7 0.5 5 0.7 Daycare Facility 9 0.7 5 0.7 All Other 23 1.8 11 1.4 Total Commercial Construction 1,322$ 100 % 761$ 100 % OutstandingCommitted Commercial Real Estate – Income Producing in millions Commercial Construction in millions Office Buildings 440$ 23.1 % 398$ 22.2 % Retail Building 354 18.6 337 18.8 Assisted Living/Nursing Home/Rehab Cntr 198 10.4 179 10.0 Investor Residential 194 10.2 190 10.6 Hotels Motels 180 9.5 177 9.9 Warehouse 165 8.7 160 8.9 Multi-Residential Properties 133 7.0 124 7.0 Other Properties 66 3.5 59 3.3 Restaurants /Franchise Fast Food / Franchise Other 53 2.8 51 2.8 Self Storage 31 1.6 29 1.6 Mfg Facility 24 1.3 24 1.3 Convenience Stores 22 1.2 21 1.2 Leasehold Property 17 0.9 17 1.0 Mobile Home Parks 8 0.4 8 0.5 Automotive Service 8 0.4 8 0.5 Daycare Facility 3 0.2 3 0.2 All Other 3 0.2 3 0.2 Total Commercial Real Estate - Income Producing 1,899$ 100 % 1,788$ 100 % Committed Outstanding Outstanding Average Loan Size (in thousands ) • Commercial Construction $ 349 • Commercial RE: • Composite CRE 420 • Owner - Occupied 361 • Income - Producing 496 Committed Average Loan Size (in thousands ) • Commercial Construction $600 • Commercial RE: • Composite CRE 448 • Owner - Occupied 387 • Income - Producing 526 ucbi.com | 20

BUILT TO OUTPERFORM IN THE NEXT CYCLE 1. Process Change • In 2014, centralized and streamlined consumer underwriting and related functions • Significantly strengthened commercial process for approvals and monitoring 2. Add Significant Talent • CEO with deep knowledge and experience in credit • 2015 Rob Edwards brought in to lead team (BB&T, TD Bank) • Senior credit risk team now has large bank credit risk experience 3. Concentration Management: Size • In house project lending limit of $18 mm, legal lending limit of $ 324 mm • Relationship limit of $30 mm • $109 mm of SNC’s outstanding, $193 mm committed • Top 25 loans = $603 mm, 7.3 % of total loans 4. Concentration Management: Geography • Four state franchise with mix of metro and rural markets 5. Concentration Management: Product • Construction/CRE ratio = 74%/197% • C&D > 30% in cycle, now 12.6 % driven by Four Oaks • Land in C&D $ 249 mm and shrinking, due to Four Oaks conversion • Navitas 6.20 % of loans • Granular product concentration limits Strong Credit Culture ucbi.com | 21

Accretable Yield Analysis Profitability Comparison (2Q18 Annualized) ucbi.com | 22 1.18% 1.20% 1.29% 1.30% 1.37% 1.38% 1.38% 1.43% 1.44% 1.52% 1.64% 1.64% 2.08% 0.00% 1.00% 2.00% Peer 12 Peer 11 Peer 10 Peer 9 Peer 8 Peer 7 UCBI Peer 6 Peer 5 Peer 4 Peer 2 Peer 3 Peer 1 Core ROAA 1.05% 1.10% 1.17% 1.20% 1.23% 1.26% 1.28% 1.28% 1.29% 1.30% 1.36% 1.50% 1.86% 0.00% 1.00% 2.00% Peer 11 Peer 12 Peer 7 Peer 2 Peer 9 Peer 6 Peer 8 Peer 5 Peer 10 Peer 4 UCBI Peer 3 Peer 1 Adj. Core ROAA (1) 0.22% 0.15% 0.02% 0.22% 0.01% 0.09% 0.16% 0.17% 0.07% 0.44% 0.20% 0.08% 0.15% 1.54% 1.73% 1.81% 1.85% 1.90% 1.98% 1.98% 2.03% 2.10% 2.38% 2.82% 2.86% 2.95% 0.00% 1.00% 2.00% 3.00% Peer 12 Peer 10 Peer 9 Peer 11 Peer 3 UCBI Peer 6 Peer 7 Peer 4 Peer 5 Peer 2 Peer 1 Peer 8 Core PTPP / Avg Assets 1.45% 1.67% 1.71% 1.72% 1.72% 1.76% 1.78% 1.82% 1.96% 2.17% 2.26% 2.57% 2.84% 0.00% 1.00% 2.00% 3.00% Peer 12 Peer 11 Peer 9 Peer 10 Peer 3 Peer 6 Peer 7 Peer 4 UCBI Peer 5 Peer 2 Peer 1 Peer 8 Adj. Core PTPP / Avg Assets (1) 0.11% 0.29% 0.09% 0.18% 0.56% 0.21% 0.02% 0.27% 0.25% 0.22% 0.01% 0.18% 0.10% Median: 1.38% Median: 1.28% Median: 1.98% Median: 1.78% Source: Bank of America Merrill Lynch, S&P Global Market Intelligence (1) Excludes impact of accretable yield, assuming MRQ is annualized. Adj. Core ROAA assumes MRQ tax rate. % of Avg Assets Attributable to Accretable Yield

3Q17 4Q17 1Q18 2Q18 3Q18 (1) (1) (1) (1) (1) Net Income Net income - GAAP 27,946$ (11,916)$ 37,658$ 39,634$ 43,682$ Merger-related and other charges 3,420 7,358 2,646 2,873 592 Tax benefit on merger-related and other charges (1,147) (1,165) (628) (121) (141) Impairment of deferred tax asset due to federal tax rate reduction - 38,199 - - - Net income - Operating 30,219$ 32,476$ 39,676$ 42,386$ 44,133$ Diluted Earnings per share Diluted earnings per share - GAAP 0.38$ (0.16)$ 0.47$ 0.49$ 0.54$ Merger-related and other charges 0.03 0.08 0.03 0.04 0.01 Impairment of deferred tax asset due to federal tax rate reduction - 0.50 - - - Diluted earnings per share - Operating 0.41$ 0.42$ 0.50$ 0.53$ 0.55$ Return on Assets Return on assets - GAAP 1.01 % (0.40) % 1.26 % 1.30 % 1.41 % Merger-related and other charges 0.08 0.20 0.07 0.09 0.01 Impairment of deferred tax asset due to federal tax rate reduction - 1.30 - - - Return on assets - Operating 1.09 % 1.10 % 1.33 % 1.39 % 1.42 % Book Value per share Book Value per share - GAAP 16.50$ 16.67$ 17.02$ 17.29$ 17.56$ Effect of goodwill and other intangibles (2.39) (3.02) (4.06) (4.04) (4.02) Tangible book value per share 14.11$ 13.65$ 12.96$ 13.25$ 13.54$ ucbi.com | 23 Non - GAAP Reconciliation Tables ucbi.com | 23 $ in thousands, except per share data (1) Merger - related and other charges for 3Q18, 2Q18, 1Q18, 4Q17 and 3Q17 include $478, $593 thousand, $592 thousand, $517 thousand and $244 thousand, respectively, of intangible amortization resulting from payments made to executives under their change of cont rol agreements. The resulting intangible assets are being amortized over 12 to 24 months.

3Q17 4Q17 1Q18 2Q18 3Q18 (1) (1) (1) (1) (1) Return on Tangible Common Equity Return on common equity - GAAP 9.22 % (3.57) % 11.11 % 11.20 % 11.96 % Effect of merger-related and other charges 0.75 1.86 0.60 0.77 0.13 Impairment of deferred tax asset due to federal tax rate reduction - 11.44 - - - Return on common equity - Operating 9.97 9.73 11.71 11.97 12.09 Effect of goodwill and intangibles 1.96 2.20 3.55 3.82 3.72 Return on tangible common equity - Operating 11.93 % 11.93 % 15.26 % 15.79 % 15.81 % Expenses Expenses - GAAP 65,674$ 75,882$ 73,475$ 76,850$ 77,718$ Merger-related and other charges (3,420) (7,358) (2,646) (2,873) (592) Expenses - Operating 62,254$ 68,524$ 70,829$ 73,977$ 77,126$ Tangible common equity to risk-weighted assets reconciliation (*) Tier 1 capital ratio (Regulatory) 12.27$ 12.24$ 11.61$ 11.94$ 12.34$ Effect of other comprehensive income (0.13) (0.29) (0.50) (0.57) (0.68) Effect of deferred tax limitation 0.94 0.51 0.42 0.33 0.30 Effect of trust preferred (0.24) (0.36) (0.34) (0.34) (0.34) Basel III intangibles transition adjustment (0.04) (0.05) - - - Tangible common equity to risk-weighted assets 12.80 % 12.05 % 11.19 11.36 % 11.62 % Efficiency Ratio Efficiency Ratio - GAAP 59.27 % 63.03 % 57.83 % 57.94 % 56.82 % Merger-related and other charges (3.09) (6.11) (2.08) (2.17) (0.43) Efficiency Ratio - Operating 56.18 % 56.92 % 55.75 % 55.77 % 56.39 % (*) Third quarter 2018 ratios are preliminary. ucbi.com | 24 Non - GAAP Reconciliation Tables ucbi.com | 24 $ in thousands, except per share data (1) Merger - related and other charges for 3Q18, 2Q18 , 1Q18, 4Q17 and 3Q17 include $478, $593 thousand, $592 thousand, $517 thousand and $244 thousand, respectively, of intangible amortization resulting from payments made to executives under their change of cont rol agreements. The resulting intangible assets are being amortized over 12 to 24 months.