Attached files
| file | filename |
|---|---|
| EX-99.1 - EXHIBIT 99.1 - STATE STREET CORP | exhibit991-3q18earningspre.htm |
| 8-K - 8-K - STATE STREET CORP | form8-k3q18.htm |
| EX-99.2 - EXHIBIT 99.2 - STATE STREET CORP | exhibit992-3q18earningsrel.htm |

Third Quarter 2018 Financial Highlights October 19, 2018 (NYSE: STT)

Preface and Forward-looking Statements This presentation includes certain highlights of, and also material supplemental to, State Street Corporation’s news release announcing its third quarter 2018 financial results. That news release contains a more detailed discussion of many of the matters described in this presentation and is accompanied by detailed financial tables. This presentation is designed to be reviewed together with that news release, which is available on State Street’s website, at http://investors.statestreet.com, and is incorporated herein by reference. This presentation (and the conference call accompanying it) contains forward-looking statements as defined by United States securities laws. These statements are not guarantees of future performance, are inherently uncertain, are based on assumptions that are difficult to predict and have a number of risks and uncertainties. The forward-looking statements in this presentation speak only as of the time this presentation is first furnished to the SEC on a Current Report on Form 8-K, and State Street does not undertake efforts to revise forward-looking statements. See “Forward-looking statements” in the Appendix for more information, including a description of certain factors that could affect future results and outcomes. Certain financial information in this presentation is presented on both a GAAP and an adjusted (adjusted-GAAP) basis. Adjusted-GAAP basis presentations are non-GAAP presentations. Refer to the Appendix for explanations of our non-GAAP financial measures and to the Addendum for reconciliations of our non-GAAP financial information. 2

3Q18 Highlights All comparisons are to prior year periods unless noted otherwise • Growth in 3Q18 AUCA and AUM resulting from market appreciation and new business wins Growing • 3Q18 new servicing business wins of ~$300B, with ~$465B of new business yet to be Our Core installed, and new business pipeline remains strong1 Franchise • Best Fund Administrator (STT) and Order Management System (CRD)2 • Best ETF Service Provider in the Americas, Asia-Pacific and Europe3 • Investing in the future while reducing legacy costs Advancing − Continuing to deliver additional product functionality and speed through digitization Our Digital − Beacon 3Q18 net savings of ~$65M; expect FY2018 savings of ~$200M Leadership − Charles River Development (CRD) acquisition positions State Street as a leading provider of investment software, and enables the industry’s first ever front-to-back office servicing solutionA • Revenue growth of 4% reflecting continued strong net interest income in light of a previously announced client transition and challenging industry conditionsB Active Expense • Controlled expense growth of 3% reflecting continued business investments offset by B Management active expense management C and Strong − Flat sequential underlying expenses Returns − Cost discipline generated positive operating leverage of 0.8%pts • Pre-tax margin of 29.4%, up 0.5%pts • EPS growth of 13% and ROE improved 1.0%pt to 14.0% A Offered by a single provider B Effects of the new revenue recognition standard (ASU 2014-09) contributed $70M in 3Q18 to each of Total fee revenue and Total expenses. C Excluding $77M of repositioning costs in 2Q18, expenses were flat on a sequential basis (2Q18 to 3Q18). This presentation of expenses is a non-GAAP presentation. C Please refer to the addendum for a reconciliation of non-GAAP measures. Refer to the Appendix included with this presentation for endnotes 1 to 7. 3
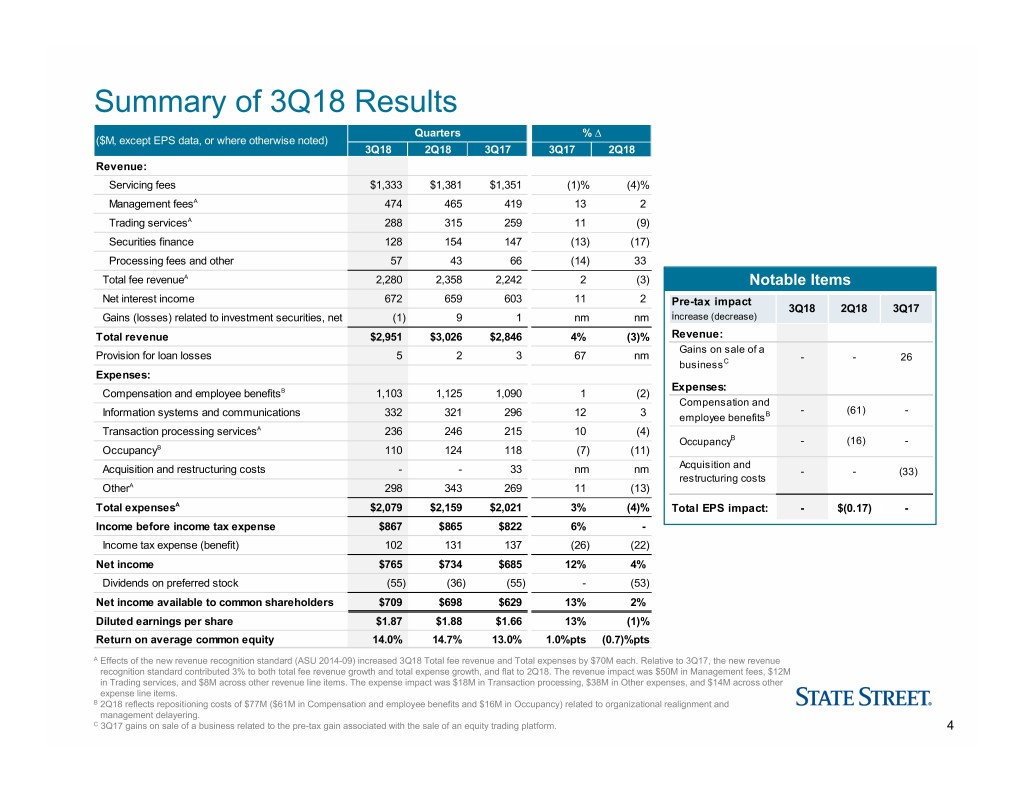
Summary of 3Q18 Results Quarters % ∆ ($M, except EPS data, or where otherwise noted) 3Q18 2Q18 3Q17 3Q17 2Q18 Revenue: Servicing fees $1,333 $1,381 $1,351 (1)% (4)% Management feesA 474 465 419 13 2 Trading servicesA 288 315 259 11 (9) Securities finance 128 154 147 (13) (17) Processing fees and other 57 43 66 (14) 33 Total fee revenueA 2,280 2,358 2,242 2 (3) Notable Items Net interest income 672 659 603 11 2 Pre-tax impact 3Q18 2Q18 3Q17 Gains (losses) related to investment securities, net (1) 9 1 nm nm increase (decrease) Total revenue $2,951 $3,026 $2,846 4% (3)% Revenue: Gains on sale of a Provision for loan losses 5 2 3 67 nm --26 businessC Expenses: Expenses: Compensation and employee benefitsB 1,103 1,125 1,090 1 (2) Compensation and - (61) - Information systems and communications 332 321 296 12 3 employee benefitsB Transaction processing servicesA 236 246 215 10 (4) OccupancyB - (16) - OccupancyB 110 124 118 (7) (11) Acquisition and Acquisition and restructuring costs - - 33 nm nm - - (33) restructuring costs OtherA 298 343 269 11 (13) Total expensesA $2,079 $2,159 $2,021 3% (4)% Total EPS impact: - $(0.17) - Income before income tax expense $867 $865 $822 6% - Income tax expense (benefit) 102 131 137 (26) (22) Net income $765 $734 $685 12% 4% Dividends on preferred stock (55) (36) (55) - (53) Net income available to common shareholders $709 $698 $629 13% 2% Diluted earnings per share $1.87 $1.88 $1.66 13% (1)% Return on average common equity 14.0% 14.7% 13.0% 1.0%pts (0.7)%pts A Effects of the new revenue recognition standard (ASU 2014-09) increased 3Q18 Total fee revenue and Total expenses by $70M each. Relative to 3Q17, the new revenue A recognition standard contributed 3% to both total fee revenue growth and total expense growth, and flat to 2Q18. The revenue impact was $50M in Management fees, $12M A in Trading services, and $8M across other revenue line items. The expense impact was $18M in Transaction processing, $38M in Other expenses, and $14M across other A expense line items. B 2Q18 reflects repositioning costs of $77M ($61M in Compensation and employee benefits and $16M in Occupancy) related to organizational realignment and B management delayering. C 3Q17 gains on sale of a business related to the pre-tax gain associated with the sale of an equity trading platform. 4
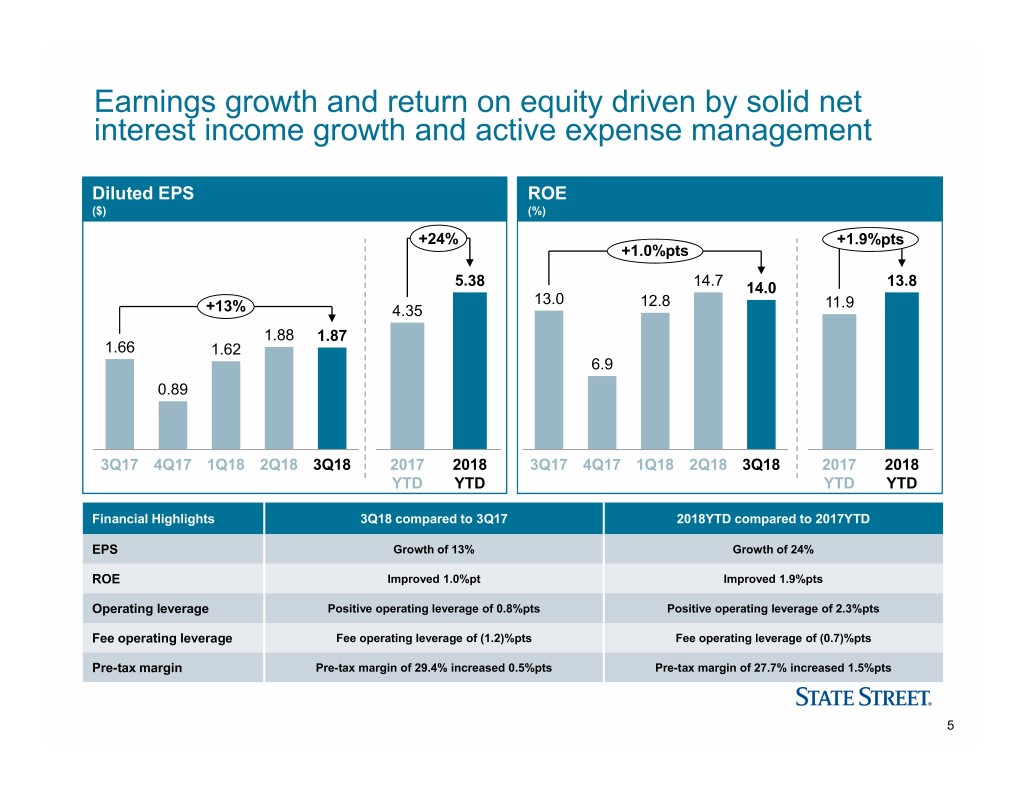
Earnings growth and return on equity driven by solid net interest income growth and active expense management Diluted EPS ROE ($) (%) +24% +1.9%pts +1.0%pts 5.38 14.7 14.0 13.8 13.0 12.8 11.9 +13% 4.35 1.88 1.87 1.66 1.62 6.9 0.89 3Q174Q17 1Q18 2Q18 3Q18 2017 2018 3Q17 4Q17 1Q18 2Q18 3Q18 2017 2018 YTD YTD YTD YTD Financial Highlights 3Q18 compared to 3Q17 2018YTD compared to 2017YTD EPS Growth of 13% Growth of 24% ROE Improved 1.0%pt Improved 1.9%pts Operating leverage Positive operating leverage of 0.8%pts Positive operating leverage of 2.3%pts Fee operating leverage Fee operating leverage of (1.2)%pts Fee operating leverage of (0.7)%pts Pre-tax margin Pre-tax margin of 29.4% increased 0.5%pts Pre-tax margin of 27.7% increased 1.5%pts 5
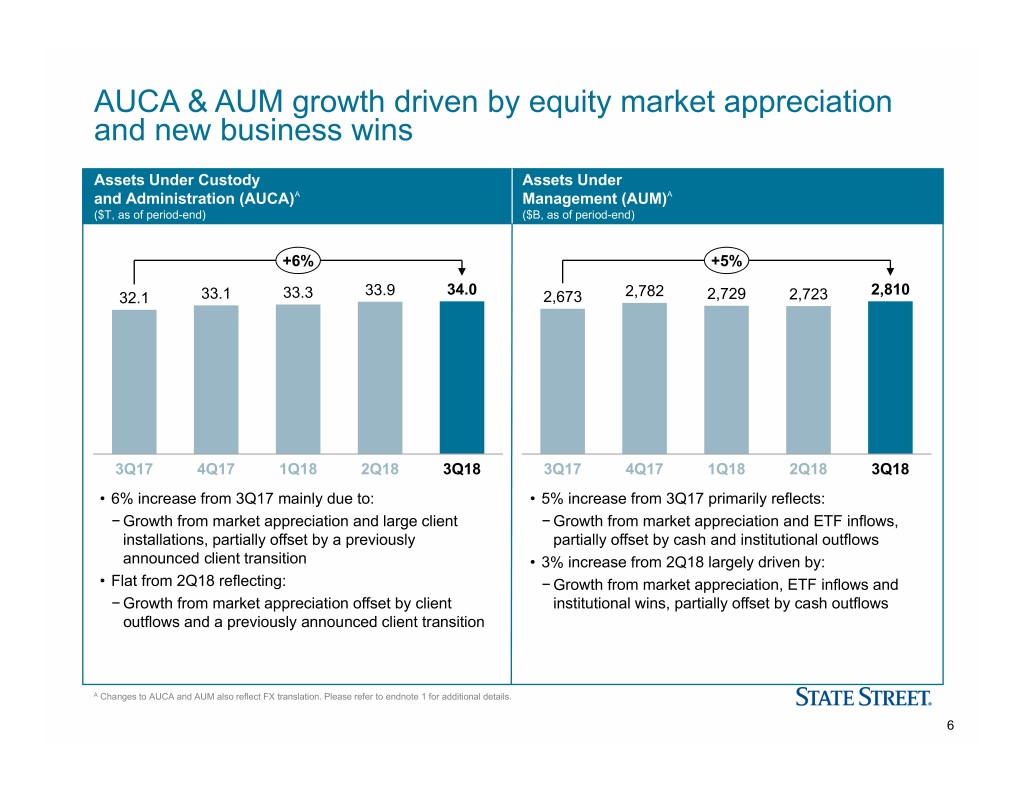
AUCA & AUM growth driven by equity market appreciation and new business wins Assets Under Custody Assets Under and Administration (AUCA)A Management (AUM)A ($T, as of period-end) ($B, as of period-end) +6% +5% 33.9 34.0 2,810 32.1 33.1 33.3 2,673 2,782 2,729 2,723 3Q174Q17 1Q18 2Q18 3Q18 3Q17 4Q17 1Q18 2Q18 3Q18 • 6% increase from 3Q17 mainly due to: • 5% increase from 3Q17 primarily reflects: − Growth from market appreciation and large client − Growth from market appreciation and ETF inflows, installations, partially offset by a previously partially offset by cash and institutional outflows announced client transition • 3% increase from 2Q18 largely driven by: • Flat from 2Q18 reflecting: − Growth from market appreciation, ETF inflows and − Growth from market appreciation offset by client institutional wins, partially offset by cash outflows outflows and a previously announced client transition A Changes to AUCA and AUM also reflect FX translation. Please refer to endnote 1 for additional details. 6

Fee revenue growth supported by equity market appreciation and trading activity Fee Revenue 3Q18 vs 3Q17 ($M) Fee revenue growth primarily driven by higher +2%A management fees, trading services and revenue YoY recognition, partially offset by lower servicing fees 2,378 2,358 2,280 % ∆ 2,242 2,230 • Servicing fees decreased mainly due to a previously announced client transition, and challenging industry conditions, partially offset by stronger new business wins 1,381 (1)% and market appreciation 1,351 1,333 • Management feesA increased primarily driven by higher equity market levels and revenue recognition • Trading servicesA increased largely driven by higher FX 465 474 13% 419 client volumes 11% 259 315 288 (13)% • Securities finance decreased reflecting balance sheet 147 154 128 66 43 57 (14)% optimization efforts 3Q174Q17 1Q18 2Q18 3Q18 • Processing fees and other decreased largely reflecting a 3Q17 pre-tax gain associated with the sale of an equity trading platform, partially offset by higher software fees • Unfavorable currency translation negatively impacted Total fee revenue by $8M in 3Q18 compared to 3Q17 • 3Q18 fee revenue included $70M attributable to the new revenue recognition standard Servicing fees Management fees Trading services Securities finance revenue Processing fees and other A Effects of the new revenue recognition standard (ASU 2014-09) increased 3Q18 Total fee revenue by $70M. The revenue impact was $50M in Management fees, $12M A in Trading services, and $8M across other revenue line items. 7

Continued NII and NIM expansion driven by higher U.S. interest rates and disciplined liability pricing A NII & NIM 3Q18 vs 3Q17 (NII $M, NIM %) NII +11% NIM (FTE) +13bps • NII increased primarily due to higher U.S. interest rates, disciplined liability pricing and increased client B 659 672 603 616 643 engagement across cash products, partially offset by a mix shift to HQLA 1.46 1.48 1.40 1.35 1.38 • NIM increased mainly driven by higher U.S. interest rates, 3Q17 4Q17 1Q18 2Q18 3Q18 disciplined liability pricing, and a smaller interest earning asset base NII B YoY FTE 645 656 664 677 684 +6% Average Interest-Earning Assets & Deposits 3Q18 vs 3Q17 ($B) 3Q17 4Q17 1Q18 2Q18 3Q18 • Interest earning assets reduction primarily related to Total assets 218 216 227 224 221 client deposit volatility Interest-earning 190 188 193 186 183 • Total deposits for 3Q18 were approximately 60% USD, assets 20% EUR, 10% GBP and 10% in other currencies Total deposits 162 161 165 163 160 A NII is presented on a GAAP-basis; NIM is presented on an FTE-basis. Please refer to the Addendum for reconciliations of our FTE-basis presentation. B ~$15M of swap costs in 1Q18 were reclassified from Processing fees and other revenue within fee revenue to Net interest income to conform to current presentation. No B other prior periods were revised. 8
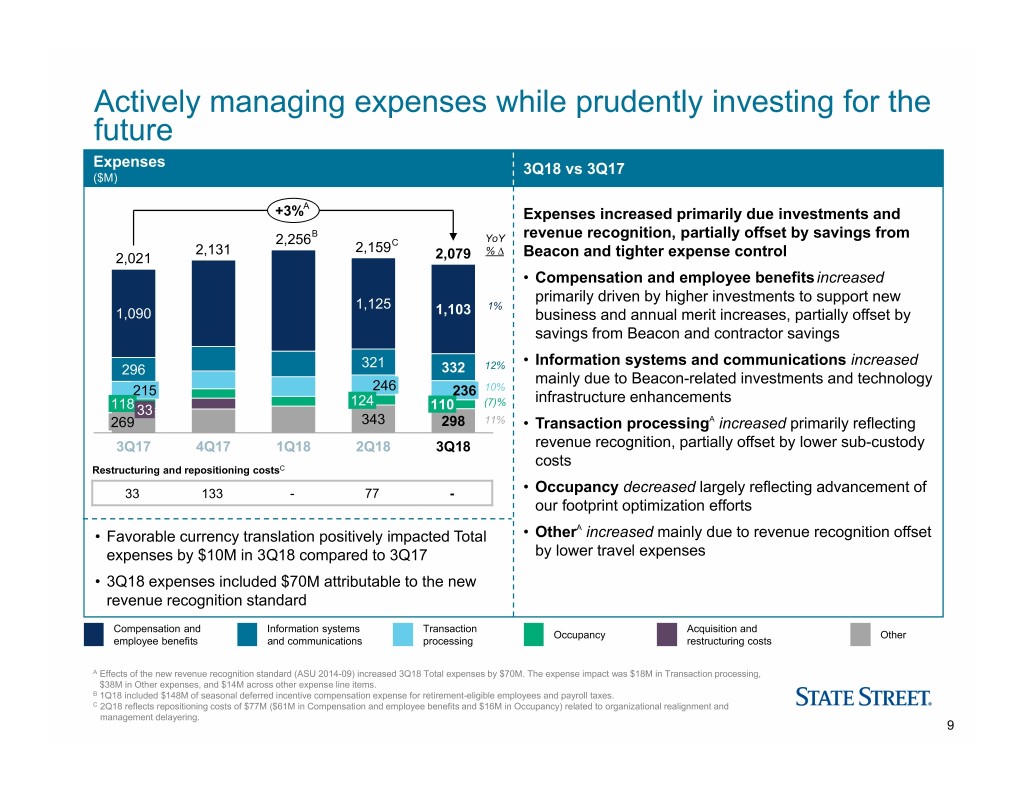
Actively managing expenses while prudently investing for the future Expenses 3Q18 vs 3Q17 ($M) A +3% Expenses increased primarily due investments and B revenue recognition, partially offset by savings from 2,256 C YoY 2,131 2,159 % ∆ 2,021 2,079 Beacon and tighter expense control • Compensation and employee benefits increased primarily driven by higher investments to support new 1,125 1% 1,090 1,103 business and annual merit increases, partially offset by savings from Beacon and contractor savings 321 • Information systems and communications increased 296 332 12% mainly due to Beacon-related investments and technology 215 246 236 10% 124 (7)% infrastructure enhancements 118 33 110 269 343 298 11% • Transaction processingA increased primarily reflecting 3Q17 4Q17 1Q18 2Q18 3Q18 revenue recognition, partially offset by lower sub-custody costs Restructuring and repositioning costsC 33 133 - 77 - • Occupancy decreased largely reflecting advancement of our footprint optimization efforts A • Favorable currency translation positively impacted Total • Other increased mainly due to revenue recognition offset expenses by $10M in 3Q18 compared to 3Q17 by lower travel expenses • 3Q18 expenses included $70M attributable to the new revenue recognition standard Compensation and Information systems Transaction Acquisition and Occupancy Other employee benefits and communications processing restructuring costs A Effects of the new revenue recognition standard (ASU 2014-09) increased 3Q18 Total expenses by $70M. The expense impact was $18M in Transaction processing, A $38M in Other expenses, and $14M across other expense line items. B 1Q18 included $148M of seasonal deferred incentive compensation expense for retirement-eligible employees and payroll taxes. C 2Q18 reflects repositioning costs of $77M ($61M in Compensation and employee benefits and $16M in Occupancy) related to organizational realignment and C management delayering. 9

Continue to invest for the future while reducing legacy costs Beacon Net Savings Beacon Investments and Savings Highlights ($M) 2018 YTD 3Q18 Savings YTD ~% • Achieved 3Q18 Beacon net savings of ~$65M Digitization & 42 116 50% - On track to complete Beacon by early-2019, more than 18 Footprint Optimization months ahead of our initial target IT Transformation 17 48 20% • Expect to achieve FY2018 total net savings of ~$200M, exceeding initial guidance of $150M Corporate & SSGA 24 70 30% Investments • Enhanced client servicing tools and technology for improved YoY ∆ in gross 83 234 100% speed and functionality Beacon savings • Beginning to deploy robotics in 60% of our processing areas to YoY ∆ in Beacon 17 51 reduce manual activity investment • Bringing into production Cognitive and Machine learning to YoY net ~65 ~180 improve straight-through-processing, moving from human Beacon savings verification of signatures and input of trades to machine based Additional Net Savings Building on Our Beacon Success • Additional cost savings initiatives in 3Q18 have also demonstrated our commitment to actively manage expenses including: - Contractor vendor management saves of ~$20M reflected in compensation & benefits Additional - Renegotiation of sub-custodian spend worth ~$10M reflected in transaction processing $40M in total - Further management of discretionary spend, including T&E worth ~$10M reflected in other expenses savings - First wave of management delayering actioned, with savings scaling quickly by year end • While controlling expenses, we continue to invest in key areas, including our front office trading business, data management platforms, and our ETF asset management business 10

Investment Portfolio & Capital Position Highlights Investment Portfolio Highlights Quarter-End Capital Positions ($B, as of quarter-end) (%, Fully phased-in as of period-end) Capital Ratios4,5,6,7 14.0% $97.5B 12.0% 12.1% 12.4% $85.6B $87.1B $87.2B 12.9% 39% 11.6% 11.3% 24% 23% 10.8% 8.1% 30% 7.2% 6.9% 7.1% 7.1% 6.4% 6.0% 6.2% 61% 70% 76% 77% 4Q17 1Q18 2Q18 3Q18 Tier 1 Leverage SLR Standardized CET1 Advanced CET1 4Q17 1Q18 2Q18 3Q18 • Higher 3Q18 capital ratios primarily driven by $1.15B common and $500M preferred stock offerings to finance Non-HQLA HQLA the acquisition of CRD − Capital levels post-CRD closing are expected to return to prior recent historical levels Duration: 3.3 years in 3Q18 − Intend to resume common stock repurchases beginning in 1Q19 of $300M per quarter through 2Q19 Refer to the Appendix included with this presentation for endnotes 1 to 7. 11
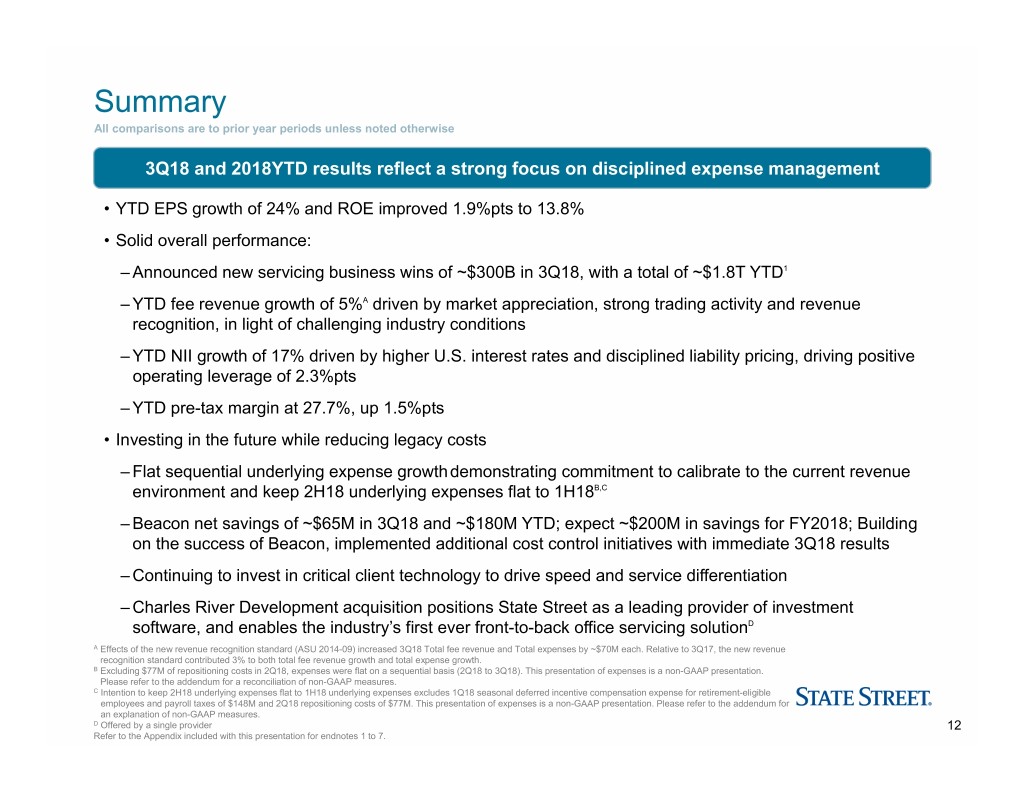
Summary All comparisons are to prior year periods unless noted otherwise 3Q18 and 2018YTD results reflect a strong focus on disciplined expense management • YTD EPS growth of 24% and ROE improved 1.9%pts to 13.8% • Solid overall performance: – Announced new servicing business wins of ~$300B in 3Q18, with a total of ~$1.8T YTD1 – YTD fee revenue growth of 5%A driven by market appreciation, strong trading activity and revenue recognition, in light of challenging industry conditions – YTD NII growth of 17% driven by higher U.S. interest rates and disciplined liability pricing, driving positive operating leverage of 2.3%pts – YTD pre-tax margin at 27.7%, up 1.5%pts • Investing in the future while reducing legacy costs – Flat sequential underlying expense growthdemonstrating commitment to calibrate to the current revenue environment and keep 2H18 underlying expenses flat to 1H18B,C – Beacon net savings of ~$65M in 3Q18 and ~$180M YTD; expect ~$200M in savings for FY2018; Building on the success of Beacon, implemented additional cost control initiatives with immediate 3Q18 results – Continuing to invest in critical client technology to drive speed and service differentiation – Charles River Development acquisition positions State Street as a leading provider of investment software, and enables the industry’s first ever front-to-back office servicing solutionD A Effects of the new revenue recognition standard (ASU 2014-09) increased 3Q18 Total fee revenue and Total expenses by ~$70M each. Relative to 3Q17, the new revenue A recognition standard contributed 3% to both total fee revenue growth and total expense growth. B Excluding $77M of repositioning costs in 2Q18, expenses were flat on a sequential basis (2Q18 to 3Q18). This presentation of expenses is a non-GAAP presentation. B Please refer to the addendum for a reconciliation of non-GAAP measures. C Intention to keep 2H18 underlying expenses flat to 1H18 underlying expenses excludes 1Q18 seasonal deferred incentive compensation expense for retirement-eligible C employees and payroll taxes of $148M and 2Q18 repositioning costs of $77M. This presentation of expenses is a non-GAAP presentation. Please refer to the addendum for C an explanation of non-GAAP measures. D Offered by a single provider 12 Refer to the Appendix included with this presentation for endnotes 1 to 7.

Appendix Summary of 2018YTD Results 14 3Q18 vs 2Q18 Variances for Total Fee 15 – 17 Revenue, NII and Total Expenses Slide Endnotes 18 Forward-looking Statements 19 Non-GAAP Measures 20 Definitions 21 13

Summary of 2018YTD Results Quarters2018 Quarters2017 1Q18 v 2Q18 v 3Q18 v 2018YTD v ($M, except EPS data, or where otherwise noted) 1Q18 2Q18 3Q18YTD 1Q17 2Q17 3Q17 YTD 1Q17 % ∆ 2Q17 % ∆ 3Q17 % ∆ 2017YTD % ∆ Revenue: Servicing fees $1,421 $1,381 $1,333 $4,135 $1,296 $1,339 $1,351 $3,986 10% 3% (1)% 4% Management feesA 472 465 474 1,411 382 397 419 1,198 24 17 13 18 Trading servicesA 304 315 288 907 275 289 259 823 11 9 11 10 Securities finance 141 154 128 423 133 179 147 459 6 (14) (13) (8) Processing fees and otherB 40 43 57 140 112 31 66 209 (64) 39 (14) (33) Total fee revenueA 2,378 2,358 2,280 7,016 2,198 2,235 2,242 6,675 8 6 2 5 Net interest incomeB 643 659 672 1,974 510 575 603 1,688 26 15 11 17 Gains (losses) related to investment securities, net (2) 9 (1) 6 (40) - 1 (39) (95) - nm nm Total revenue $3,019 $3,026 $2,951 $8,996 $2,668 $2,810 $2,846 $8,324 13% 8% 4% 8% Provision for loan losses - 2 5 7 (2) 3 3 4 nm (33) 67 75 Expenses: Compensation and employee benefitsC 1,249 1,125 1,103 3,477 1,166 1,071 1,090 3,327 7 5 1 5 Information systems and communications 315 321 332 968 287 283 296 866 10 13 12 12 Transaction processing servicesA 242 246 236 724 197 207 215 619 23 19 10 17 OccupancyC 120 124 110 354 110 116 118 344 9 7 (7) 3 Acquisition and restructuring costs - - - - 29 71 33 133 nm nm nm nm OtherA 330 343 298 971 297 283 269 849 11 21 11 14 Total expensesA $2,256 $2,159 $2,079 $6,494 $2,086 $2,031 $2,021 $6,138 8% 6% 3% 6% Income before income tax expense $763 $865 $867 $2,495 $584 $776 $822 $2,182 31% 12% 6% 14% Income tax expense (benefit) 102 131 102 335 82 156 137 375 24 (16) (26) (11) Net income $661 $734 $765 $2,160 $502 $620 $685 $1,807 32% 18% 12% 20% Dividends on preferred stock (55) (36) (55) (146) (55) (36) (55) (146) - - - - Net income available to common shareholders $605 $698 $709 $2,012 $446 $584 $629 $1,659 36% 20% 13% 21% Diluted earnings per share $1.62 $1.88 $1.87 $5.38 $1.15 $1.53 $1.66 $4.35 41% 23% 13% 24% Return on average common equity 12.8% 14.7% 14.0% 13.8% 9.9% 12.6% 13.0% 11.9% 2.9%pts 2.1%pts 1.0%pts 1.9%pts A Effects of the new revenue recognition standard (ASU 2014-09) increased 2018YTD Total fee revenue and Total expenses by $205M each. Relative to 2017YTD, the new A revenue recognition standard contributed 3% to both total fee revenue growth and expense growth. The revenue impact was $140M in Management fees, $47M in A Trading services, and $18M across other revenue line items. The expense impact was $48M in Transaction processing, $128M in Other expenses, and $29M across A other expense line items. B ~$15M of swap costs in 1Q18 were reclassified from Processing fees and other revenue within fee revenue to Net interest income to conform to current presentation. No B other prior periods were revised. C 2Q18 repositioning costs of $77M are reflected in Compensation and employee benefits ($61M) and Occupancy ($16M). 14
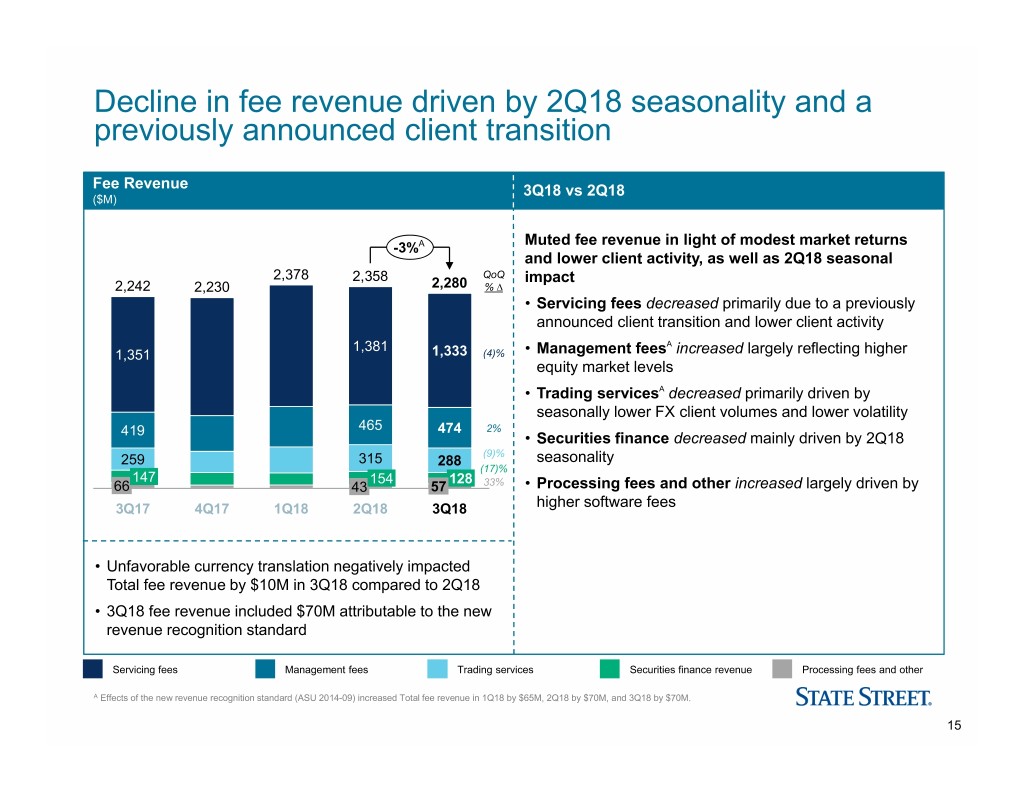
Decline in fee revenue driven by 2Q18 seasonality and a previously announced client transition Fee Revenue 3Q18 vs 2Q18 ($M) Muted fee revenue in light of modest market returns -3%A and lower client activity, as well as 2Q18 seasonal 2,378 2,358 QoQ impact 2,242 2,230 2,280 % ∆ • Servicing fees decreased primarily due to a previously announced client transition and lower client activity 1,381 A 1,351 1,333 (4)% • Management fees increased largely reflecting higher equity market levels • Trading servicesA decreased primarily driven by seasonally lower FX client volumes and lower volatility 465 474 2% 419 • Securities finance decreased mainly driven by 2Q18 (9)% 259 315 288 seasonality (17)% 147 154 128 66 43 57 33% • Processing fees and other increased largely driven by 3Q17 4Q17 1Q18 2Q18 3Q18 higher software fees • Unfavorable currency translation negatively impacted Total fee revenue by $10M in 3Q18 compared to 2Q18 • 3Q18 fee revenue included $70M attributable to the new revenue recognition standard Servicing fees Management fees Trading services Securities finance revenue Processing fees and other A Effects of the new revenue recognition standard (ASU 2014-09) increased Total fee revenue in 1Q18 by $65M, 2Q18 by $70M, and 3Q18 by $70M. 15

Continued NII and NIM growth driven by higher U.S. interest rates and disciplined liability pricing A NII & NIM 3Q18 vs 2Q18 (NII $M, NIM %) NII +2% NIM (FTE) +2bps • NII increased primarily due to higher U.S. interest rates and disciplined liability pricing B 659 672 603 616 643 1.46 1.48 1.40 1.35 1.38 • NIM increased driven by higher U.S. interest rates, disciplined liability pricing, and a smaller interest earning asset base 3Q17 4Q171Q18 2Q18 3Q18 NII B QoQ FTE 645 656 664 677 684 +1% Average Interest-Earning Assets & Deposits 3Q18 vs 2Q18 ($B) 3Q17 4Q17 1Q18 2Q18 3Q18 • Interest earning assets reduction primarily due to Total assets 218 216 227 224 221 deposit volatility Interest-earning 190 188 193 186 183 • Total deposits for 3Q18 were approximately 60% USD, assets 20% EUR, 10% GBP and 10% in other currencies Total deposits 162 161 165 163 160 A NII is presented on a GAAP-basis; NIM is presented on an FTE-basis. Please refer to the Addendum for reconciliations of our FTE-basis presentation. B ~$15M of swap costs in 1Q18 were reclassified from Processing fees and other revenue within fee revenue to Net interest income to conform to current presentation. No B other prior periods were revised. 16

Continued expense discipline calibrated to the current revenue environment Expenses 3Q18 vs 2Q18 ($M) A -4% Active expense management resulted in flat underlying B D 2,256 C QoQ expenses 2,131 2,159 2,021 2,079 % ∆ • Compensation and employee benefits decreased primarily due to the 2Q18 repositioning costs and savings 1,125 from Beacon, partially offset by lower prior period 1,090 1,103 (2)% incentive compensation and continued investments • Information systems and communications increased 321 296 332 3% mainly due to technology infrastructure enhancements 246 215 236 (4)% • Transaction ProcessingA decreased mainly reflecting 118 124 110 (11)% 33 lower sub-custody costs 269 343 298 (13)% 3Q17 4Q17 1Q18 2Q18 3Q18 • Occupancy decreased primarily reflecting the 2Q18 repositioning costs Restructuring and repositioning costsC • OtherA decreased largely reflecting lower professional 33 133 - 77 - fees and travel expenses • Favorable currency translation positively impacted Total expenses by $11M in 3Q18 compared to 2Q18 • 3Q18 expenses included $70M attributable to the new revenue recognition standard Compensation and Information systems Transaction Acquisition and Occupancy Other employee benefits and communications processing restructuring costs A Effects of the new revenue recognition standard (ASU 2014-09) increased Total expenses in 1Q18 by $65M, 2Q18 by $70M, and 3Q18 by $70M. B 1Q18 included $148M of seasonal deferred incentive compensation expense for retirement-eligible employees and payroll taxes. C 2Q18 repositioning costs of $77M are reflected in Compensation and employee benefits ($61M) and Occupancy ($16M) within our financial statements included C in the Addendum. D Sequential expense growth comparison excludes 2Q18 repositioning costs of $77M. 17

Slide Endnotes 1 New asset servicing mandates and servicing assets remaining to be installed in future periods exclude new business which has been contracted except when the client has not yet provided permission to publicly disclose and the new business is not yet installed. These excluded assets, which from time to time may be significant, will be included in new asset servicing mandates and reflected in servicing assets remaining to be installed in the period in which the client provides its permission. Newly announced servicing asset mandates for the first quarter of 2018 include a significant amount of assets contracted in the fourth quarter of 2017 for which we received client consent to disclose in the first quarter of 2018. Servicing mandates and servicing assets remaining to be installed in future periods are presented on a gross basis; therefore, also do not include the impact of clients who have notified us during the period of their intent to terminate or reduce their relationship with State Street, which from time to time be significant. New business in assets to be serviced is reflected in our AUCA after we begin servicing the assets, and new business in assets to be managed is reflected in our AUM after we begin managing the assets. As such, only a portion of any new asset servicing and asset management mandates may be reflected in our AUCA and AUM as of September 30, 2018. Distribution fees from the SPDR® Gold ETF and the SPDR® Long Dollar Gold Trust ETF are recorded in brokerage and other fee revenue and not in management fee revenue. 2 Source: FundIntelligence Mutual Fund Service and Technology Awards 2018; State Street won Best Fund Administrator over $100B and Charles River Development won Best Order Management System. 3 Source: exchangetradedfunds.com Global ETF Awards 2018 4 Unless otherwise noted, all capital ratios referenced on this slide and elsewhere in this presentation refer to State Street Corporation, or State Street, and not State Street Bank and Trust Company, or State Street Bank. The lower of capital ratios calculated under the Basel III advanced approaches and under the Basel III standardized approach are applied in the assessment of our capital adequacy for regulatory purposes. Refer to the addendum included with this presentation for a further description of these ratios and for reconciliations applicable to State Street’s fully phased-in Basel III ratios. September 30, 2018 capital ratios are presented as of quarter-end and are preliminary estimates. 5 The advanced approaches-based ratios (actual and estimated) included in this presentation reflect calculations and determinations with respect to our capital and related matters, based on State Street and external data, quantitative formulae, statistical models, historical correlations and assumptions, collectively referred to as “advanced systems.” Refer to the addendum included with this presentation for a description of the advanced approaches and a discussion of related risks. Effective January 1, 2018, the applicable final rules are in effect and the ratios presented are calculated based on fully phased-in CET1, Tier 1 and total capital numbers. 6 Estimated pro-forma fully phased-in ratios as of September 30, 2017 and December 31, 2017 reflect capital and total risk-weighted assets calculated under the Basel III final rule. Refer to the addendum included with this presentation for reconciliations of these estimated pro-forma fully phased-in ratios to our capital ratios calculated under the then applicable regulatory requirements. Effective January 1, 2018, the applicable final rules are in effect and the ratios presented are calculated based on fully phased-in CET1, Tier 1 and total capital numbers. 7 Estimated pro-forma fully phased-in SLRs as of September 30, 2017 and December 31, 2017 (fully phased-in as of January 1, 2018, as per the phase-in requirements of the SLR final rule) are preliminary estimates as calculated under the SLR final rule. Refer to the Addendum included with this presentation for reconciliations of these estimated pro-forma fully phased-in SLRs to our SLRs under the then applicable regulatory requirements. Effective January 1, 2018, the applicable final rules are in effect and the ratios presented are calculated based on fully phased-in CET1, Tier 1 and total capital numbers. 18

Forward-looking Statements This presentation (and the conference call referenced herein) contains forward-looking statements within the meaning of United States securities laws, including statements about our goals and expectations regarding our business, financial and capital condition, results of operations, strategies, the financial and market outlook, dividend and stock purchase programs, governmental and regulatory initiatives and developments, and the business environment. Forward-looking statements are often, but not always, identified by such forward-looking terminology as “outlook,” “expect,” "priority," “objective,” “intend,” “plan,” “forecast,” “believe,” “anticipate,” “estimate,” “seek,” “may,” “will,” “trend,” “target,” “strategy” and “goal,” or similar statements or variations of such terms. These statements are not guarantees of future performance, are inherently uncertain, are based on current assumptions that are difficult to predict and involve a number of risks and uncertainties. Therefore, actual outcomes and results may differ materially from what is expressed in those statements, and those statements should not be relied upon as representing our expectations or beliefs as of any date subsequent to October 19, 2018. Important factors that may affect future results and outcomes include, but are not limited to: the financial strength of the counterparties with which we or our clients do business and to which we have investment, credit or financial exposures as a result of our acting as agent for our clients, including as asset manager; increases in the volatility of, or declines in the level of, our NII, changes in the composition or valuation of the assets recorded in our consolidated statement of condition (and our ability to measure the fair value of investment securities) and changes in the manner in which we fund those assets; the liquidity of the U.S. and international securities markets, particularly the markets for fixed-income securities and inter-bank credits; the liquidity of the assets on our balance sheet and changes or volatility in the sources of such funding, particularly the deposits of our clients; and demands upon our liquidity, including the liquidity demands and requirements of our clients; the level and volatility of interest rates, the valuation of the U.S. dollar relative to other currencies in which we record revenue or accrue expenses and the performance and volatility of securities, credit, currency and other markets in the U.S. and internationally; and the impact of monetary and fiscal policy in the U.S. and internationally on prevailing rates of interest and currency exchange rates in the markets in which we provide services to our clients; the credit quality, credit-agency ratings and fair values of the securities in our investment securities portfolio, a deterioration or downgrade of which could lead to other-than-temporary impairment of such securities and the recognition of an impairment loss in our consolidated statement of income; our ability to attract deposits and other low-cost, short-term funding; our ability to manage the level and pricing of such deposits and the relative portion of our deposits that are determined to be operational under regulatory guidelines; and our ability to deploy deposits in a profitable manner consistent with our liquidity needs, regulatory requirements and risk profile; the manner and timing with which the Federal Reserve and other U.S. and foreign regulators implement or reevaluate the regulatory framework applicable to our operations (as well as changes to that framework), including implementation or modification of the Dodd-Frank Act and related stress testing and resolution planning requirements, implementation of international standards applicable to financial institutions, such as those proposed by the Basel Committee and European legislation (such as the AIFMD, UCITS, the Money Market Funds Regulation and MiFID II / MiFIR); among other consequences, these regulatory changes impact the levels of regulatory capital and liquidity we must maintain, acceptable levels of credit exposure to third parties, margin requirements applicable to derivatives, restrictions on banking and financial activities and the manner in which we structure and implement our global operations and servicing relationships. In addition, our regulatory posture and related expenses have been and will continue to be affected by changes in regulatory expectations for global systemically important financial institutions applicable to, among other things, risk management, liquidity and capital planning, resolution planning, compliance programs, and changes in governmental enforcement approaches to perceived failures to comply with regulatory or legal obligations; adverse changes in the regulatory ratios that we are, or will be, required to meet, whether arising under the Dodd-Frank Act or implementation of international standards applicable to financial institutions, such as those proposed by the Basel Committee, or due to changes in regulatory positions, practices or regulations in jurisdictions in which we engage in banking activities, including changes in internal or external data, formulae, models, assumptions or other advanced systems used in the calculation of our capital or liquidity ratios that cause changes in those ratios as they are measured from period to period; requirements to obtain the prior approval or non-objection of the Federal Reserve or other U.S. and non-U.S. regulators for the use, allocation or distribution of our capital or other specific capital actions or corporate activities, including, without limitation, acquisitions, investments in subsidiaries, dividends and stock purchases, without which our growth plans, distributions to shareholders, share repurchase programs or other capital or corporate initiatives may be restricted; changes in law or regulation, or the enforcement of law or regulation, that may adversely affect our business activities or those of our clients or our counterparties, and the products or services that we sell, including additional or increased taxes or assessments thereon, capital adequacy requirements, margin requirements and changes that expose us to risks related to the adequacy of our controls or compliance programs; economic or financial market disruptions in the U.S. or internationally, including those which may result from recessions or political instability; for example, the U.K.'s decision to exit from the European Union may continue to disrupt financial markets or economic growth in Europe or potential changes in trade policy and bi-lateral and multi-lateral trade agreements proposed by the U.S.; our ability to create cost efficiencies through changes in our operational processes and to further digitize our processes and interfaces with our clients, any failure of which, in whole or in part, may among other things, reduce our competitive position, diminish the cost-effectiveness of our systems and processes or provide an insufficient return on our associated investment; our ability to promote a strong culture of risk management, operating controls, compliance oversight, ethical behavior and governance that meets our expectations and those of our clients and our regulators, and the financial, regulatory, reputation and other consequences of our failure to meet such expectations; the impact on our compliance and controls enhancement programs associated with the appointment of a monitor under the deferred prosecution agreement with the DOJ and compliance consultant appointed under a settlement with the SEC, including the potential for such monitor and compliance consultant to require changes to our programs or to identify other issues that require substantial expenditures, changes in our operations, or payments to clients or reporting to U.S. authorities; the results of our review of our billing practices, including additional findings or amounts we may be required to reimburse clients, as well as potential consequences of such review, including damage to our client relationships or our reputation and adverse actions by governmental authorities; the results of, and costs associated with, governmental or regulatory inquiries and investigations, litigation and similar claims, disputes, or civil or criminal proceedings; changes or potential changes in the amount of compensation we receive from clients for our services, and the mix of services provided by us that clients choose; the large institutional clients on which we focus are often able to exert considerable market influence and have diverse investment activities, and this, combined with strong competitive market forces, subjects us to significant pressure to reduce the fees we charge, to potentially significant changes in our AUCA or our AUM in the event of the acquisition or loss of a client, in whole or in part, and to potentially significant changes in our fee revenue in the event a client re-balances or changes its investment approach or otherwise re-directs assets to lower- or higher-fee asset classes; the potential for losses arising from our investments in sponsored investment funds; the possibility that our clients will incur substantial losses in investment pools for which we act as agent, the possibility of significant reductions in the liquidity or valuation of assets underlying those pools and the potential that clients will seek to hold us liable for such losses; the possibility that our clients or regulators will assert claims that our fees with respect to such investment products are not appropriate or consistent with our fiduciary responsibilities; our ability to anticipate and manage the level and timing of redemptions and withdrawals from our collateral pools and other collective investment products; the credit agency ratings of our debt and depositary obligations and investor and client perceptions of our financial strength; adverse publicity, whether specific to State Street or regarding other industry participants or industry-wide factors, or other reputational harm; our ability to control operational risks, data security breach risks and outsourcing risks, our ability to protect our intellectual property rights, the possibility of errors in the quantitative models we use to manage our business, and the possibility that our controls will prove insufficient, fail or be circumvented; our ability to expand our use of technology to enhance the efficiency, accuracy and reliability of our operations and our dependencies on information technology and our ability to control related risks, including cyber-crime and other threats to our information technology infrastructure and systems (including those of our third-party service providers) and their effective operation both independently and with external systems, and complexities and costs of protecting the security of such systems and data; changes or potential changes to the competitive environment, including changes due to regulatory and technological changes, the effects of industry consolidation and perceptions of State Street as a suitable service provider or counterparty; our ability to complete acquisitions, joint ventures and divestitures, and our the ability to obtain regulatory approvals, the ability to arrange financing as required and the ability to satisfy closing conditions; the risks that our acquired businesses, including our acquisition of Charles River Development, and joint ventures will not achieve their anticipated financial, operational and product innovation benefits or will not be integrated successfully, or that the integration will take longer than anticipated; that expected synergies will not be achieved or unexpected negative synergies or liabilities will be experienced; that client and deposit retention goals will not be met; that other regulatory or operational challenges will be experienced; and that disruptions from the transaction will harm our relationships with our clients, our employees or regulators; our ability to integrate Charles River Development's front office systems with our middle and back office capabilities to offer an front to back office system that is competitive and meets our clients requirements; our ability to recognize evolving needs of our clients and to develop products that are responsive to such trends and profitable to us; the performance of and demand for the products and services we offer; and the potential for new products and services to impose additional costs on us and expose us to increased operational risk; our ability to grow revenue, manage expenses, attract and retain highly skilled people and raise the capital necessary to achieve our business goals and comply with regulatory requirements and expectations; changes in accounting standards and practices; and the impact of the U.S. tax legislation enacted in 2017, and changes in tax legislation and in the interpretation of existing tax laws by U.S. and non-U.S. tax authorities that affect the amount of taxes due. Other important factors that could cause actual results to differ materially from those indicated by any forward-looking statements are set forth in our 2017 Annual Report on Form 10-K and our subsequent SEC filings. We encourage investors to read these filings, particularly the sections on risk factors, for additional information with respect to any forward-looking statements and prior to making any investment decision. The forward-looking statements contained in this presentation (and the conference call referenced herein) should not be relied on as representing our expectations or beliefs as of any time subsequent to the time this presentation is first furnished to the SEC on a Current Report on Form 8-K, and we do not undertake efforts to revise those forward-looking statements to reflect events after that time. 19
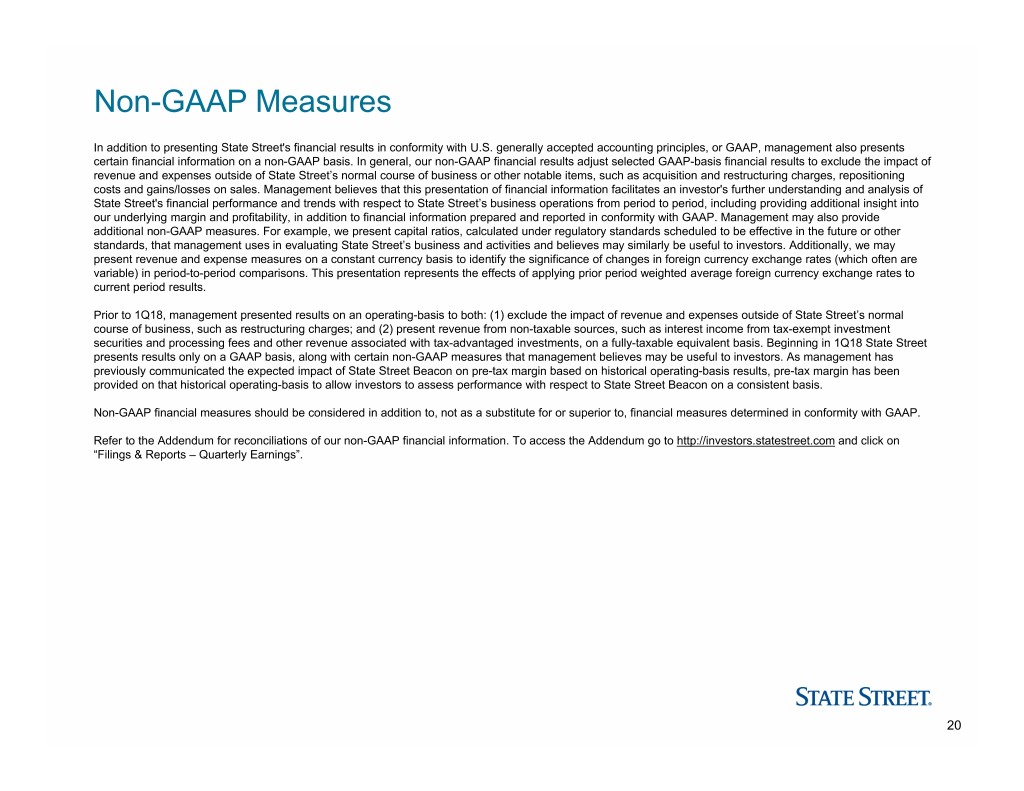
Non-GAAP Measures In addition to presenting State Street's financial results in conformity with U.S. generally accepted accounting principles, or GAAP, management also presents certain financial information on a non-GAAP basis. In general, our non-GAAP financial results adjust selected GAAP-basis financial results to exclude the impact of revenue and expenses outside of State Street’s normal course of business or other notable items, such as acquisition and restructuring charges, repositioning costs and gains/losses on sales. Management believes that this presentation of financial information facilitates an investor's further understanding and analysis of State Street's financial performance and trends with respect to State Street’s business operations from period to period, including providing additional insight into our underlying margin and profitability, in addition to financial information prepared and reported in conformity with GAAP. Management may also provide additional non-GAAP measures. For example, we present capital ratios, calculated under regulatory standards scheduled to be effective in the future or other standards, that management uses in evaluating State Street’s business and activities and believes may similarly be useful to investors. Additionally, we may present revenue and expense measures on a constant currency basis to identify the significance of changes in foreign currency exchange rates (which often are variable) in period-to-period comparisons. This presentation represents the effects of applying prior period weighted average foreign currency exchange rates to current period results. Prior to 1Q18, management presented results on an operating-basis to both: (1) exclude the impact of revenue and expenses outside of State Street’s normal course of business, such as restructuring charges; and (2) present revenue from non-taxable sources, such as interest income from tax-exempt investment securities and processing fees and other revenue associated with tax-advantaged investments, on a fully-taxable equivalent basis. Beginning in 1Q18 State Street presents results only on a GAAP basis, along with certain non-GAAP measures that management believes may be useful to investors. As management has previously communicated the expected impact of State Street Beacon on pre-tax margin based on historical operating-basis results, pre-tax margin has been provided on that historical operating-basis to allow investors to assess performance with respect to State Street Beacon on a consistent basis. Non-GAAP financial measures should be considered in addition to, not as a substitute for or superior to, financial measures determined in conformity with GAAP. Refer to the Addendum for reconciliations of our non-GAAP financial information. To access the Addendum go to http://investors.statestreet.com and click on “Filings & Reports – Quarterly Earnings”. 20
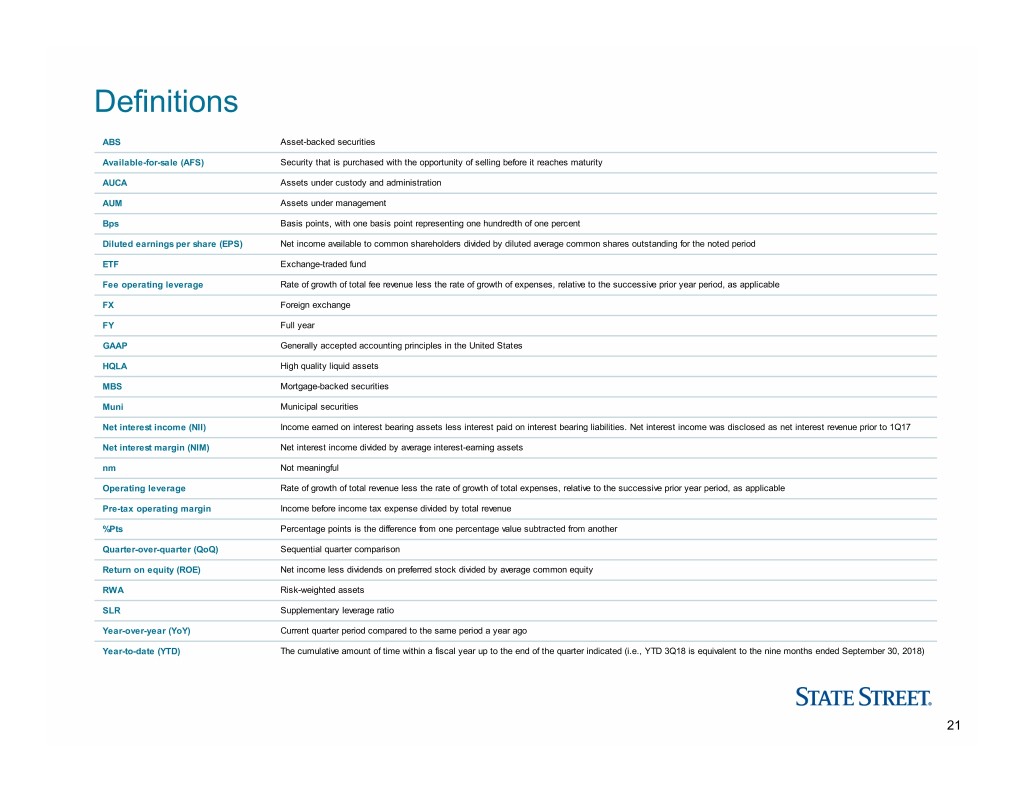
Definitions ABS Asset-backed securities Available-for-sale (AFS) Security that is purchased with the opportunity of selling before it reaches maturity AUCA Assets under custody and administration AUM Assets under management Bps Basis points, with one basis point representing one hundredth of one percent Diluted earnings per share (EPS) Net income available to common shareholders divided by diluted average common shares outstanding for the noted period ETF Exchange-traded fund Fee operating leverage Rate of growth of total fee revenue less the rate of growth of expenses, relative to the successive prior year period, as applicable FX Foreign exchange FY Full year GAAP Generally accepted accounting principles in the United States HQLA High quality liquid assets MBS Mortgage-backed securities Muni Municipal securities Net interest income (NII) Income earned on interest bearing assets less interest paid on interest bearing liabilities. Net interest income was disclosed as net interest revenue prior to 1Q17 Net interest margin (NIM) Net interest income divided by average interest-earning assets nm Not meaningful Operating leverage Rate of growth of total revenue less the rate of growth of total expenses, relative to the successive prior year period, as applicable Pre-tax operating margin Income before income tax expense divided by total revenue %P ts Percentage points is the difference from one percentage value subtracted from another Quarter-over-quarter (QoQ) Sequential quarter comparison Return on equity (ROE) Net income less dividends on preferred stock divided by average common equity RWA Risk-weighted assets SLR Supplementary leverage ratio Year-over-year (YoY) Current quarter period compared to the same period a year ago Year-to-date (YTD) The cumulative amount of time within a fiscal year up to the end of the quarter indicated (i.e., YTD 3Q18 is equivalent to the nine months ended September 30, 2018) 21
