Attached files
| file | filename |
|---|---|
| EX-99.1 - EXHIBIT 99.1 - IBERIABANK CORP | earningsreleaseq32018docum.htm |
| 8-K - 8-K - IBERIABANK CORP | earningsreleaseq32018cover.htm |

Exhibit 99.2 3Q18 Earnings Presentation October 19, 2018

Safe Harbor And Non-GAAP Financial Measures Safe Harbor To the extent that statements in this PowerPoint presentation relate to future plans, objectives, financial results or performance of IBERIABANK Corporation, these statements are deemed to be forward-looking statements within the meaning of the Private Securities Litigation Reform Act of 1995. Such statements, which are based on management’s current information, estimates and assumptions and the current economic environment, are generally identified by the use of the words “plan”, “believe”, “expect”, “intend”, “anticipate”, “estimate”, “project” or similar expressions. The Company’s actual strategies, results and financial condition in future periods may differ materially from those currently expected due to various risks and uncertainties. Forward-looking statements are subject to numerous assumptions, risks and uncertainties that change over time and could cause actual results or financial condition to differ materially from those expressed in or implied by such statements. Consequently, no forward-looking statement can be guaranteed. Except to the extent required by applicable law or regulation, the Company undertakes no obligation to revise or update publicly any forward-looking statement for any reason. This PowerPoint presentation supplements information contained in the Company’s earnings release dated October 19, 2018, and should be read in conjunction therewith. The earnings release may be accessed on the Company’s web site, www.iberiabank.com, under “Investor Relations” and then “Financial Information” and then “Press Releases.” Non-GAAP Financial Measures This PowerPoint presentation contains financial information determined by methods other than in accordance with GAAP. The Company’s management uses core non-GAAP financial metrics (“Core”) in their analysis of the Company’s performance to identify core revenues and expenses in a period that directly drive operating net income in that period. These Core measures typically adjust GAAP performance measures to exclude the effects of the amortization of intangibles and include the tax benefits associated with revenue items that are tax-exempt, as well as adjust income available to common shareholders for certain significant activities or transactions that in management’s opinion can distort period-to-period comparisons of the Company’s performance. Reference is made to “Non-GAAP Financial Measures” and “Caution About Forward Looking Statements” in the earnings release which also apply to certain disclosures in this PowerPoint presentation. 2

Corporate Profile Driving long-term value creation for our clients, associates, communities and shareholders Our Franchise Corporate Snapshot • $4.2 billion market cap as of October 18, 2018 • $75.30 share price • 2.07% dividend yield • $30.1 billion in total assets as of September 30, 2018 • $22.3 billion in loans • $23.2 billion in deposits • Operating continuously for over 131 years • 333 offices serving 33 MSAs across 12 states • Investment grade rated – S&P Rating BBB/A-2 3

Corporate Profile Driving long-term value creation for our clients, associates, communities and shareholders Mission Statement Our Focus • Provide exceptional value-based client • Relationship-driven commercial and services private banking business • Market-centric, people-driven approach in • Great place to work attractive Southeastern markets • Growth that is consistent with high • Building long-term A-list client performance relationships through service and care • “Branch-lite” delivery model with focus on • Shareholder-focused operating efficiency • Strong sense of community • Diversification across asset classes, business lines and geographies 4

Quarterly Summary 3Q18 Non- Non- GAAP GAAP Key Metrics for 3Q18 GAAP GAAP 2Q18 3Q18 Core 2Q18 Core 3Q18 Earnings Per Common Share $1.30 $1.73 $1.71 $1.74 Return On Average Assets 1.01% 1.34% 1.32% 1.35% Return on Average Common Equity 7.87% 10.21% 10.30% 10.27% Return on Tangible Common Equity (TE) -- -- 16.70% 16.34% Tangible Efficiency Ratio (TE) -- -- 54.3% 52.0% Third Quarter Highlights: • 3Q18 earnings improved due to higher net interest income, and continued efforts to reduce non-interest expense; core tangible efficiency ratio of 51.95%, a 235 basis points improvement • Reported NIM of 3.74% and cash margin of 3.47%, both down 2 basis points - the Company realized $1.1 million less in acquired impaired recoveries compared to 2Q18 • Revenue growth and declining expense produced positive operating leverage in the quarter • Core non-interest expense declined by $6.8 million, or 4%, due to lower compensation expense, a reduction in professional fees, lower reserves for mortgage loan repurchases and other cost containment efforts • Continued strong and stable credit metrics • Closed 22 retail branches – expect to realize $2 million savings in operating expense per quarter • Declared cash dividend of $0.39 per common share, a 3% increase compared to the second quarter of 2018 • Repurchased 363,210 common shares at a weighted average price per share of $83.63 during the quarter. There were 709,290 remaining common shares that may be repurchased under the current Board authorized plan 5

Fourth Quarter Items • On October 19, 2018, announced fourth quarter cash dividend of $0.41 per common share, payable on January 25, 2019, a 5% increase to the third quarter dividend and the third increase in the common dividend in 2018 • The Company anticipates recognizing a non-core, permanent net income tax benefit of approximately $55 million associated with the filing of its 2017 income tax returns: • Anticipated benefit is based on the repricing of its current and deferred income tax position associated with the Tax Cuts and Jobs Act of 2017 following the filing of the Company’s remaining state income tax returns and the receipt of written consent from the IRS on a tax accounting method change • The Company expects these items to be finalized in the fourth quarter of 2018 • Once received, management and the Board of Directors will evaluate deployment alternatives for this benefit, which may include dividends, additional share repurchases, and/or balance sheet management strategies 6

Profitability Trends GAAP EPS Core EPS Return on Average Assets Return on Common Equity 7

Profitability – Pro Forma Impact of Tax Rate Changes on 2017 EPS GAAP EPS Core EPS 2017 GAAP EPS 2017 Core EPS As Reported Adjustments As Adjusted As Reported Adjustments As Adjusted 1Q $1.00 $0.12 $1.12 1Q $1.02 $0.12 $1.14 2Q $0.99 $0.19 $1.18 2Q $1.10 $0.21 $1.31 3Q $0.49 $0.13 $0.62 3Q $1.00 $0.24 $1.24 4Q $0.17 $0.19 $0.36 4Q $1.33 $0.23 $1.56 Pro Forma impact on 2017 EPS includes the federal statutory income tax rate change from 35% to 21% and eliminating the deduction for FDIC Insurance 8

Recent Technology Investments The Company continues to invest in technology in order to create a better client experience while continuing to gain long-term operating efficiencies Recently completed investments, include: • A new consumer mobile application • A new loan origination system • Enhanced credit risk analytics platform • Implementation of a new data warehouse • Creation of a mortgage self-fulfillment application • Data center modernization and relocation • Introduction of Robotic Process Automation (RPA) in back office areas 4Q18 / 1Q19 Initiatives include: • Updated internet banking website • New BSA system 9

Client Growth Loan Highlights Deposit Highlights • Total period-end loan growth of $268 million, or 1.2% (4.8% • Period-end total deposits decreased $237 million, or 1.0% annualized) (4.0% annualized rate) • Loan growth during 3Q18 was strongest in the Energy Group • Third quarter deposits were significantly influenced by (reserve-based lending), South Florida Commercial and several large commercial deposit outflows, that were Corporate Asset Finance (equipment financing business) expected groups, and in the Birmingham, Tampa and Dallas markets • Deposit growth was strongest in the Dallas, Baton Rouge, and New York markets Loans – Period-End Balances Deposits – Period-End Balances 10

Net Interest Margin Changes For 3Q18 Net Interest Primary Reason Net Interest Income ($MM) For Change Margin (%) $256.1 2Q18 3.76% (1.5) Changes in Acquired Loan Portfolios 0.03% Continued Upward Repricing of Variable Rate 12.5 0.08% Loans Change in Recovery/Reversal Income on Legacy (0.7) -0.01% Loans Change in Deferred/Unused LOC Fee Income on (0.1) 0.00% Legacy Loans 11.7 Changes in Legacy Loan Portfolios 0.07% 0.5 Improved Securities Portfolio Purchase Yields 0.00% Greater Borrowings Balance at Higher Wholesale (1.8) -0.03% Costs Greater Deposit Yields From Repricing, (7.8) -0.11% Promotional Activity, and Brokered CD Issuance 2.0 Change In Number of Business Days 0.00% 0.1 All Other Factors 0.02% $259.2 3Q18 3.74% • Net interest margin impacted by increased deposit and funding costs 3Q18 • Variable rate loans represent 60% of total portfolio, with over 85% repricing within the next 12 months 11

Interest Rate Betas 1 Trailing YTD 12 Cycle to 3Q18 2018 Months Date 2Q18 Dec-17 Sep-17 Nov-15 3Q18 Sep-18 Sep-18 Sep-18 Total Loans 43% 64% 49% 46% Earning Assets 44% 61% 50% 40% Int. Bearing Deposits 71% 61% 52% 35% Total Deposits2 53% 45% 37% 25% • Total deposit beta rising in 3Q18 to 53% as compared to 40% in 2Q18 • Cycle to Date deposit beta equal to 25% on Total Deposits and 35% on Interest Bearing Deposits 1 Interest rate betas calculated based on the change in yield divided by the absolute change in indices between periods 2 Total deposits includes non-interest bearing deposits which represent 29% of average total deposits 12

Revenues Net Interest Income and Margins Components of Core Non-Interest Income1 • GAAP and core non-interest income both decreased by $1 million, or 2% • Margin decline resulted from increased funding • Derivative income increased $1 million, or 77% costs offset by higher loan yields driven by rising short term rates • Mortgage and title revenue in 3Q18 declined 7% and 8%, respectively, during the quarter (1) Certain prior period amounts have been reclassified to conform to the net presentation requirements of ASU No. 2014-09, Revenue from Contracts with Customers, which was adopted effective January 1, 2018. On average, the adoption resulted in a reduction of non- interest income and non-interest expense of approximately $2.3 million on a quarterly basis, Dollars in millions and had no impact on net income. 13

Non-Interest Expense Components of Core Non-Interest Expense1 Highlights • Total non-interest expense for the quarter decreased $27.5 million, or 14%, to $169.3 million • Core non-interest expenses decreased $6.8 million, or 4%, to $168.6 million, including decreases of: • $1.4 million in salaries and benefits expense • $1.4 million in occupancy and equipment expense • $1.3 million in lower accruals for mortgage loan repurchase reserves • $1.3 million in professional services expense • $0.8 million in marketing and business development expense • $5.4 million of non-core merger-related and branch closure expense in 3Q18, mostly offset by $4.7 million in gains primarily from loss share termination and sales of former bank properties • Gibraltar cost savings and acquisition synergies are approximately 68% versus original expected (1) Certain prior period amounts have been reclassified to conform to the net presentation requirements of savings of 60% ASU No. 2014-09, Revenue from Contracts with Customers, which was adopted effective January 1, 2018. On average, the adoption resulted in a reduction of non-interest income and non-interest expense of approximately $2.3 million on a quarterly basis, and had no impact on net income. 14

Efficiency Efficiency Ratio Trends Highlights • Total core revenues were up $2.3 million, or 1%, compared to 2Q18, while core expenses were down $6.8 million, or 4%, over the same period – significantly improving operating leverage • Core tangible efficiency ratio was 52.0% in 3Q18 • Third quarter expenses show progress from recent expense initiatives • Closed/Consolidated 22 branches in 3Q18, as previously announced 15

Asset Quality Highlights Provision & Net Charge-Offs • Net charge-offs remain at historically low levels • Net charge-offs decreased $2.7 million on a linked quarter basis, to $9 million at 3Q18 • Annualized QTD net charge-offs equate to 0.16% of average loans at 3Q18. Annualized YTD net charge-offs also equate to 0.16% of average loans, compared to 0.33% for 2017 • Provision expense of $11.1 million covered net Allowance for Loan Losses charge-offs by 124% in 3Q18. Linked quarter increase primarily due to legacy loan growth - No additional provision expected for Hurricanes Florence or Michael • The Company is seeing no negative risk migration in the consumer portfolio as a result of rising interest rates 16

Asset Quality Highlights Diversified Loan Portfolio • The Company remains well-positioned with stable asset quality metrics and diversified loan growth • Residential Mortgages are 19% of loan portfolio at 3Q18 compared to 9% at 1Q17, contributing to a more granular loan portfolio • Classified Assets decreased 14% on a linked quarter basis and 20% from prior year. Classified Assets to Total Assets of 1.09% in 3Q18 compared to 1.26% in 2Q18 and 1.47% in 3Q17 Non-Performing Assets • Non-performing assets increased 16% from $163 million at 2Q18 to $188 million at 3Q18. Linked quarter increase included a $10.2 million increase in OREO, primarily from the transfer of closed bank branches to OREO 17

Capital Position Highlights Capital Ratios (Preliminary) • Capital ratios remain strong and stable IBERIABANK Corporation 2Q18 3Q18 Change • Ratios positively impacted by Tangible Common Equity ratio 8.56% 8.69% 13 bps undistributed earnings in the quarter while somewhat offset by common Common Equity Tier 1 (CET 1) ratio 10.72% 10.79% 7 bps stock share repurchases and an increase in risk weighted assets Tier 1 Leverage 9.54% 9.65% 11 bps • Declared quarterly common stock Tier 1 Risk-Based 11.27% 11.33% 6 bps dividend of $0.39 per share, an increase of $0.01 per share, or 3%, Total Risk-Based 12.37% 12.42% 5 bps payable on October 26, 2018 • On October 19, 2018, declared quarterly common stock dividend of $0.41 for shareholders of record on IBERIABANK and Subsidiaries 2Q18 3Q18 Change December 31, 2018, and payable on Common Equity Tier 1 (CET 1) ratio 11.12% 11.27% 15 bps January 25, 2019, representing a 5% increase to the common dividend Tier 1 Leverage 9.42% 9.60% 18 bps • Under the current Board-authorized share repurchase plan there are Tier 1 Risk-Based 11.12% 11.27% 15 bps approximately 0.7 million shares of Total Risk-Based 11.74% 11.89% 15 bps common stock remaining that may be purchased by the Company 18

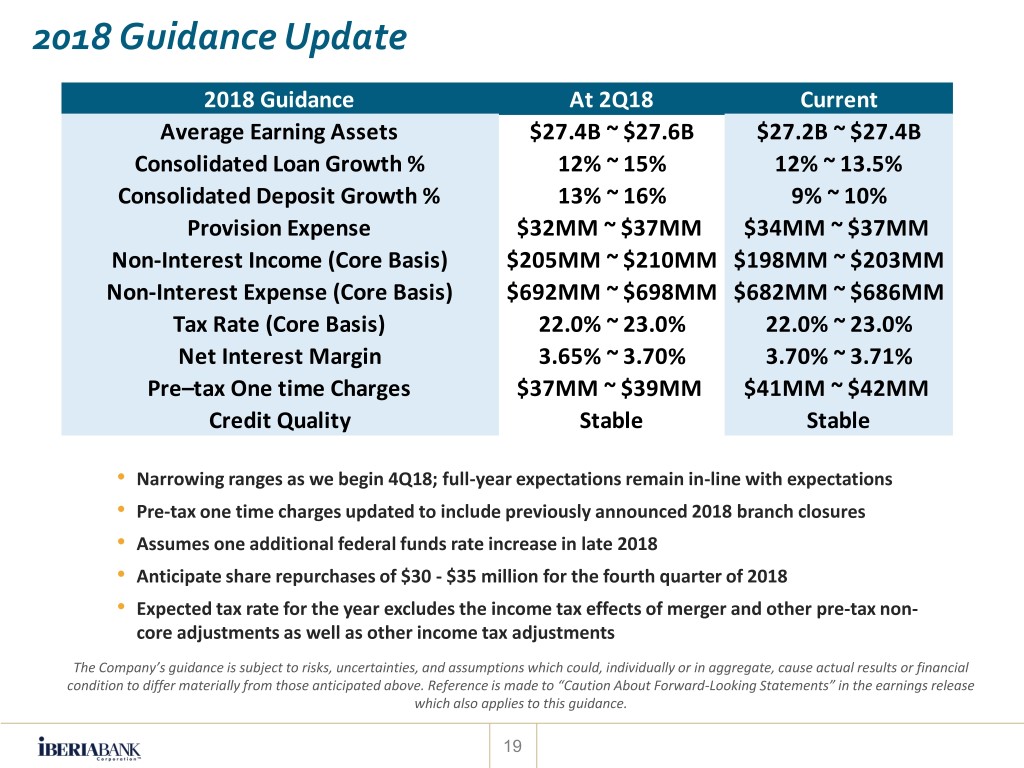
2018 Guidance Update 2018 Guidance At 2Q18 Current Average Earning Assets $27.4B ~ $27.6B $27.2B ~ $27.4B Consolidated Loan Growth % 12% ~ 15% 12% ~ 13.5% Consolidated Deposit Growth % 13% ~ 16% 9% ~ 10% Provision Expense $32MM ~ $37MM $34MM ~ $37MM Non-Interest Income (Core Basis) $205MM ~ $210MM $198MM ~ $203MM Non-Interest Expense (Core Basis) $692MM ~ $698MM $682MM ~ $686MM Tax Rate (Core Basis) 22.0% ~ 23.0% 22.0% ~ 23.0% Net Interest Margin 3.65% ~ 3.70% 3.70% ~ 3.71% Pre–tax One time Charges $37MM ~ $39MM $41MM ~ $42MM Credit Quality Stable Stable • Narrowing ranges as we begin 4Q18; full-year expectations remain in-line with expectations • Pre-tax one time charges updated to include previously announced 2018 branch closures • Assumes one additional federal funds rate increase in late 2018 • Anticipate share repurchases of $30 - $35 million for the fourth quarter of 2018 • Expected tax rate for the year excludes the income tax effects of merger and other pre-tax non- core adjustments as well as other income tax adjustments The Company’s guidance is subject to risks, uncertainties, and assumptions which could, individually or in aggregate, cause actual results or financial condition to differ materially from those anticipated above. Reference is made to “Caution About Forward-Looking Statements” in the earnings release which also applies to this guidance. 19

2019 Initial Financial Guidance 2019 Guidance Average Earning Assets $28.6B ~ $28.9B Consolidated Loan Growth % 5% ~ 7% Consolidated Deposit Growth % 5% ~ 7% Provision Expense $35MM ~ $49MM Non-Interest Income (Core Basis) $215MM ~ $225MM Non-Interest Expense (Core Basis) $685MM ~ $700MM Net Interest Margin 3.60% ~ 3.70% Tax Rate 22.5% ~ 23.5% Preferred Dividend & Unrestricted Shares $12.5MM ~ $13.5MM Common Share Repurchases $135MM ~ $150MM Credit Quality Stable • Assumes two additional federal funds rate increases in 2019 • Impact of capital deployment alternatives related to the $55 million non-core permanent tax item in 2018 are not included in the guidance at this time. Once received, management and the Board of Directors will evaluate deployment alternatives, which may include increased dividends, additional share repurchases, and/or balance sheet management strategies • We continue to manage the business for long-term value creation for all shareholders The Company’s guidance is subject to risks, uncertainties, and assumptions which could, individually or in aggregate, cause actual results or financial condition to differ materially from those anticipated above. Reference is made to “Caution About Forward-Looking Statements” in the earnings release which also applies to this guidance. 20

APPENDIX 21

Loans and Deposits By State Total Loans Total Deposits $22.3 Billion $23.2 Billion Note:Figures at period-end September 30, 2018 22

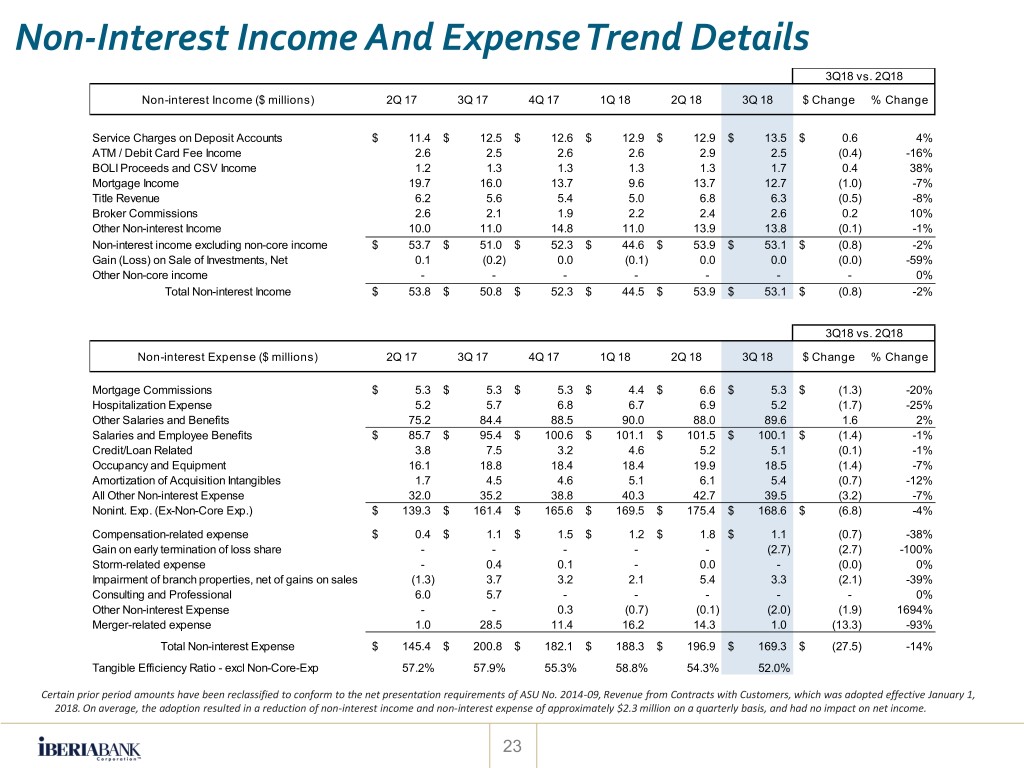
Non-Interest Income And Expense Trend Details 3Q18 vs. 2Q18 Non-interest Income ($ millions) 2Q 17 3Q 17 4Q 17 1Q 18 2Q 18 3Q 18 $ Change % Change Service Charges on Deposit Accounts $ 11.4 $ 12.5 $ 12.6 $ 12.9 $ 12.9 $ 13.5 $ 0.6 4% ATM / Debit Card Fee Income 2.6 2.5 2.6 2.6 2.9 2.5 (0.4) -16% BOLI Proceeds and CSV Income 1.2 1.3 1.3 1.3 1.3 1.7 0.4 38% Mortgage Income 19.7 16.0 13.7 9.6 13.7 12.7 (1.0) -7% Title Revenue 6.2 5.6 5.4 5.0 6.8 6.3 (0.5) -8% Broker Commissions 2.6 2.1 1.9 2.2 2.4 2.6 0.2 10% Other Non-interest Income 10.0 11.0 14.8 11.0 13.9 13.8 (0.1) -1% Non-interest income excluding non-core income $ 53.7 $ 51.0 $ 52.3 $ 44.6 $ 53.9 $ 53.1 $ (0.8) -2% Gain (Loss) on Sale of Investments, Net 0.1 (0.2) 0.0 (0.1) 0.0 0.0 (0.0) -59% Other Non-core income - - - - - - - 0% Total Non-interest Income $ 53.8 $ 50.8 $ 52.3 $ 44.5 $ 53.9 $ 53.1 $ (0.8) -2% 3Q18 vs. 2Q18 Non-interest Expense ($ millions) 2Q 17 3Q 17 4Q 17 1Q 18 2Q 18 3Q 18 $ Change % Change Mortgage Commissions $ 5.3 $ 5.3 $ 5.3 $ 4.4 $ 6.6 $ 5.3 $ (1.3) -20% Hospitalization Expense 5.2 5.7 6.8 6.7 6.9 5.2 (1.7) -25% Other Salaries and Benefits 75.2 84.4 88.5 90.0 88.0 89.6 1.6 2% Salaries and Employee Benefits $ 85.7 $ 95.4 $ 100.6 $ 101.1 $ 101.5 $ 100.1 $ (1.4) -1% Credit/Loan Related 3.8 7.5 3.2 4.6 5.2 5.1 (0.1) -1% Occupancy and Equipment 16.1 18.8 18.4 18.4 19.9 18.5 (1.4) -7% Amortization of Acquisition Intangibles 1.7 4.5 4.6 5.1 6.1 5.4 (0.7) -12% All Other Non-interest Expense 32.0 35.2 38.8 40.3 42.7 39.5 (3.2) -7% Nonint. Exp. (Ex-Non-Core Exp.) $ 139.3 $ 161.4 $ 165.6 $ 169.5 $ 175.4 $ 168.6 $ (6.8) -4% Compensation-related expense $ 0.4 $ 1.1 $ 1.5 $ 1.2 $ 1.8 $ 1.1 (0.7) -38% Gain on early termination of loss share - - - - - (2.7) (2.7) -100% Storm-related expense - 0.4 0.1 - 0.0 - (0.0) 0% Impairment of branch properties, net of gains on sales (1.3) 3.7 3.2 2.1 5.4 3.3 (2.1) -39% Consulting and Professional 6.0 5.7 - - - - - 0% Other Non-interest Expense - - 0.3 (0.7) (0.1) (2.0) (1.9) 1694% Merger-related expense 1.0 28.5 11.4 16.2 14.3 1.0 (13.3) -93% Total Non-interest Expense $ 145.4 $ 200.8 $ 182.1 $ 188.3 $ 196.9 $ 169.3 $ (27.5) -14% Tangible Efficiency Ratio - excl Non-Core-Exp 57.2% 57.9% 55.3% 58.8% 54.3% 52.0% Certain prior period amounts have been reclassified to conform to the net presentation requirements of ASU No. 2014-09, Revenue from Contracts with Customers, which was adopted effective January 1, 2018. On average, the adoption resulted in a reduction of non-interest income and non-interest expense of approximately $2.3 million on a quarterly basis, and had no impact on net income. 23

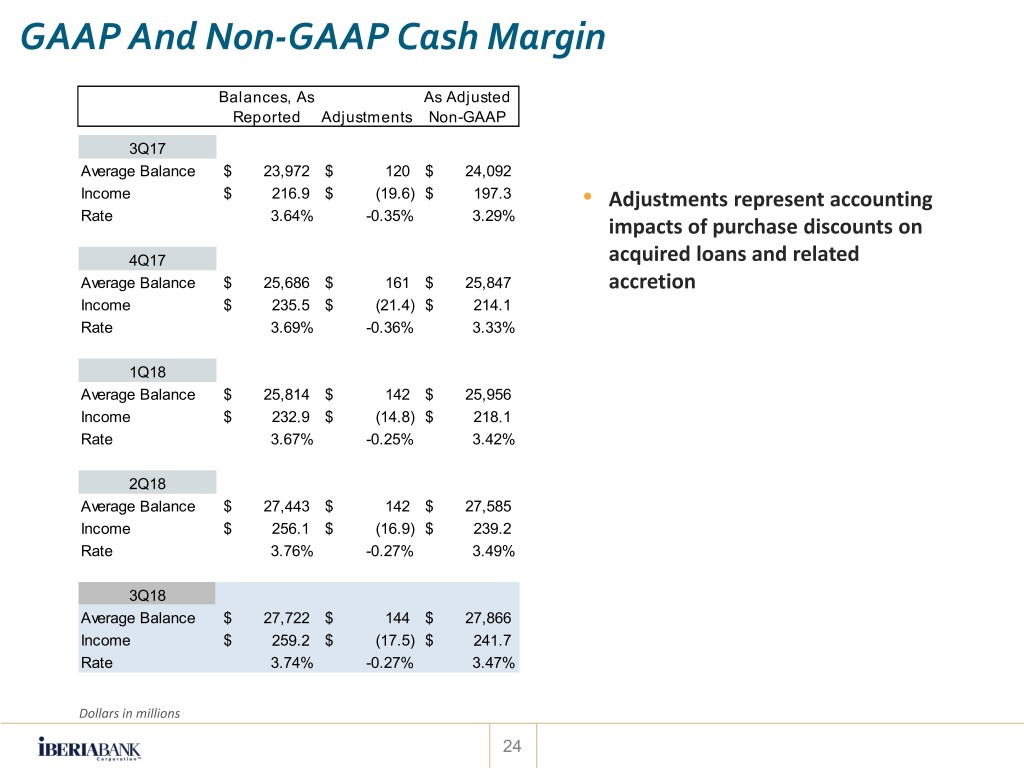
GAAP And Non-GAAP Cash Margin Balances, As As Adjusted Reported Adjustments Non-GAAP 3Q17 Average Balance $ 23,972 $ 120 $ 24,092 Income $ 216.9 $ (19.6) $ 197.3 • Adjustments represent accounting Rate 3.64% -0.35% 3.29% impacts of purchase discounts on 4Q17 acquired loans and related Average Balance $ 25,686 $ 161 $ 25,847 accretion Income $ 235.5 $ (21.4) $ 214.1 Rate 3.69% -0.36% 3.33% 1Q18 Average Balance $ 25,814 $ 142 $ 25,956 Income $ 232.9 $ (14.8) $ 218.1 Rate 3.67% -0.25% 3.42% 2Q18 Average Balance $ 27,443 $ 142 $ 27,585 Income $ 256.1 $ (16.9) $ 239.2 Rate 3.76% -0.27% 3.49% 3Q18 Average Balance $ 27,722 $ 144 $ 27,866 Income $ 259.2 $ (17.5) $ 241.7 Rate 3.74% -0.27% 3.47% Dollars in millions 24

Reconciliation Of Non-GAAP Financial Measures For The Quarter Ended March 31, 2018 June 30, 2018 September 30, 2018 D ollar Amount D ollar Amount D ollar Amount Pre-tax After-tax Per share Pre-tax After-tax Per share Pre-tax After-tax Per share Income available to common shareholders (GAAP) $ 81.2 $ 60.0 $ 1.10 $ 105.6 $ 74.2 $ 1.30 $ 131.9 $ 97.9 $ 1.73 Non-interest income adjustments Gain on sale of investments and other non-interest income (0.0) (0.0) (0.00) (0.0) (0.0) (0.00) (0.0) (0.0) (0.00) Non-interest expense adjustments Merger-related expense 16.2 12.5 0.23 14.3 11.0 0.20 1.0 0.7 0.01 Compensation-related expense 1.2 0.9 0.02 1.8 1.4 0.02 1.1 0.8 0.01 Impairment of long-lived assets, net of (gain) loss on sale 2.1 1.6 0.03 5.4 4.1 0.07 3.3 2.5 0.05 Litigation expense - - - - - - - - - (Gain) on early termination of loss share agreements - - - - - - (2.7) (2.0) (0.04) Other non-operating non-interest expense (0.7) (0.5) (0.01) (0.1) (0.1) - (2.0) (1.5) (0.02) Total non-interest expense adjustments 18.8 14.5 0.27 21.4 16.4 0.29 0.7 0.5 0.01 Income tax benefits - 0.2 - - 6.6 0.12 - - - Core earnings (Non-GAAP) 100.0 74.7 1.37 127.0 97.2 1.71 132.6 98.4 1.74 Provision for loan losses 8.0 6.3 7.6 5.7 11.1 8.4 Pre-provision earnings, as adjusted (Non-GAAP) $ 108.0 $ 81.0 $ 134.6 $ 102.9 143.7 106.8 (1) Per share amounts may not appear to foot due to rounding. (2) Excluding merger-related expense and litigation expense, after-tax amounts are calculated using a tax rate of 24% in 2018 and 35% in 2017, which approximates the marginal tax rate. • No material non-core income in 3Q18 • Net non-core expenses equal to $0.7 million pre-tax, or $0.01 EPS after-tax: • Merger-related expenses equal to $1.0 million, or $0.01 EPS after-tax • Compensation-related expense equal to $1.1 million, or $0.01 EPS after-tax • Impairment of branch properties equal to $3.3 million, or $0.05 EPS after-tax • Gain on early termination of loss share agreements with the FDIC equal to $2.7 million, or $0.04 after-tax • Other gains equal to $2.0 million, or $0.02 EPS after-tax, include gains on sales of former bank Dollars in millions properties and title plant assets 25

