Attached files
| file | filename |
|---|---|
| EX-99.2 - EXHIBIT 99.2 - Bank of New York Mellon Corp | ex992_financialsupplementx.htm |
| EX-99.1 - EXHIBIT 99.1 - Bank of New York Mellon Corp | ex991_earningsreleasex3q18.htm |
| 8-K - FORM 8-K - Bank of New York Mellon Corp | form8-k_earningsxoctober18.htm |
BNY Mellon Third Quarter 2018 Financial Highlights October 18, 2018

Cautionary Statement A number of statements in our presentations, the accompanying slides and the responses to your questions are “forward-looking statements.” Words such as “estimate”, “forecast”, “project”, “anticipate”, “likely”, “target”, “expect”, “intend”, “continue”, “seek”, “believe”, “plan”, “goal”, “could”, “should”, “would”, “may”, “might”, “will”, “strategy”, “synergies”, “opportunities”, “trends”, “future” and words of similar meaning signify forward-looking statements. These statements relate to, among other things, The Bank of New York Mellon Corporation’s (the “Corporation”) expectations regarding: capital plans, strategic priorities, financial goals, organic growth and efficiency, talent acquisition, expenses, including costs associated with the Corporation’s relocation strategy and timing of such costs, deposits, taxes, business opportunities, preliminary business metrics and regulatory capital ratios; and statements regarding the Corporation's aspirations, as well as the Corporation’s overall plans, strategies, goals, objectives, expectations, outlooks, estimates, intentions, targets, opportunities and initiatives. These forward-looking statements are based on assumptions that involve risks and uncertainties and that are subject to change based on various important factors (some of which are beyond the Corporation’s control). Actual outcomes may differ materially from those expressed or implied as a result of the factors described under “Forward Looking Statements” and “Risk Factors” in the Corporation’s Annual Report on Form 10-K for the year ended December 31, 2017 (the “2017 Annual Report”) and in other filings of the Corporation with the Securities and Exchange Commission (the “SEC”). Such forward-looking statements speak only as of October 18, 2018, and the Corporation undertakes no obligation to update any forward-looking statement to reflect events or circumstances after that date or to reflect the occurrence of unanticipated events. For additional information regarding the Corporation, please refer to the Corporation's SEC filings available at www.bnymellon.com/investorrelations. Non-GAAP Measures: In this presentation we discuss some non-GAAP measures in detailing the Corporation’s performance, which exclude certain items or otherwise include components that differ from GAAP. We believe these measures are useful to the investment community in analyzing the financial results and trends of ongoing operations. We believe they facilitate comparisons with prior periods and reflect the principal basis on which our management monitors financial performance. Additional disclosures relating to non-GAAP measures are contained in the Corporation’s reports filed with the SEC, including the 2017 Annual Report, and are available at www.bnymellon.com/ investorrelations. 2 Third Quarter 2018 – Financial Highlights

Financial Highlights • Third quarter earnings of $1.1 billion, or $1.06 per common share, up 13% ◦ Significant items in the third quarter – Litigation increased expenses 2%; $(0.05) per common share – Positive impact of tax adjustment related to U.S. tax legislation and other changes; $0.05 per common share ◦ Returned $885 million of capital to common shareholders through $602 million of share repurchases and $283 million in dividends • Year-to-date earnings of $3.3 billion, or $3.20 per common share, up 21% ◦ Year-to-date returned $2.7 billion of capital to common shareholders through $1.9 billion of share repurchases and $0.8 billion in dividends 3 Third Quarter 2018 – Financial Highlights
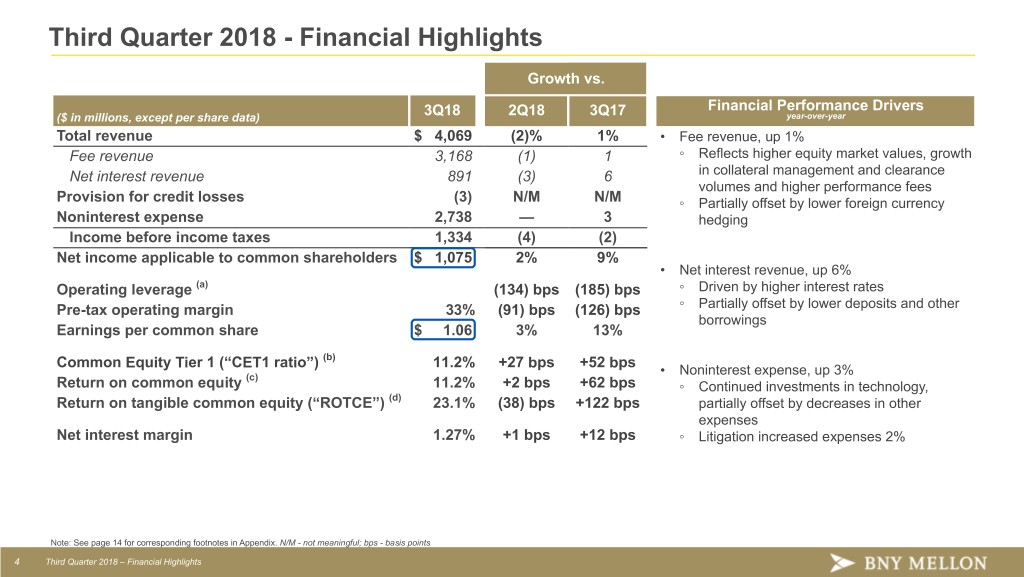
Third Quarter 2018 - Financial Highlights Growth vs. Financial Performance Drivers ($ in millions, except per share data) 3Q18 2Q18 3Q17 year-over-year Total revenue $ 4,069 (2)% 1% • Fee revenue, up 1% Fee revenue 3,168 (1) 1 ◦ Reflects higher equity market values, growth Net interest revenue 891 (3) 6 in collateral management and clearance volumes and higher performance fees Provision for credit losses (3) N/M N/M ◦ Partially offset by lower foreign currency Noninterest expense 2,738 — 3 hedging Income before income taxes 1,334 (4) (2) Net income applicable to common shareholders $ 1,075 2% 9% • Net interest revenue, up 6% Operating leverage (a) (134) bps (185) bps ◦ Driven by higher interest rates Pre-tax operating margin 33% (91) bps (126) bps ◦ Partially offset by lower deposits and other borrowings Earnings per common share $ 1.06 3% 13% Common Equity Tier 1 (“CET1 ratio”) (b) 11.2% +27 bps +52 bps • Noninterest expense, up 3% (c) Return on common equity 11.2% +2 bps +62 bps ◦ Continued investments in technology, Return on tangible common equity (“ROTCE”) (d) 23.1% (38) bps +122 bps partially offset by decreases in other expenses Net interest margin 1.27% +1 bps +12 bps ◦ Litigation increased expenses 2% Note: See page 14 for corresponding footnotes in Appendix. N/M - not meaningful; bps - basis points 4 Third Quarter 2018 – Financial Highlights
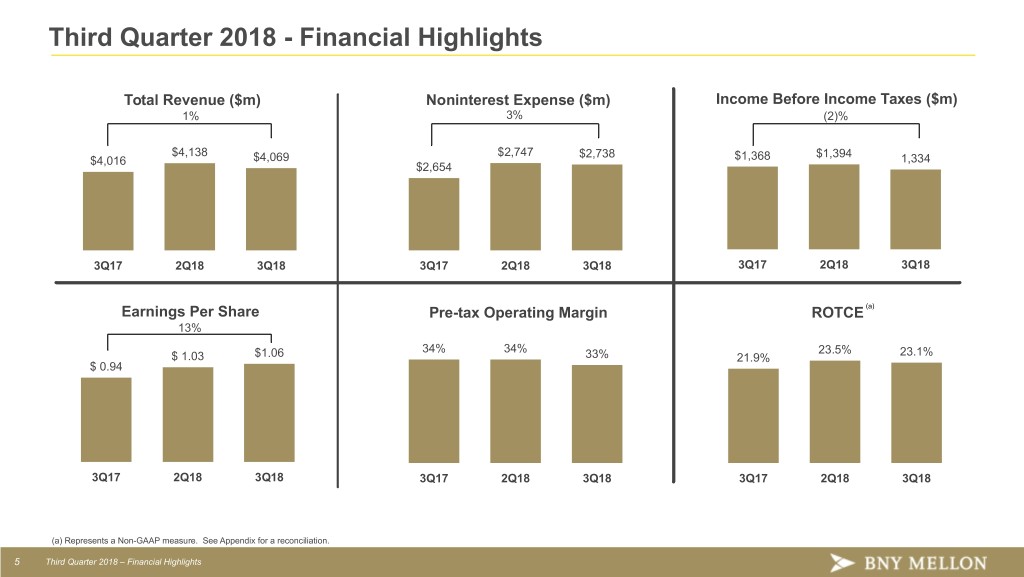
Third Quarter 2018 - Financial Highlights Total Revenue ($m) Noninterest Expense ($m) Income Before Income Taxes ($m) 1% 3% (2)% $4,138 $2,747 $2,738 $1,394 $4,016 $4,069 $1,368 1,334 $2,654 3Q17 2Q18 3Q18 3Q17 2Q18 3Q18 3Q17 2Q18 3Q18 Earnings Per Share Pre-tax Operating Margin ROTCE (a) 13% 34% 34% 23.5% 23.1% $ 1.03 $1.06 33% 21.9% $ 0.94 3Q17 2Q18 3Q18 3Q17 2Q18 3Q18 3Q17 2Q18 3Q18 (a) Represents a Non-GAAP measure. See Appendix for a reconciliation. 5 Third Quarter 2018 – Financial Highlights
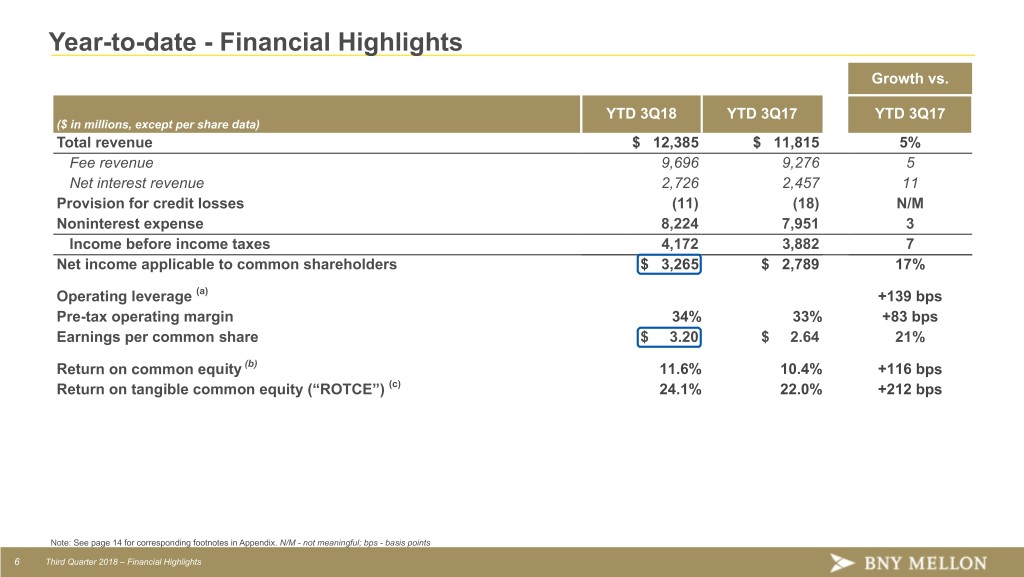
Year-to-date - Financial Highlights Growth vs. YTD 3Q18 YTD 3Q17 YTD 3Q17 ($ in millions, except per share data) Total revenue $ 12,385 $ 11,815 5% Fee revenue 9,696 9,276 5 Net interest revenue 2,726 2,457 11 Provision for credit losses (11) (18) N/M Noninterest expense 8,224 7,951 3 Income before income taxes 4,172 3,882 7 Net income applicable to common shareholders $ 3,265 $ 2,789 17% Operating leverage (a) +139 bps Pre-tax operating margin 34% 33% +83 bps Earnings per common share $ 3.20 $ 2.64 21% Return on common equity (b) 11.6% 10.4% +116 bps Return on tangible common equity (“ROTCE”) (c) 24.1% 22.0% +212 bps Note: See page 14 for corresponding footnotes in Appendix. N/M - not meaningful; bps - basis points 6 Third Quarter 2018 – Financial Highlights

Year-to-date - Financial Highlights Total Revenue ($m) Noninterest Expense ($m) Income Before Income Taxes ($m) 5% 3% 7% $12,385 $8,224 $4,172 $7,951 $3,882 $11,815 YTD 3Q17 YTD 3Q18 YTD 3Q17 YTD 3Q18 YTD 3Q17 YTD 3Q18 Earnings Per Share Pre-tax Operating Margin ROTCE (a) 21% 34% 24.1% $ 3.20 33% 22.0% $ 2.64 YTD 3Q17 YTD 3Q18 YTD 3Q17 YTD 3Q18 YTD 3Q17 YTD 3Q18 (a) Represents a Non-GAAP measure. See Appendix for a reconciliation. 7 Third Quarter 2018 – Financial Highlights
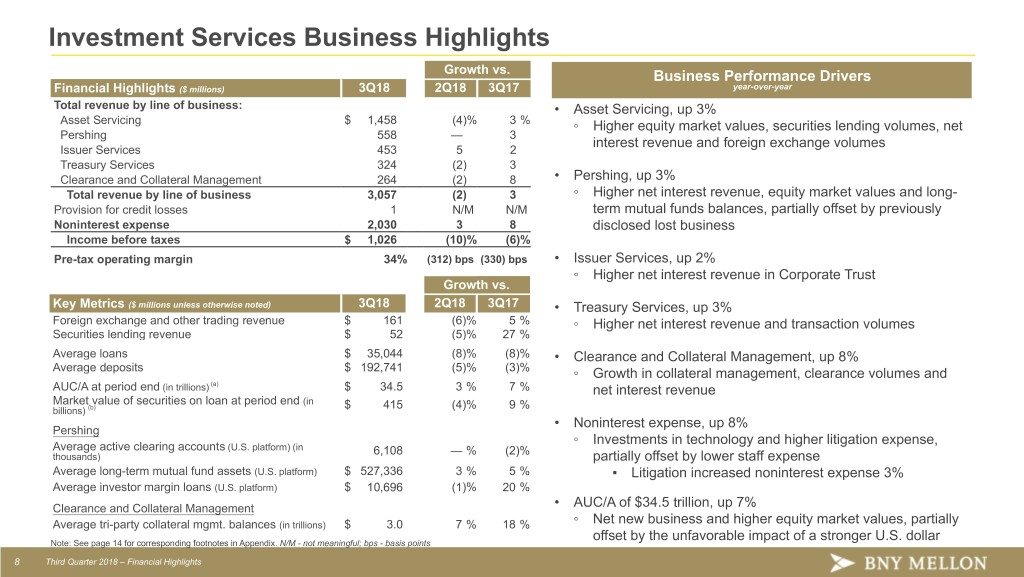
Investment Services Business Highlights Growth vs. Business Performance Drivers Financial Highlights ($ millions) 3Q18 2Q18 3Q17 year-over-year Total revenue by line of business: • Asset Servicing, up 3% Asset Servicing $ 1,458 (4)% 3 % ◦ Higher equity market values, securities lending volumes, net Pershing 558 — 3 interest revenue and foreign exchange volumes Issuer Services 453 5 2 Treasury Services 324 (2) 3 Clearance and Collateral Management 264 (2) 8 • Pershing, up 3% Total revenue by line of business 3,057 (2) 3 ◦ Higher net interest revenue, equity market values and long- Provision for credit losses 1 N/M N/M term mutual funds balances, partially offset by previously Noninterest expense 2,030 3 8 disclosed lost business Income before taxes $ 1,026 (10)% (6)% Pre-tax operating margin 34% (312) bps (330) bps • Issuer Services, up 2% ◦ Higher net interest revenue in Corporate Trust Growth vs. Key Metrics ($ millions unless otherwise noted) 3Q18 2Q18 3Q17 • Treasury Services, up 3% Foreign exchange and other trading revenue $ 161 (6)% 5 % ◦ Higher net interest revenue and transaction volumes Securities lending revenue $ 52 (5)% 27 % Average loans $ 35,044 (8)% (8)% • Clearance and Collateral Management, up 8% Average deposits $ 192,741 (5)% (3)% ◦ Growth in collateral management, clearance volumes and AUC/A at period end (in trillions) (a) $ 34.5 3 % 7 % net interest revenue Market value of securities on loan at period end (in (b) $ 415 (4)% 9 % billions) • Noninterest expense, up 8% Pershing ◦ Investments in technology and higher litigation expense, Average active clearing accounts (U.S. platform) (in 6,108 — % (2)% thousands) partially offset by lower staff expense Average long-term mutual fund assets (U.S. platform) $ 527,336 3 % 5 % ▪ Litigation increased noninterest expense 3% Average investor margin loans (U.S. platform) $ 10,696 (1)% 20 % Clearance and Collateral Management • AUC/A of $34.5 trillion, up 7% Average tri-party collateral mgmt. balances (in trillions) $ 3.0 7 % 18 % ◦ Net new business and higher equity market values, partially offset by the unfavorable impact of a stronger U.S. dollar Note: See page 14 for corresponding footnotes in Appendix. N/M - not meaningful; bps - basis points 8 Third Quarter 2018 – Financial Highlights
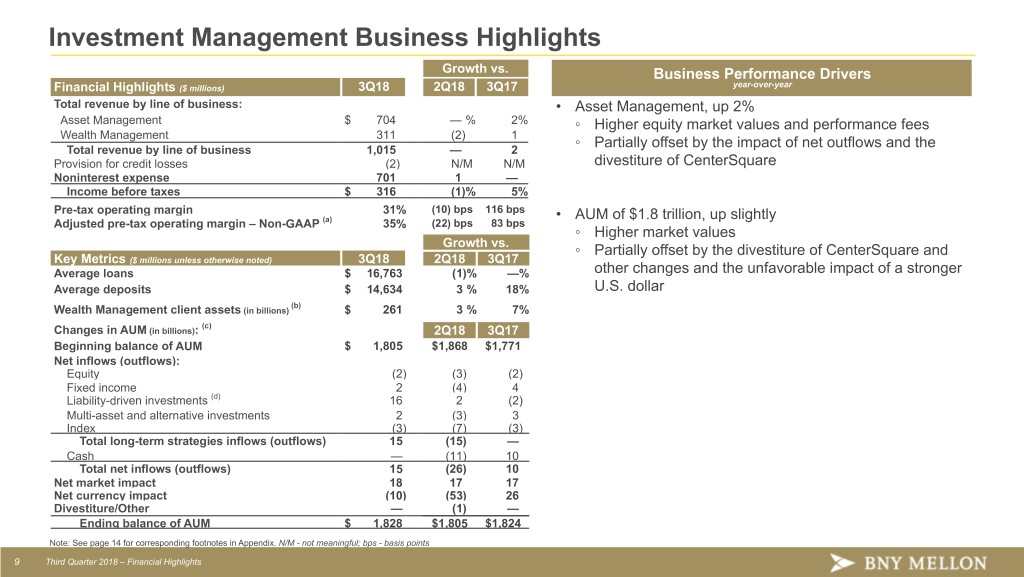
Investment Management Business Highlights Growth vs. Business Performance Drivers Financial Highlights ($ millions) 3Q18 2Q18 3Q17 year-over-year Total revenue by line of business: • Asset Management, up 2% Asset Management $ 704 — % 2% ◦ Higher equity market values and performance fees Wealth Management 311 (2) 1 ◦ Partially offset by the impact of net outflows and the Total revenue by line of business 1,015 — 2 Provision for credit losses (2) N/M N/M divestiture of CenterSquare Noninterest expense 701 1 — Income before taxes $ 316 (1)% 5% Pre-tax operating margin 31% (10) bps 116 bps • AUM of $1.8 trillion, up slightly Adjusted pre-tax operating margin – Non-GAAP (a) 35% (22) bps 83 bps ◦ Higher market values Growth vs. ◦ Partially offset by the divestiture of CenterSquare and Key Metrics ($ millions unless otherwise noted) 3Q18 2Q18 3Q17 Average loans $ 16,763 (1)% —% other changes and the unfavorable impact of a stronger Average deposits $ 14,634 3 % 18% U.S. dollar (b) Wealth Management client assets (in billions) $ 261 3 % 7% (c) Changes in AUM (in billions): 2Q18 3Q17 Beginning balance of AUM $ 1,805 $1,868 $1,771 Net inflows (outflows): Equity (2) (3) (2) Fixed income 2 (4) 4 Liability-driven investments (d) 16 2 (2) Multi-asset and alternative investments 2 (3) 3 Index (3) (7) (3) Total long-term strategies inflows (outflows) 15 (15) — Cash — (11) 10 Total net inflows (outflows) 15 (26) 10 Net market impact 18 17 17 Net currency impact (10) (53) 26 Divestiture/Other — (1) — Ending balance of AUM $ 1,828 $1,805 $1,824 Note: See page 14 for corresponding footnotes in Appendix. N/M - not meaningful; bps - basis points 9 Third Quarter 2018 – Financial Highlights
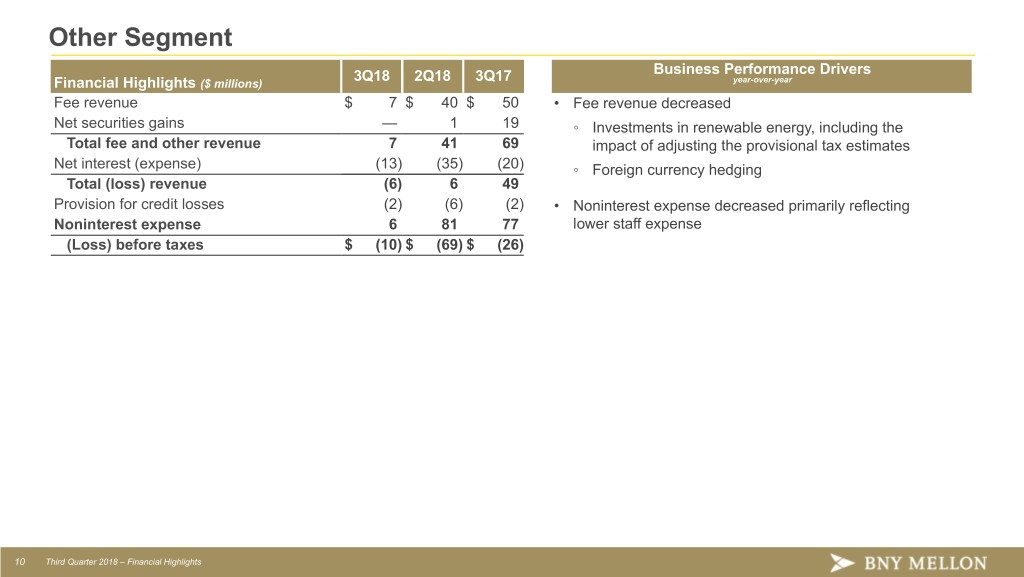
Other Segment 3Q18 2Q18 3Q17 Business Performance Drivers Financial Highlights ($ millions) year-over-year Fee revenue $ 7 $ 40 $ 50 • Fee revenue decreased Net securities gains — 1 19 ◦ Investments in renewable energy, including the Total fee and other revenue 7 41 69 impact of adjusting the provisional tax estimates Net interest (expense) (13) (35) (20) ◦ Foreign currency hedging Total (loss) revenue (6) 6 49 Provision for credit losses (2) (6) (2) • Noninterest expense decreased primarily reflecting Noninterest expense 6 81 77 lower staff expense (Loss) before taxes $ (10) $ (69) $ (26) 10 Third Quarter 2018 – Financial Highlights
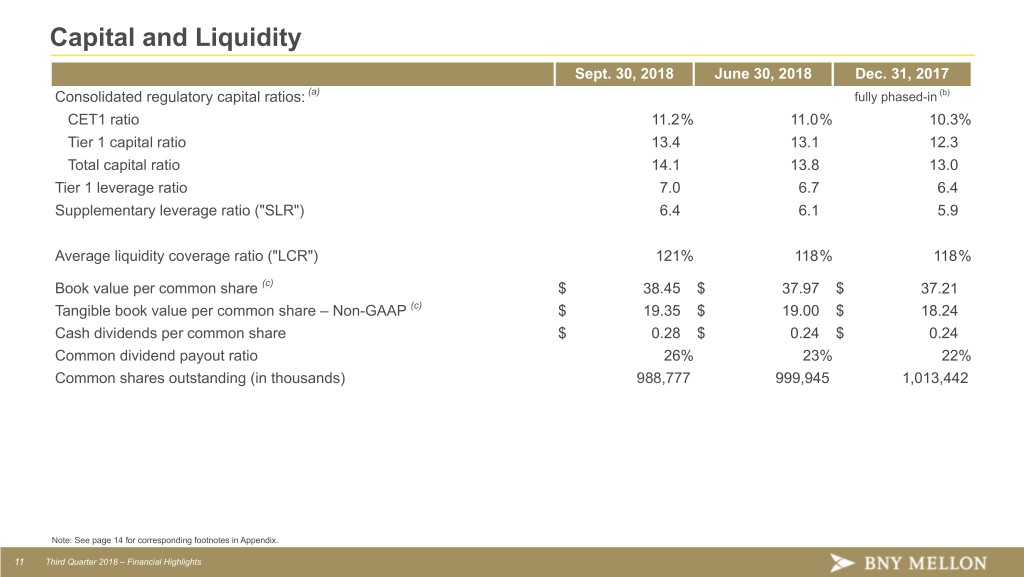
Capital and Liquidity Sept. 30, 2018 June 30, 2018 Dec. 31, 2017 Consolidated regulatory capital ratios: (a) fully phased-in (b) CET1 ratio 11.2% 11.0% 10.3% Tier 1 capital ratio 13.4 13.1 12.3 Total capital ratio 14.1 13.8 13.0 Tier 1 leverage ratio 7.0 6.7 6.4 Supplementary leverage ratio ("SLR") 6.4 6.1 5.9 Average liquidity coverage ratio ("LCR") 121% 118% 118% Book value per common share (c) $ 38.45 $ 37.97 $ 37.21 Tangible book value per common share – Non-GAAP (c) $ 19.35 $ 19.00 $ 18.24 Cash dividends per common share $ 0.28 $ 0.24 $ 0.24 Common dividend payout ratio 26% 23% 22% Common shares outstanding (in thousands) 988,777 999,945 1,013,442 Note: See page 14 for corresponding footnotes in Appendix. 11 Third Quarter 2018 – Financial Highlights
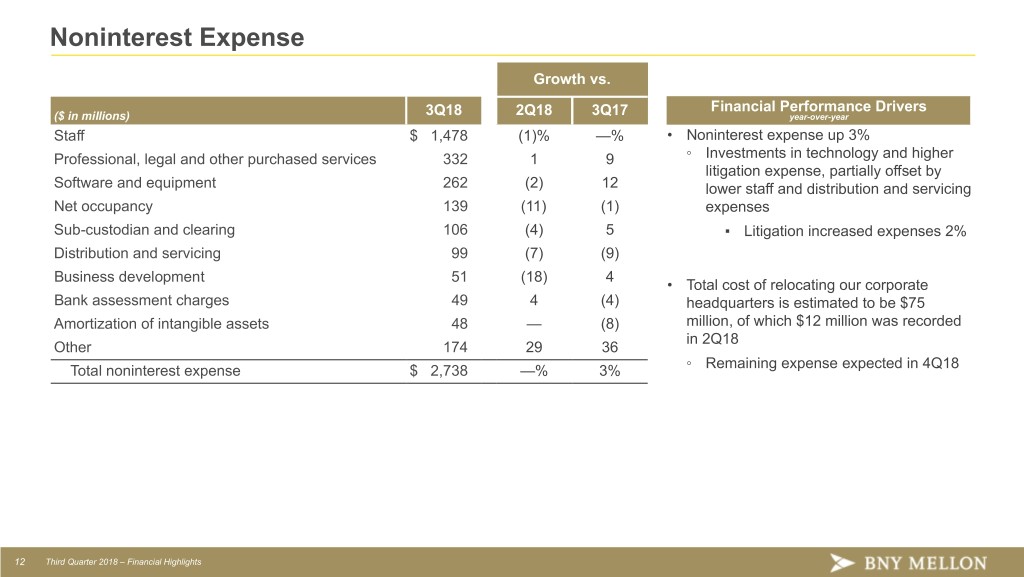
Noninterest Expense Growth vs. Financial Performance Drivers ($ in millions) 3Q18 2Q18 3Q17 year-over-year Staff $ 1,478 (1)% —% • Noninterest expense up 3% Professional, legal and other purchased services 332 1 9 ◦ Investments in technology and higher litigation expense, partially offset by Software and equipment 262 (2) 12 lower staff and distribution and servicing Net occupancy 139 (11) (1) expenses Sub-custodian and clearing 106 (4) 5 ▪ Litigation increased expenses 2% Distribution and servicing 99 (7) (9) Business development 51 (18) 4 • Total cost of relocating our corporate Bank assessment charges 49 4 (4) headquarters is estimated to be $75 Amortization of intangible assets 48 — (8) million, of which $12 million was recorded in 2Q18 Other 174 29 36 ◦ Remaining expense expected in 4Q18 Total noninterest expense $ 2,738 —% 3% 12 Third Quarter 2018 – Financial Highlights

Appendix
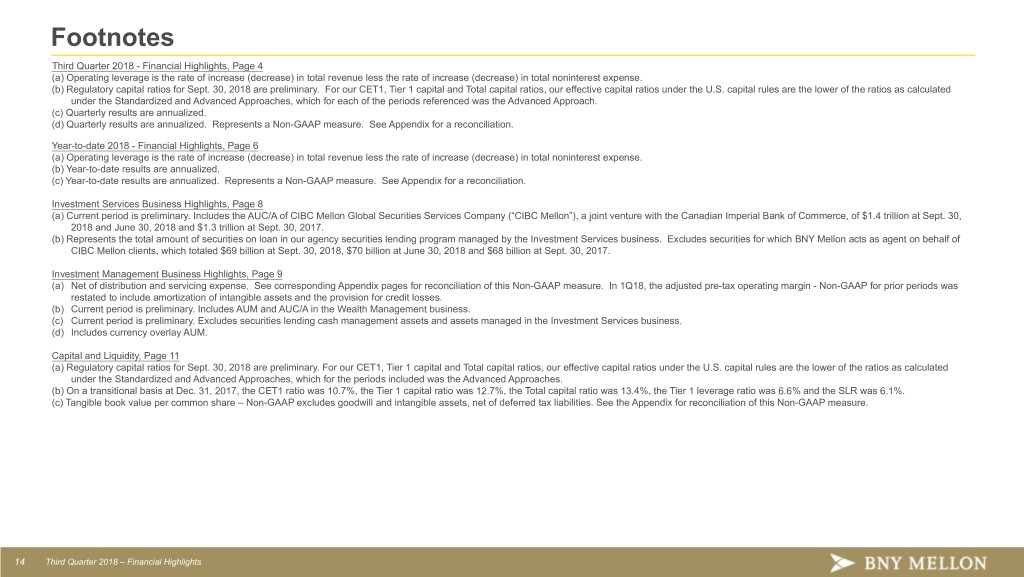
Footnotes Third Quarter 2018 - Financial Highlights, Page 4 (a) Operating leverage is the rate of increase (decrease) in total revenue less the rate of increase (decrease) in total noninterest expense. (b) Regulatory capital ratios for Sept. 30, 2018 are preliminary. For our CET1, Tier 1 capital and Total capital ratios, our effective capital ratios under the U.S. capital rules are the lower of the ratios as calculated under the Standardized and Advanced Approaches, which for each of the periods referenced was the Advanced Approach. (c) Quarterly results are annualized. (d) Quarterly results are annualized. Represents a Non-GAAP measure. See Appendix for a reconciliation. Year-to-date 2018 - Financial Highlights, Page 6 (a) Operating leverage is the rate of increase (decrease) in total revenue less the rate of increase (decrease) in total noninterest expense. (b) Year-to-date results are annualized. (c) Year-to-date results are annualized. Represents a Non-GAAP measure. See Appendix for a reconciliation. Investment Services Business Highlights, Page 8 (a) Current period is preliminary. Includes the AUC/A of CIBC Mellon Global Securities Services Company (“CIBC Mellon”), a joint venture with the Canadian Imperial Bank of Commerce, of $1.4 trillion at Sept. 30, 2018 and June 30, 2018 and $1.3 trillion at Sept. 30, 2017. (b) Represents the total amount of securities on loan in our agency securities lending program managed by the Investment Services business. Excludes securities for which BNY Mellon acts as agent on behalf of CIBC Mellon clients, which totaled $69 billion at Sept. 30, 2018, $70 billion at June 30, 2018 and $68 billion at Sept. 30, 2017. Investment Management Business Highlights, Page 9 (a) Net of distribution and servicing expense. See corresponding Appendix pages for reconciliation of this Non-GAAP measure. In 1Q18, the adjusted pre-tax operating margin - Non-GAAP for prior periods was restated to include amortization of intangible assets and the provision for credit losses. (b) Current period is preliminary. Includes AUM and AUC/A in the Wealth Management business. (c) Current period is preliminary. Excludes securities lending cash management assets and assets managed in the Investment Services business. (d) Includes currency overlay AUM. Capital and Liquidity, Page 11 (a) Regulatory capital ratios for Sept. 30, 2018 are preliminary. For our CET1, Tier 1 capital and Total capital ratios, our effective capital ratios under the U.S. capital rules are the lower of the ratios as calculated under the Standardized and Advanced Approaches, which for the periods included was the Advanced Approaches. (b) On a transitional basis at Dec. 31, 2017, the CET1 ratio was 10.7%, the Tier 1 capital ratio was 12.7%, the Total capital ratio was 13.4%, the Tier 1 leverage ratio was 6.6% and the SLR was 6.1%. (c) Tangible book value per common share – Non-GAAP excludes goodwill and intangible assets, net of deferred tax liabilities. See the Appendix for reconciliation of this Non-GAAP measure. 14 Third Quarter 2018 – Financial Highlights
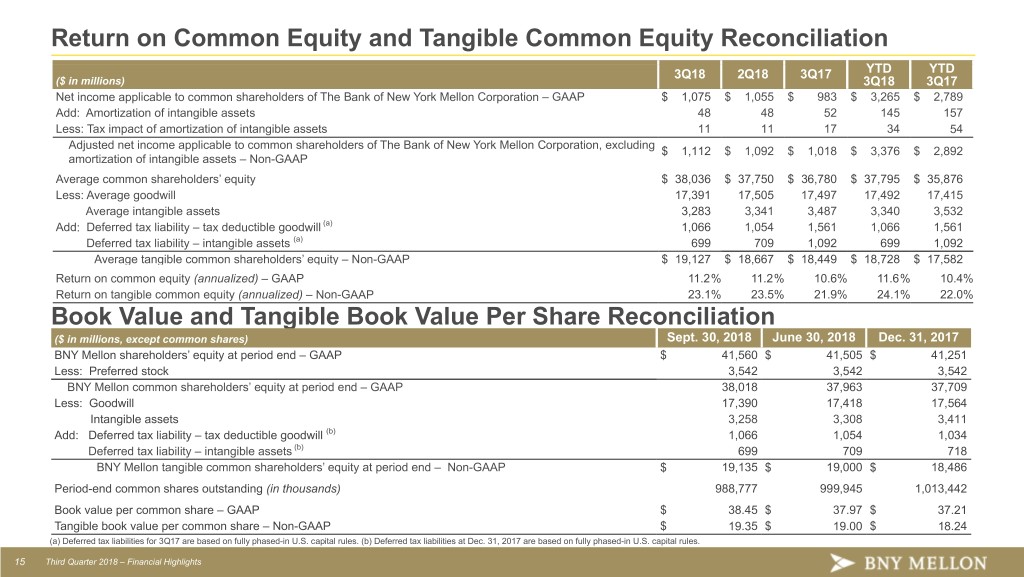
TO BE UPDATED Return on Common Equity and Tangible Common Equity Reconciliation 3Q18 2Q18 3Q17 YTD YTD ($ in millions) 3Q18 3Q17 Net income applicable to common shareholders of The Bank of New York Mellon Corporation – GAAP $ 1,075 $ 1,055 $ 983 $ 3,265 $ 2,789 Add: Amortization of intangible assets 48 48 52 145 157 Less: Tax impact of amortization of intangible assets 11 11 17 34 54 Adjusted net income applicable to common shareholders of The Bank of New York Mellon Corporation, excluding $ 1,112 $ 1,092 $ 1,018 $ 3,376 $ 2,892 amortization of intangible assets – Non-GAAP Average common shareholders’ equity $ 38,036 $ 37,750 $ 36,780 $ 37,795 $ 35,876 Less: Average goodwill 17,391 17,505 17,497 17,492 17,415 Average intangible assets 3,283 3,341 3,487 3,340 3,532 Add: Deferred tax liability – tax deductible goodwill (a) 1,066 1,054 1,561 1,066 1,561 Deferred tax liability – intangible assets (a) 699 709 1,092 699 1,092 Average tangible common shareholders’ equity – Non-GAAP $ 19,127 $ 18,667 $ 18,449 $ 18,728 $ 17,582 Return on common equity (annualized) – GAAP 11.2% 11.2% 10.6% 11.6% 10.4% Return on tangible common equity (annualized) – Non-GAAP 23.1% 23.5% 21.9% 24.1% 22.0% Book Value and Tangible Book Value Per Share Reconciliation ($ in millions, except common shares) Sept. 30, 2018 June 30, 2018 Dec. 31, 2017 BNY Mellon shareholders’ equity at period end – GAAP $ 41,560 $ 41,505 $ 41,251 Less: Preferred stock 3,542 3,542 3,542 BNY Mellon common shareholders’ equity at period end – GAAP 38,018 37,963 37,709 Less: Goodwill 17,390 17,418 17,564 Intangible assets 3,258 3,308 3,411 Add: Deferred tax liability – tax deductible goodwill (b) 1,066 1,054 1,034 Deferred tax liability – intangible assets (b) 699 709 718 BNY Mellon tangible common shareholders’ equity at period end – Non-GAAP $ 19,135 $ 19,000 $ 18,486 Period-end common shares outstanding (in thousands) 988,777 999,945 1,013,442 Book value per common share – GAAP $ 38.45 $ 37.97 $ 37.21 Tangible book value per common share – Non-GAAP $ 19.35 $ 19.00 $ 18.24 (a) Deferred tax liabilities for 3Q17 are based on fully phased-in U.S. capital rules. (b) Deferred tax liabilities at Dec. 31, 2017 are based on fully phased-in U.S. capital rules. 15 Third Quarter 2018 – Financial Highlights
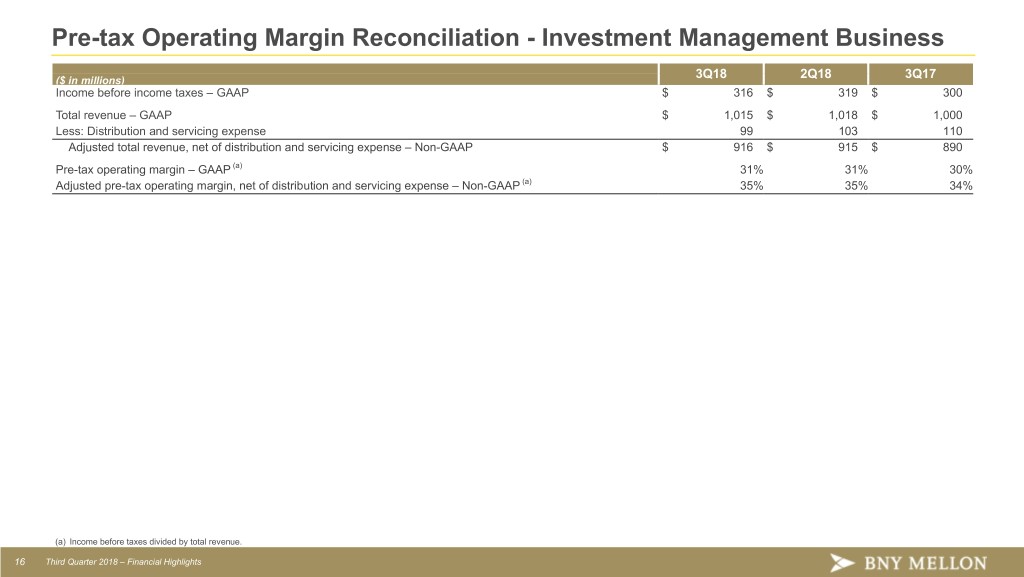
Pre-tax Operating Margin Reconciliation - Investment Management Business 3Q18 2Q18 3Q17 ($ in millions) Income before income taxes – GAAP $ 316 $ 319 $ 300 Total revenue – GAAP $ 1,015 $ 1,018 $ 1,000 Less: Distribution and servicing expense 99 103 110 Adjusted total revenue, net of distribution and servicing expense – Non-GAAP $ 916 $ 915 $ 890 Pre-tax operating margin – GAAP (a) 31% 31% 30% Adjusted pre-tax operating margin, net of distribution and servicing expense – Non-GAAP (a) 35% 35% 34% (a) Income before taxes divided by total revenue. 16 Third Quarter 2018 – Financial Highlights (a) Other charges include severance, litigation, an asset impairment and investment securities losses related to the sale of certain securities.
