Attached files
| file | filename |
|---|---|
| 8-K - FORM 8-K - GOLDMAN SACHS GROUP INC | d612461d8k.htm |
|
|
Exhibit 99.1
The Goldman Sachs Group, Inc. 200 West Street | New York, New York 10282
|

Third Quarter 2018 Earnings Results
Goldman Sachs Reports Third Quarter Earnings Per Common Share of $6.28

"We delivered solid results in the third quarter driven by contributions from across our diversified client franchise. Year-to-date earnings per share is the highest in our history and year-to-date return on equity is the highest in nine years, notwithstanding our continued investment in growth opportunities. We remain well positioned to continue delivering for our clients and shareholders." ~ David M. Solomon, Chief Executive Officer
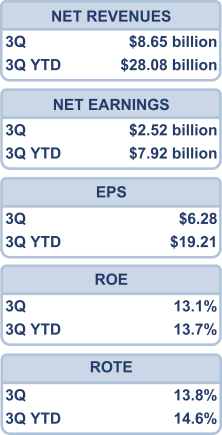
| NEW YORK, October 16, 2018 – The Goldman Sachs Group, Inc. (NYSE: GS) today reported net revenues of $8.65 billion and net earnings of $2.52 billion for the third quarter ended September 30, 2018. Net revenues were $28.08 billion and net earnings were $7.92 billion for the first nine months of 2018.
Diluted earnings per common share (EPS) was $6.28 for the third quarter of 2018 compared with $5.02 for the third quarter of 2017 and $5.98 for the second quarter of 2018, and was $19.21 for the first nine months of 2018 compared with $14.11 for the first nine months of 2017.
Annualized return on average common shareholders’ equity (ROE) (1) was 13.1% for the third quarter of 2018 and 13.7% for the first nine months of 2018. Annualized return on average tangible common shareholders’ equity (ROTE) (1) was 13.8% for the third quarter of 2018 and 14.6% for the first nine months of 2018. |
|
NET REVENUES 3Q $8.65 billion 3Q YTD $28.08 billion NET EARNINGS 3Q $2.52 billion 3Q YTD $7.92 billion EPS 3Q $6.28 3Q YTD $19.21 ROE 3Q 13.1% 3Q YTD 13.7% ROTE 3Q 13.8% 3Q YTD 14.6%
| Media Relations: Jake Siewert 212-902-5400 | Investor Relations: Heather Kennedy Miner 212-902-0300 |
Goldman Sachs Reports: Third Quarter 2018 Earnings Results

| ◾ |
First nine months net revenues of $28.08 billion were 16% higher than the first nine months of 2017 and the highest year-to-date net revenues in eight years. |
| ◾ |
The firm ranked #1 in worldwide announced mergers and acquisitions, equity and equity-related offerings, common stock offerings and initial public offerings for the year-to-date. (2) |
| ◾ |
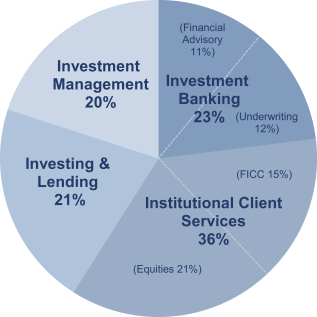
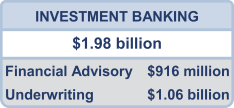
Investment Banking produced strong quarterly net revenues of $1.98 billion, as net revenues in Financial Advisory were the highest in over three years. |
| ◾ |
Investment Management produced quarterly net revenues of $1.70 billion, contributing to record year-to-date net revenues of $5.32 billion. Assets under supervision (3) increased to a record $1.55 trillion, with net inflows in long-term assets under supervision of $13 billion. |
| ◾ |
Year-to-date diluted EPS increased 36% compared with the first nine months of 2017 to a year-to-date record of $19.21. |
| ◾ |
Annualized year-to-date ROE (1) of 13.7% was the highest annualized ROE for the first nine months in nine years. |
| ◾ |
Book value per common share increased 9.0% during the year-to-date to $197.33. |
| ◾ |
The firm’s Standardized and Basel III Advanced common equity tier 1 ratios (3) were 13.1% (4) and 12.4% (4), respectively, an increase of 120 basis points and 170 basis points compared with the fully phased-in ratios at the end of 2017. |

|
|
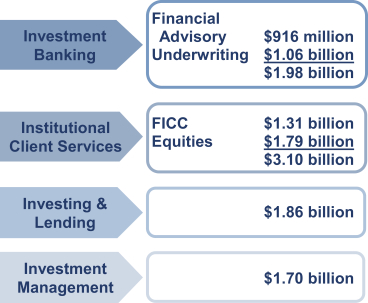
Highlights Quarterly Net Revenue Mix by Segment Investment Banking Financial Advisory $916 million Underwriting $1.06 billion $1.98 billion Institutional Client Services FICC $1.31 billion Equities $1.79 billion $3.10 billion Investing & Lending $1.86 billion Investment Management $1.70 billion
2
Goldman Sachs Reports: Third Quarter 2018 Earnings Results
|
|

| Net revenues were $8.65 billion for the third quarter of 2018, 4% higher than the third quarter of 2017 and 8% lower than the second quarter of 2018. The increase compared with the third quarter of 2017 reflected higher net revenues in Investment Banking and Investment Management.
|
| |||
|
| ||||
| Net revenues in Investment Banking were $1.98 billion for the third quarter of 2018, 10% higher than the third quarter of 2017 and 3% lower than the second quarter of 2018.
Net revenues in Financial Advisory were $916 million, essentially unchanged compared with a strong third quarter of 2017.
Net revenues in Underwriting were $1.06 billion, 20% higher than the third quarter of 2017, reflecting significantly higher net revenues in equity underwriting, driven by initial public offerings. This increase was partially offset by lower net revenues in debt underwriting, reflecting a decline in investment-grade activity.
The firm’s investment banking transaction backlog (3) was lower compared with the end of the second quarter of 2018, but was higher compared with the end of 2017.
|
| |||
|
| ||||
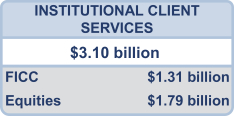
| Net revenues in Institutional Client Services were $3.10 billion for the third quarter of 2018, essentially unchanged compared with the third quarter of 2017 and 13% lower than the second quarter of 2018.
Net revenues in Fixed Income, Currency and Commodities (FICC) Client Execution were $1.31 billion, 10% lower than the third quarter of 2017, due to significantly lower net revenues in interest rate products and lower net revenues in credit products and mortgages, partially offset by higher net revenues in commodities and currencies. During the quarter, FICC Client Execution operated in an environment characterized by low client activity amid low levels of volatility.
Net revenues in Equities were $1.79 billion, 8% higher than the third quarter of 2017, primarily due to higher net revenues in equities client execution, reflecting significantly higher net revenues in derivatives, partially offset by lower net revenues in cash products. In addition, net revenues in securities services were higher, reflecting higher average customer balances, and commissions and fees were essentially unchanged. During the quarter, Equities operated in an environment generally characterized by continued low levels of volatility and lower client activity compared with the second quarter of 2018. |
| |||


Net Revenues NET REVENUES $8.65 billion Investment Banking INVESTMENT BANKING $1.98 billion Financial Advisory $916 million Underwriting $1.06 billion Institutional Client Sevices INSTITUTIONAL CLIENT SERVICES $3.10 billion FICC $1.31 billion Equities $1.79 billion
3
Goldman Sachs Reports: Third Quarter 2018 Earnings Results

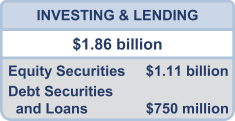
| Net revenues in Investing & Lending were $1.86 billion for the third quarter of 2018, essentially unchanged compared with the third quarter of 2017 and 4% lower than the second quarter of 2018.
Net revenues in equity securities were $1.11 billion, 20% lower than the third quarter of 2017, due to significantly lower results from investments in public equities. |
| |||
|
Net revenues in debt securities and loans were $750 million, 52% higher than the third quarter of 2017, primarily driven by significantly higher net interest income. The third quarter of 2018 included net interest income of approximately $700 million compared with approximately $450 million in the third quarter of 2017. The provision for losses on loans and lending commitments for the third quarter of 2018 was $174 million compared with $64 million for the third quarter of 2017. |
||||

| ||||
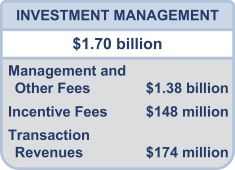
| Net revenues in Investment Management were $1.70 billion for the third quarter of 2018, 12% higher than the third quarter of 2017 and 8% lower than the second quarter of 2018.
The increase in net revenues compared with the third quarter of 2017 was primarily due to higher management and other fees, reflecting higher average assets under supervision and the impact of the recently adopted revenue recognition standard (5), partially offset by shifts in the mix of client assets and strategies. In addition, incentive fees were higher.
During the quarter, total assets under supervision (3) increased $37 billion to $1.55 trillion. Long-term assets under supervision increased $29 billion, due to net market appreciation of $16 billion and net inflows of $13 billion, both primarily in equity assets. Liquidity products increased $8 billion. |
| |||
Investing & Lending INVESTING & LENDING $1.86 billion Equity
Securities $1.11 billion Debt Securities and Loans $750 million
Investment Management INVESTMENT MANAGEMENT $1.70 billion Management and Other Fees $1.38 billion Incentive
Fees $148 million Transaction Revenues $174 million
4
Goldman Sachs Reports: Third Quarter 2018 Earnings Results

| Operating expenses were $5.57 billion for the third quarter of 2018, 4% higher than the third quarter of 2017 and 9% lower than the second quarter of 2018. The increase compared with the third quarter of 2017 was due to higher non-compensation expenses, partially offset by slightly lower compensation and benefits expenses.
|
| |||

| ||||
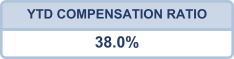
| The accrual for compensation and benefits expenses (including salaries, estimated year-end discretionary compensation, amortization of equity awards and other items such as benefits) was $3.09 billion for the third quarter of 2018, 3% lower than the third quarter of 2017. The ratio of compensation and benefits to net revenues for the first nine months of 2018 was 38.0%, compared with 40.0% for the first nine months of 2017. This ratio was 39.0% for the first half of 2018. Total staff increased 5% during the third quarter of 2018, primarily reflecting the timing of campus hires.
|
| |||

| ||||
|
Non-compensation expenses were $2.48 billion for the third quarter of 2018, 14% higher than the third quarter of 2017 and 7% lower than the second quarter of 2018. The increase compared with the third quarter of 2017 primarily reflected higher net provisions for litigation and regulatory proceedings and higher expenses related to consolidated investments and the firm’s digital lending and deposit platform, with the increases primarily in market development expenses, depreciation and amortization expenses and other expenses. In addition, technology expenses were higher, reflecting higher expenses related to computing services. The increase in non-compensation expenses compared with the third quarter of 2017 also included approximately $85 million related to the recently adopted revenue recognition standard (5).
|
| |||
| Net provisions for litigation and regulatory proceedings for the third quarter of 2018 were $136 million compared with $18 million for the third quarter of 2017.
|
||||

| ||||
| The effective income tax rate for the first nine months of 2018 decreased to 19.0% from 19.4% for the first half of 2018, reflecting the impact of permanent tax benefits and changes in the earnings mix, partially offset by a decrease in the impact of tax benefits from the settlement of employee share-based awards in the first nine months of 2018 compared with the first half of 2018. Expenses OPERATING EXPENSES $5.57 billion Compensation and Benefits YTD COMPENSATION RATIO 38.0% Non-Compensation Expenses NON-COMPENSATION EXPENSES $2.48 billion Provision for Taxes YTD EFFECTIVE TAX RATE 19.0% |
| |||

5
Goldman Sachs Reports: Third Quarter 2018 Earnings Results
|
| ||||

|
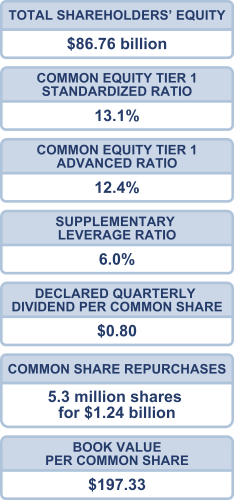
◾ Total shareholders’ equity was $86.76 billion (common shareholders’ equity of $75.56 billion and preferred stock of $11.20 billion) as of September 30, 2018.
◾ The firm’s Standardized common equity tier 1 ratio (3) was 13.1% (4) and 12.6% as of September 30, 2018 and June 30, 2018, respectively.
◾ The firm’s Basel III Advanced common equity tier 1 ratio (3) was 12.4% (4) and 11.5% as of September 30, 2018 and June 30, 2018, respectively.
◾ The firm’s supplementary leverage ratio (3) was 6.0% (4) and 5.8% as of September 30, 2018 and June 30, 2018, respectively.
◾ On October 15, 2018, the Board of Directors of The Goldman Sachs Group, Inc. declared a dividend of $0.80 per common share to be paid on December 28, 2018 to common shareholders of record on November 30, 2018.
◾ During the quarter, the firm repurchased 5.3 million shares of common stock at an average cost per share of $234.93, for a total cost of $1.24 billion. (3)
◾ Book value per common share was $197.33 and tangible book value per common share (1) was $186.62, both based on basic shares (6) of 382.9 million as of September 30, 2018. |
| |||
|
| ||||

|
◾ Total assets were $958 billion (4) as of September 30, 2018, compared with $969 billion as of June 30, 2018.
◾ The firm’s global core liquid assets (3) averaged $238 billion (4) for the third quarter of 2018, compared with an average of $237 billion for the second quarter of 2018. |
| |||
|
◾ During the quarter, the firm retired $4.1 billion in principal of unsecured debt, which resulted in a gain of $160 million, included in net revenues within Institutional Client Services and Investing & Lending. |
Capital TOTAL SHAREHOLDERS' EQUITY $86.76 billion COMMON EQUITY TIER 1 STANDARDIZED RATIO 13.1% COMMON EQUITY TIER 1 ADVANCED RATIO 12.4% SUPPLEMENTARY LEVERAGE RATIO 6.0% DECLARED QUARTERLY DIVIDEND PER COMMON SHARE $0.80 COMMON SHARE REPURCHASES 5.3 million shares for $1.24 billion BOOK VALUE PER COMMON SHARE $197.33 Other Balance Sheet and Liquidity Metrics TOTAL ASSETS $958 billion AVERAGE GCLA $238 billion
6
Goldman Sachs Reports: Third Quarter 2018 Earnings Results
The Goldman Sachs Group, Inc. is a leading global investment banking, securities and investment management firm that provides a wide range of financial services to a substantial and diversified client base that includes corporations, financial institutions, governments and individuals. Founded in 1869, the firm is headquartered in New York and maintains offices in all major financial centers around the world.

This press release contains “forward-looking statements” within the meaning of the safe harbor provisions of the U.S. Private Securities Litigation Reform Act of 1995. Forward-looking statements are not historical facts, but instead represent only the firm’s beliefs regarding future events, many of which, by their nature, are inherently uncertain and outside of the firm’s control. It is possible that the firm’s actual results and financial condition may differ, possibly materially, from the anticipated results and financial condition indicated in these forward-looking statements. For a discussion of some of the risks and important factors that could affect the firm’s future results and financial condition, see “Risk Factors” in Part I, Item 1A of the firm’s Annual Report on Form 10-K for the year ended December 31, 2017.
Information regarding the impact of the Tax Cuts and Jobs Act (Tax Legislation), the firm’s capital ratios, risk-weighted assets, supplementary leverage ratio, total assets and balance sheet data, global core liquid assets and VaR consists of preliminary estimates. These estimates are forward-looking statements and are subject to change, possibly materially, as the firm completes its financial statements. Information regarding the impact of Tax Legislation is based on the firm’s current calculations, as well as the firm’s current interpretations, assumptions and expectations relating to Tax Legislation, which are subject to further guidance and change.
Statements about the firm’s investment banking transaction backlog also may constitute forward-looking statements. Such statements are subject to the risk that the terms of these transactions may be modified or that they may not be completed at all; therefore, the net revenues, if any, that the firm actually earns from these transactions may differ, possibly materially, from those currently expected. Important factors that could result in a modification of the terms of a transaction or a transaction not being completed include, in the case of underwriting transactions, a decline or continued weakness in general economic conditions, outbreak of hostilities, volatility in the securities markets generally or an adverse development with respect to the issuer of the securities and, in the case of financial advisory transactions, a decline in the securities markets, an inability to obtain adequate financing, an adverse development with respect to a party to the transaction or a failure to obtain a required regulatory approval. For a discussion of other important factors that could adversely affect the firm’s investment banking transactions, see “Risk Factors” in Part I, Item 1A of the firm’s Annual Report on Form 10-K for the year ended December 31, 2017.

A conference call to discuss the firm’s financial results, outlook and related matters will be held at 9:30 am (ET). The call will be open to the public. Members of the public who would like to listen to the conference call should dial 1-888-281-
7154 (in the U.S.) or 1-706-679-5627 (outside the U.S.). The number should be dialed at least 10 minutes prior to the start of the conference call. The conference call will also be accessible as an audio webcast through the Investor Relations section of the firm’s website, www.goldmansachs.com/investor-relations. There is no charge to access the call. For those unable to listen to the live broadcast, a replay will be available on the firm’s website or by dialing 1-855- 859-2056 (in the U.S.) or 1-404-537-3406 (outside the U.S.) passcode number 64774224 beginning approximately three hours after the event. Please direct any questions regarding obtaining access to the conference call to Goldman Sachs Investor Relations, via e-mail, at gs-investor-relations@gs.com.
Cautionary Note Regarding Forward-Looking Statements
Conference Call
7
Goldman Sachs Reports: Third Quarter 2018 Earnings Results
The Goldman Sachs Group, Inc. and Subsidiaries
Segment Net Revenues (unaudited)
$ in millions
| THREE MONTHS ENDED | % CHANGE FROM | |||||||||||||||||||||||
|
SEPTEMBER 30, |
JUNE 30,
|
SEPTEMBER 30, |
JUNE 30, |
SEPTEMBER 30, |
||||||||||||||||||||
|
INVESTMENT BANKING
|
||||||||||||||||||||||||
|
Financial Advisory |
$ 916 | $ 804 | $ 911 | 14 % | 1 % | |||||||||||||||||||
|
|
||||||||||||||||||||||||
| Equity underwriting |
432 | 489 | 212 | (12) | 104 | |||||||||||||||||||
|
Debt underwriting |
632 | 752 | 674 | (16) | (6) | |||||||||||||||||||
|
Total Underwriting
|
|
1,064
|
|
|
1,241
|
|
|
886
|
|
|
(14)
|
|
|
20
|
| |||||||||
|
|
||||||||||||||||||||||||
|
Total Investment Banking
|
|
1,980
|
|
|
2,045
|
|
|
1,797
|
|
|
(3)
|
|
|
10
|
| |||||||||
|
|
||||||||||||||||||||||||
|
INSTITUTIONAL CLIENT SERVICES
|
||||||||||||||||||||||||
|
FICC Client Execution |
1,307 | 1,679 | 1,452 | (22) | (10) | |||||||||||||||||||
|
|
||||||||||||||||||||||||
| Equities client execution |
681 | 691 | 584 | (1) | 17 | |||||||||||||||||||
|
Commissions and fees |
674 | 763 | 681 | (12) | (1) | |||||||||||||||||||
|
Securities services |
439 | 437 | 403 | – | 9 | |||||||||||||||||||
|
Total Equities
|
|
1,794
|
|
|
1,891
|
|
|
1,668
|
|
|
(5)
|
|
|
8
|
| |||||||||
|
|
||||||||||||||||||||||||
|
Total Institutional Client Services
|
|
3,101
|
|
|
3,570
|
|
|
3,120
|
|
|
(13)
|
|
|
(1)
|
| |||||||||
|
INVESTING & LENDING
|
||||||||||||||||||||||||
|
Equity securities |
1,111 | 1,281 | 1,391 | (13) | (20) | |||||||||||||||||||
|
Debt securities and loans |
750 | 663 | 492 | 13 | 52 | |||||||||||||||||||
|
Total Investing & Lending
|
|
1,861
|
|
|
1,944
|
|
|
1,883
|
|
|
(4)
|
|
|
(1)
|
| |||||||||
|
|
||||||||||||||||||||||||
|
INVESTMENT MANAGEMENT
|
||||||||||||||||||||||||
|
Management and other fees |
1,382 | 1,345 | 1,272 | 3 | 9 | |||||||||||||||||||
|
Incentive fees |
148 | 316 | 86 | (53) | 72 | |||||||||||||||||||
|
Transaction revenues |
174 | 182 | 168 | (4) | 4 | |||||||||||||||||||
|
Total Investment Management
|
|
1,704
|
|
|
1,843
|
|
|
1,526
|
|
|
(8)
|
|
|
12
|
| |||||||||
|
|
||||||||||||||||||||||||
|
Total net revenues
|
|
$ 8,646
|
|
|
$ 9,402
|
|
|
$ 8,326
|
|
|
(8)
|
|
|
4
|
| |||||||||
|
Geographic Net Revenues (unaudited) (3) $ in millions
|
| |||||||||||||||||||||||
| THREE MONTHS ENDED | ||||||||||||||||||||||||
|
SEPTEMBER 30, |
JUNE 30, 2018 |
SEPTEMBER 30, |
||||||||||||||||||||||
|
Americas |
$ 5,222 | $ 5,721 | $ 4,870 | |||||||||||||||||||||
|
EMEA |
2,215 | 2,567 | 2,062 | |||||||||||||||||||||
|
Asia |
1,209 | 1,114 | 1,394 | |||||||||||||||||||||
|
Total net revenues
|
|
$ 8,646
|
|
|
$ 9,402
|
|
|
$ 8,326
|
|
|||||||||||||||
|
|
||||||||||||||||||||||||
| Americas |
60% | 61% | 58% | |||||||||||||||||||||
|
EMEA |
26% | 27% | 25% | |||||||||||||||||||||
|
Asia |
14% | 12% | 17% | |||||||||||||||||||||
|
Total
|
|
100%
|
|
|
100%
|
|
|
100%
|
|
|||||||||||||||
8
Goldman Sachs Reports: Third Quarter 2018 Earnings Results
The Goldman Sachs Group, Inc. and Subsidiaries
Segment Net Revenues (unaudited)
$ in millions
| NINE MONTHS ENDED | % CHANGE FROM | |||||||||||||||||||
|
SEPTEMBER 30, |
SEPTEMBER 30, |
SEPTEMBER 30, | ||||||||||||||||||
|
INVESTMENT BANKING
|
||||||||||||||||||||
|
Financial Advisory |
$ 2,306 | $ 2,416 | (5) % | |||||||||||||||||
|
|
||||||||||||||||||||
| Equity underwriting |
1,331 | 783 | 70 | |||||||||||||||||
|
Debt underwriting |
2,181 | 2,031 | 7 | |||||||||||||||||
|
Total Underwriting
|
|
3,512
|
|
|
2,814
|
|
|
25
|
| |||||||||||
|
|
||||||||||||||||||||
|
Total Investment Banking
|
|
5,818
|
|
|
5,230
|
|
|
11
|
| |||||||||||
|
|
||||||||||||||||||||
|
INSTITUTIONAL CLIENT SERVICES
|
||||||||||||||||||||
|
FICC Client Execution |
5,060 | 4,296 | 18 | |||||||||||||||||
|
|
||||||||||||||||||||
| Equities client execution |
2,434 | 1,823 | 34 | |||||||||||||||||
|
Commissions and fees |
2,254 | 2,183 | 3 | |||||||||||||||||
|
Securities services |
1,308 | 1,228 | 7 | |||||||||||||||||
|
Total Equities
|
|
5,996
|
|
|
5,234
|
|
|
15
|
| |||||||||||
|
|
||||||||||||||||||||
|
Total Institutional Client Services
|
|
11,056
|
|
|
9,530
|
|
|
16
|
| |||||||||||
|
|
||||||||||||||||||||
|
INVESTING & LENDING |
||||||||||||||||||||
|
Equity securities |
3,461 | 3,369 | 3 | |||||||||||||||||
|
Debt securities and loans |
2,431 | 1,554 | 56 | |||||||||||||||||
|
Total Investing & Lending
|
|
5,892
|
|
|
4,923
|
|
|
20
|
| |||||||||||
|
|
||||||||||||||||||||
|
INVESTMENT MANAGEMENT
|
||||||||||||||||||||
|
Management and other fees |
4,073 | 3,775 | 8 | |||||||||||||||||
|
Incentive fees |
677 | 288 | 135 | |||||||||||||||||
|
Transaction revenues |
568 | 493 | 15 | |||||||||||||||||
|
Total Investment Management
|
|
5,318
|
|
|
4,556
|
|
|
17
|
| |||||||||||
|
|
||||||||||||||||||||
|
Total net revenues
|
|
$ 28,084
|
|
|
$ 24,239
|
|
|
16
|
| |||||||||||
|
Geographic Net Revenues (unaudited) (3) $ in millions
|
||||||||||||||||||||
| NINE MONTHS ENDED | ||||||||||||||||||||
| SEPTEMBER 30, 2018 |
SEPTEMBER 30, 2017 |
|||||||||||||||||||
|
Americas |
$ 16,828 | $ 14,603 | ||||||||||||||||||
|
EMEA |
7,387 | 6,081 | ||||||||||||||||||
|
Asia |
3,869 | 3,555 | ||||||||||||||||||
|
Total net revenues
|
|
$ 28,084
|
|
|
$ 24,239
|
|
||||||||||||||
|
|
||||||||||||||||||||
| Americas |
60% | 60% | ||||||||||||||||||
|
EMEA |
26% | 25% | ||||||||||||||||||
|
Asia |
14% | 15% | ||||||||||||||||||
|
Total
|
|
100%
|
|
|
100%
|
|
||||||||||||||
9
Goldman Sachs Reports: Third Quarter 2018 Earnings Results
The Goldman Sachs Group, Inc. and Subsidiaries
Consolidated Statements of Earnings (unaudited)
In millions, except per share amounts and total staff
| THREE MONTHS ENDED | % CHANGE FROM | |||||||||||||||||||||||
|
SEPTEMBER 30, |
JUNE 30, |
SEPTEMBER 30, |
JUNE 30, |
SEPTEMBER 30, |
||||||||||||||||||||
|
REVENUES
|
||||||||||||||||||||||||
|
Investment banking |
$ 1,980 | $ 2,045 | $ 1,797 | (3) % | 10 % | |||||||||||||||||||
|
Investment management |
1,580 | 1,728 | 1,419 | (9) | 11 | |||||||||||||||||||
|
Commissions and fees |
704 | 795 | 714 | (11) | (1) | |||||||||||||||||||
|
Market making |
2,281 | 2,546 | 2,112 | (10) | 8 | |||||||||||||||||||
|
Other principal transactions |
1,245 | 1,286 | 1,554 | (3) | (20) | |||||||||||||||||||
|
Total non-interest revenues
|
|
7,790
|
|
|
8,400
|
|
|
7,596
|
|
|
(7)
|
|
|
3
|
| |||||||||
|
|
||||||||||||||||||||||||
|
Interest income |
5,061 | 4,920 | 3,411 | 3 | 48 | |||||||||||||||||||
|
Interest expense |
4,205 | 3,918 | 2,681 | 7 | 57 | |||||||||||||||||||
|
Net interest income
|
|
856
|
|
|
1,002
|
|
|
730
|
|
|
(15)
|
|
|
17
|
| |||||||||
|
|
||||||||||||||||||||||||
|
Net revenues, including net interest income
|
|
8,646
|
|
|
9,402
|
|
|
8,326
|
|
|
(8)
|
|
|
4
|
| |||||||||
|
|
||||||||||||||||||||||||
|
OPERATING EXPENSES
|
||||||||||||||||||||||||
|
Compensation and benefits |
3,091 | 3,466 | 3,172 | (11) | (3) | |||||||||||||||||||
|
|
||||||||||||||||||||||||
|
Brokerage, clearing, exchange and distribution fees (7) |
714 | 812 | 711 | (12) | – | |||||||||||||||||||
|
Market development |
167 | 183 | 138 | (9) | 21 | |||||||||||||||||||
|
Communications and technology |
250 | 260 | 220 | (4) | 14 | |||||||||||||||||||
|
Depreciation and amortization |
317 | 335 | 280 | (5) | 13 | |||||||||||||||||||
|
Occupancy |
203 | 197 | 177 | 3 | 15 | |||||||||||||||||||
|
Professional fees |
238 | 223 | 227 | 7 | 5 | |||||||||||||||||||
|
Other expenses (7) |
588 | 650 | 425 | (10) | 38 | |||||||||||||||||||
|
Total non-compensation expenses
|
|
2,477
|
|
|
2,660
|
|
|
2,178
|
|
|
(7)
|
|
|
14
|
| |||||||||
|
|
||||||||||||||||||||||||
|
Total operating expenses
|
|
5,568
|
|
|
6,126
|
|
|
5,350
|
|
|
(9)
|
|
|
4
|
| |||||||||
|
|
||||||||||||||||||||||||
|
Pre-tax earnings |
3,078 | 3,276 | 2,976 | (6) | 3 | |||||||||||||||||||
|
Provision for taxes |
554 | 711 | 848 | (22) | (35) | |||||||||||||||||||
|
Net earnings |
|
2,524
|
|
|
2,565
|
|
|
2,128
|
|
|
(2)
|
|
|
19
|
| |||||||||
|
Preferred stock dividends |
71 | 217 | 93 | (67) | (24) | |||||||||||||||||||
|
Net earnings applicable to common shareholders
|
|
$ 2,453
|
|
|
$ 2,348
|
|
|
$ 2,035
|
|
|
4
|
|
|
21
|
| |||||||||
|
|
||||||||||||||||||||||||
|
EARNINGS PER COMMON SHARE
|
||||||||||||||||||||||||
|
Basic (8) |
$ 6.35 | $ 6.04 | $ 5.09 | 5 % | 25 % | |||||||||||||||||||
|
Diluted |
6.28 | 5.98 | 5.02 | 5 | 25 | |||||||||||||||||||
|
|
||||||||||||||||||||||||
|
AVERAGE COMMON SHARES
|
||||||||||||||||||||||||
|
Basic |
385.4 | 387.8 | 398.2 | (1) | (3) | |||||||||||||||||||
|
Diluted |
390.5 | 392.6 | 405.7 | (1) | (4) | |||||||||||||||||||
|
|
||||||||||||||||||||||||
|
SELECTED DATA AT PERIOD-END
|
||||||||||||||||||||||||
|
Total staff (employees, consultants and temporary staff)
|
|
39,800
|
|
|
38,000
|
|
|
35,800
|
|
|
5
|
|
|
11
|
| |||||||||
10
Goldman Sachs Reports: Third Quarter 2018 Earnings Results
The Goldman Sachs Group, Inc. and Subsidiaries
Consolidated Statements of Earnings (unaudited)
In millions, except per share amounts
| NINE MONTHS ENDED | % CHANGE FROM | |||||||||||||||
|
SEPTEMBER 30, |
SEPTEMBER 30, |
SEPTEMBER 30, |
||||||||||||||
|
REVENUES
|
||||||||||||||||
|
Investment banking |
$ 5,818 | $ 5,230 | 11 % | |||||||||||||
|
Investment management |
4,947 | 4,249 | 16 | |||||||||||||
|
Commissions and fees |
2,361 | 2,279 | 4 | |||||||||||||
|
Market making |
8,031 | 6,445 | 25 | |||||||||||||
|
Other principal transactions |
4,151 | 4,002 | 4 | |||||||||||||
|
Total non-interest revenues
|
|
25,308
|
|
|
22,205
|
|
|
14
|
| |||||||
|
|
||||||||||||||||
|
Interest income |
14,211 | 9,377 | 52 | |||||||||||||
|
Interest expense |
11,435 | 7,343 | 56 | |||||||||||||
|
Net interest income
|
|
2,776
|
|
|
2,034
|
|
|
36
|
| |||||||
|
|
||||||||||||||||
|
Net revenues, including net interest income
|
|
28,084
|
|
|
24,239
|
|
|
16
|
| |||||||
|
|
||||||||||||||||
|
OPERATING EXPENSES
|
||||||||||||||||
|
Compensation and benefits |
10,672 | 9,696 | 10 | |||||||||||||
|
|
||||||||||||||||
|
Brokerage, clearing, exchange and distribution fees (7) |
2,370 | 2,144 | 11 | |||||||||||||
|
Market development |
532 | 413 | 29 | |||||||||||||
|
Communications and technology |
761 | 667 | 14 | |||||||||||||
|
Depreciation and amortization |
951 | 802 | 19 | |||||||||||||
|
Occupancy |
594 | 543 | 9 | |||||||||||||
|
Professional fees |
696 | 661 | 5 | |||||||||||||
|
Other expenses (7) |
1,735 | 1,289 | 35 | |||||||||||||
|
Total non-compensation expenses
|
|
7,639
|
|
|
6,519
|
|
|
17
|
| |||||||
|
|
||||||||||||||||
|
Total operating expenses
|
|
18,311
|
|
|
16,215
|
|
|
13
|
| |||||||
|
|
||||||||||||||||
|
Pre-tax earnings |
9,773 | 8,024 | 22 | |||||||||||||
|
Provision for taxes |
1,852 | 1,810 | 2 | |||||||||||||
|
Net earnings |
|
7,921
|
|
|
6,214
|
|
|
27
|
| |||||||
|
Preferred stock dividends |
383 | 386 | (1) | |||||||||||||
|
Net earnings applicable to common shareholders
|
|
$ 7,538
|
|
|
$ 5,828
|
|
|
29
|
| |||||||
|
|
||||||||||||||||
|
EARNINGS PER COMMON SHARE
|
||||||||||||||||
|
Basic (8) |
$ 19.42 | $ 14.32 | 36 % | |||||||||||||
|
Diluted |
19.21 | 14.11 | 36 | |||||||||||||
|
|
||||||||||||||||
|
AVERAGE COMMON SHARES
|
||||||||||||||||
|
Basic |
387.4 | 405.6 | (4) | |||||||||||||
|
Diluted
|
|
392.3
|
|
|
413.0
|
|
|
(5)
|
| |||||||
11
Goldman Sachs Reports: Third Quarter 2018 Earnings Results
The Goldman Sachs Group, Inc. and Subsidiaries
Condensed Consolidated Statements of Financial Condition (unaudited) (4)
$ in billions
| AS OF | ||||||||||
|
SEPTEMBER 30, |
JUNE 30, |
|||||||||
|
ASSETS
|
||||||||||
|
Cash and cash equivalents |
|
$ 119
|
|
|
$ 131
|
|
||||
|
Collateralized agreements |
|
300
|
|
|
298
|
|
||||
|
Receivables |
|
159
|
|
|
163
|
|
||||
|
Financial instruments owned |
|
351
|
|
|
348
|
|
||||
|
Other |
|
29
|
|
|
29
|
|
||||
|
Total assets
|
|
958
|
|
|
969
|
|
||||
|
LIABILITIES AND SHAREHOLDERS’ EQUITY
|
||||||||||
|
Deposits |
|
152
|
|
|
153
|
|
||||
|
Collateralized financings |
|
130
|
|
|
136
|
|
||||
|
Payables |
|
190
|
|
|
193
|
|
||||
|
Financial instruments sold, but not yet purchased |
|
113
|
|
|
113
|
|
||||
|
Unsecured short-term borrowings |
|
42
|
|
|
44
|
|
||||
|
Unsecured long-term borrowings |
|
229
|
|
|
227
|
|
||||
|
Other |
15 | 16 | ||||||||
|
Total liabilities
|
|
871
|
|
|
882
|
|
||||
|
Shareholders’ equity |
87 | 87 | ||||||||
|
Total liabilities and shareholders’ equity
|
|
$ 958
|
|
|
$ 969
|
|
||||
|
Capital Ratios (unaudited) (3) (4) $ in billions
|
|
|||||||||
| AS OF | ||||||||||
|
SEPTEMBER 30, 2018 |
JUNE 30, 2018 |
|||||||||
|
Common equity tier 1
|
$ 71.8 | $ 70.7 | ||||||||
|
STANDARDIZED CAPITAL RULES
|
||||||||||
|
Risk-weighted assets
|
$ 546 | $ 561 | ||||||||
|
Common equity tier 1 ratio |
13.1% | 12.6% | ||||||||
|
BASEL III ADVANCED CAPITAL RULES
|
||||||||||
|
Risk-weighted assets
|
$ 577 | $ 614 | ||||||||
| Common equity tier 1 ratio
|
|
12.4%
|
|
|
11.5%
|
|
||||
|
Average Daily VaR (unaudited) (3) (4) $ in millions
|
|
|||||||||
| THREE MONTHS ENDED | ||||||||||
|
SEPTEMBER 30, 2018 |
JUNE 30, |
|||||||||
|
RISK CATEGORIES
|
||||||||||
|
Interest rates
|
|
$ 41
|
|
|
$ 48
|
|
||||
| Equity prices
|
|
28
|
|
|
33
|
|
||||
| Currency rates
|
|
15
|
|
|
14
|
|
||||
| Commodity prices
|
|
10
|
|
|
13
|
|
||||
| Diversification effect |
|
(41)
|
|
|
(44)
|
|
||||
|
Total
|
|
$ 53
|
|
|
$ 64
|
|
||||
12
Goldman Sachs Reports: Third Quarter 2018 Earnings Results
The Goldman Sachs Group, Inc. and Subsidiaries
Assets Under Supervision (unaudited) (3)
$ in billions
| AS OF | % CHANGE FROM | |||||||||||||||||||||
|
SEPTEMBER 30, |
JUNE 30, 2018 |
SEPTEMBER 30, |
JUNE 30, |
SEPTEMBER 30, |
||||||||||||||||||
|
ASSET CLASS |
||||||||||||||||||||||
|
Alternative investments
|
|
$ 175
|
|
|
$ 171
|
|
|
$ 169
|
|
|
2 %
|
|
|
4 %
|
| |||||||
| Equity
|
|
349
|
|
|
329
|
|
|
305
|
|
|
6
|
|
|
14
|
| |||||||
| Fixed income
|
|
668
|
|
|
663
|
|
|
654
|
|
|
1
|
|
|
2
|
| |||||||
|
Total long-term AUS |
1,192 | 1,163 | 1,128 | 2 | 6 | |||||||||||||||||
|
Liquidity products |
|
358 |
|
|
350 |
|
|
328 |
|
|
2 |
|
|
9 |
| |||||||
|
Total AUS
|
|
$ 1,550
|
|
|
$ 1,513
|
|
|
$ 1,456
|
|
|
2
|
|
|
6
|
| |||||||
| THREE MONTHS ENDED | ||||||||||||||||||||||
|
SEPTEMBER 30, |
JUNE 30, 2018 |
SEPTEMBER 30, |
||||||||||||||||||||
|
Beginning balance
|
|
$ 1,513
|
|
|
$ 1,498
|
|
|
$ 1,406
|
|
|||||||||||||
| Net inflows / (outflows)
|
||||||||||||||||||||||
| Alternative investments
|
|
3
|
|
|
3
|
|
|
2
|
|
|||||||||||||
| Equity
|
|
7
|
|
|
2
|
|
|
(1)
|
|
|||||||||||||
| Fixed income
|
|
3
|
|
|
3
|
|
|
12
|
|
|||||||||||||
|
Total long-term AUS net inflows / (outflows) |
13 | 8 | 13 | |||||||||||||||||||
|
Liquidity products |
|
8 |
|
|
10 |
|
|
14 |
|
|||||||||||||
|
Total AUS net inflows / (outflows) |
|
21 |
|
|
18 |
|
|
27 |
|
|||||||||||||
|
Net market appreciation / (depreciation) |
|
16 |
|
|
(3) |
|
|
23 |
|
|||||||||||||
|
Ending balance
|
|
$ 1,550
|
|
|
$ 1,513
|
|
|
$ 1,456
|
|
|||||||||||||
13
Goldman Sachs Reports: Third Quarter 2018 Earnings Results
Footnotes
| (1) | Annualized ROE is calculated by dividing annualized net earnings applicable to common shareholders by average monthly common shareholders’ equity. Tangible common shareholders’ equity is calculated as total shareholders’ equity less preferred stock, goodwill and identifiable intangible assets. Annualized ROTE is calculated by dividing annualized net earnings applicable to common shareholders by average monthly tangible common shareholders’ equity. Tangible book value per common share is calculated by dividing tangible common shareholders’ equity by basic shares. Management believes that tangible common shareholders’ equity and tangible book value per common share are meaningful because they are measures that the firm and investors use to assess capital adequacy and that ROTE is meaningful because it measures the performance of businesses consistently, whether they were acquired or developed internally. Tangible common shareholders’ equity, ROTE and tangible book value per common share are non-GAAP measures and may not be comparable to similar non-GAAP measures used by other companies. |
The table below presents the firm’s average common shareholders’ equity and a reconciliation of total shareholders’ equity to tangible common shareholders’ equity (unaudited, $ in millions):
|
AVERAGE FOR THE |
|||||||||||||||||
|
THREE MONTHS ENDED SEPTEMBER 30, 2018 |
NINE MONTHS ENDED SEPTEMBER 30, 2018 |
AS OF SEPTEMBER 30, 2018 | |||||||||||||||
|
Total shareholders’ equity |
$ 86,248 | $ 84,382 | $ 86,762 | ||||||||||||||
|
Preferred stock |
(11,203) | (11,268) | (11,203) | ||||||||||||||
|
Common shareholders’ equity
|
|
75,045
|
|
|
73,114
|
|
|
75,559
|
| ||||||||
|
Goodwill and identifiable intangible assets |
(4,105) | (4,090) | (4,101) | ||||||||||||||
|
Tangible common shareholders’ equity
|
|
$ 70,940
|
|
|
$
69,024
|
|
|
$ 71,458
|
| ||||||||
| (2) | Dealogic – January 1, 2018 through September 30, 2018. |
| (3) | For information about the firm’s investment banking transaction backlog, assets under supervision, share repurchase program, global core liquid assets and VaR, see “Results of Operations – Investment Banking,” “Results of Operations – Investment Management,” “Equity Capital Management and Regulatory Capital – Equity Capital Management,” “Risk Management – Liquidity Risk Management” and “Risk Management – Market Risk Management,” respectively, in Part I, Item 2 “Management’s Discussion and Analysis of Financial Condition and Results of Operations” in the firm’s Quarterly Report on Form 10-Q for the period ended June 30, 2018. For information about the firm’s risk-based capital ratios and supplementary leverage ratio and geographic net revenues, see Note 20 “Regulation and Capital Adequacy” and Note 25 “Business Segments,” respectively, in Part 1, Item 1 “Financial Statements (Unaudited)” in the firm’s Quarterly Report on Form 10-Q for the period ended June 30, 2018. |
| (4) | Represents a preliminary estimate and may be revised in the firm’s Quarterly Report on Form 10-Q for the period ended September 30, 2018. |
| (5) | In the first quarter of 2018, the firm adopted ASU No. 2014-09, “Revenue from Contracts with Customers (Topic 606),” which required a change in the presentation of certain costs from a net presentation within revenues to a gross basis and vice versa. For information about ASU No. 2014-09, see Note 3 “Significant Accounting Policies” in Part I, Item 1 “Financial Statements (Unaudited)” in the firm’s Quarterly Report on Form 10-Q for the period ended June 30, 2018. |
| (6) | Basic shares include common shares outstanding and restricted stock units granted to employees with no future service requirements. |
| (7) | Regulatory-related fees that are paid to exchanges, reported in other expenses prior to 2018, are now reported in brokerage, clearing, exchange and distribution fees. Reclassifications have been made to previously reported amounts to conform to the current presentation. |
| (8) | Unvested share-based awards that have non-forfeitable rights to dividends or dividend equivalents are treated as a separate class of securities in calculating earnings per common share. The impact of applying this methodology was a reduction in basic earnings per common share of $0.01, $0.01 and $0.02 for the three months ended September 30, 2018, June 30, 2018 and September 30, 2017, respectively, and $0.04 and $0.05 for the nine months ended September 30, 2018 and September 30, 2017, respectively. |
14