Attached files
| file | filename |
|---|---|
| EX-99.1 - EX-99.1 - EQUITY BANCSHARES INC | eqbk-ex991_7.htm |
| 8-K - 8-K - EQUITY BANCSHARES INC | eqbk-8k_20181016.htm |
Q3 2018 Results Presentation October 16, 2018 Exhibit 99.2
Disclaimers Special Note Concerning Forward-Looking Statements This investor presentation contains “forward-looking statements within the meaning of Section 27A of the Securities Act of 1933, as amended, and Section 21E of the Securities Exchange Act of 1934, as amended. These forward-looking statements reflect the current views of Equity Bancshares, Inc. (“Equity”) management with respect to, among other things, future events and Equity’s financial performance. These statements are often, but not always, made through the use of words or phrases such as “may,” “should,” “could,” “predict,” “potential,” “believe,” “will likely result,” “expect,” “continue,” “will,” “anticipate,” “seek,” “estimate,” “intend,” “plan,” “project,” “forecast,” “goal,” “target,” “would” and “outlook,” or the negative variations of those words or other comparable words of a future or forward-looking nature. These forward-looking statements are not historical facts, and are based on current expectations, estimates and projections about Equity’s industry, management’s beliefs and certain assumptions made by management, many of which, by their nature, are inherently uncertain and beyond Equity’s control. Accordingly, Equity cautions you that any such forward-looking statements are not guarantees of future performance and are subject to risks, assumptions and uncertainties that are difficult to predict. Although Equity believes that the expectations reflected in these forward-looking statements are reasonable as of the date made, actual results may prove to be materially different from the results expressed or implied by the forward-looking statements. Factors that could cause actual results to differ materially from Equity’s expectations include competition from other financial institutions and bank holding companies; the effects of and changes in trade, monetary and fiscal policies and laws, including interest rate policies of the Federal Reserve Board; changes in the demand for loans; fluctuations in value of collateral and loan reserves; inflation, interest rate, market and monetary fluctuations; changes in consumer spending, borrowing and savings habits; and acquisitions and integration of acquired businesses, and similar variables. The foregoing list of factors is not exhaustive. For discussion of these and other risks that may cause actual results to differ from expectations, please refer to “Cautionary Note Regarding Forward-Looking Statements” and “Risk Factors” in Equity’s Annual Report on Form 10-K filed with the Securities and Exchange Commission on March 16, 2018 and any updates to those risk factors set forth in Equity’s subsequent Quarterly Reports on Form 10-Q or Current Reports on Form 8-K. If one or more events related to these or other risks or uncertainties materialize, or if Equity’s underlying assumptions prove to be incorrect, actual results may differ materially from what Equity anticipates. Accordingly, you should not place undue reliance on any such forward-looking statements. Any forward-looking statement speaks only as of the date on which it is made, and Equity does not undertake any obligation to publicly update or review any forward-looking statement, whether as a result of new information, future developments or otherwise. New risks and uncertainties arise from time to time, and it is not possible for us to predict those events or how they may affect us. In addition, Equity cannot assess the impact of each factor on Equity’s business or the extent to which any factor, or combination of factors, may cause actual results to differ materially from those contained in any forward-looking statements. All forward-looking statements, expressed or implied, included in this press release are expressly qualified in their entirety by this cautionary statement. This cautionary statement should also be considered in connection with any subsequent written or oral forward-looking statements that Equity or persons acting on Equity’s behalf may issue. Annualized, pro forma, projected and estimated numbers are used for illustrative purpose only, are not forecasts and may not reflect actual results. NON-GAAP FINANCIAL MEASURES This presentation contains certain non-GAAP financial measures intended to supplement, not substitute for, comparable GAAP measures. Reconciliations of non-GAAP financial measures to GAAP financial measures are provided at the end of this presentation. Numbers in the presentation may not sum due to rounding.
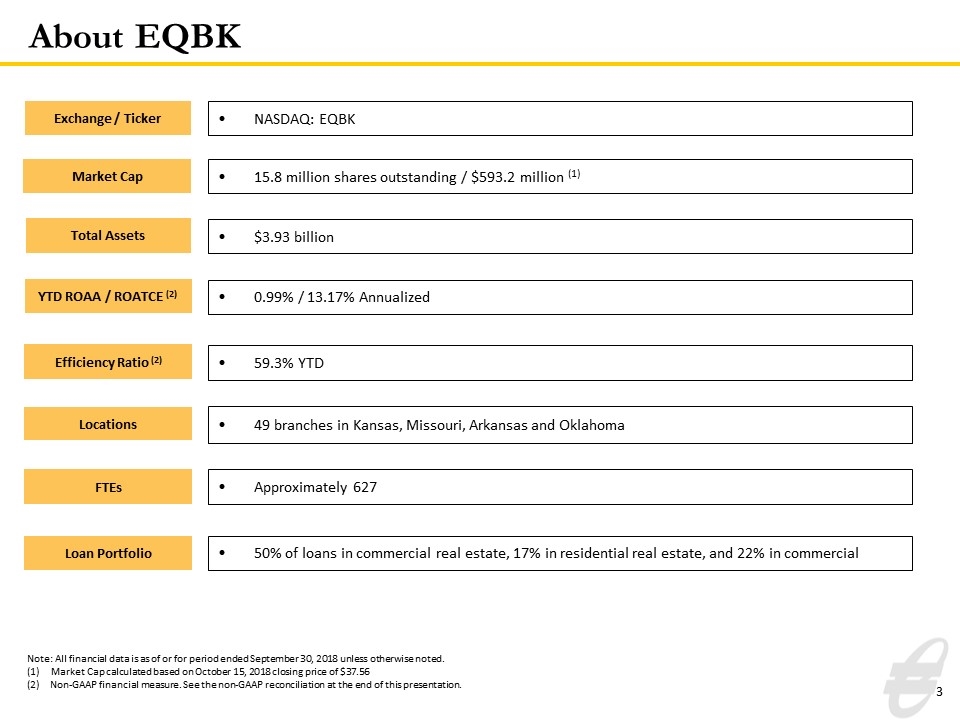
NASDAQ: EQBK 15.8 million shares outstanding / $593.2 million (1) $3.93 billion 0.99% / 13.17% Annualized Market Cap 59.3% YTD Exchange / Ticker Total Assets YTD ROAA / ROATCE (2) Efficiency Ratio (2) Locations FTEs Loan Portfolio 49 branches in Kansas, Missouri, Arkansas and Oklahoma Approximately 627 50% of loans in commercial real estate, 17% in residential real estate, and 22% in commercial About EQBK Note: All financial data is as of or for period ended September 30, 2018 unless otherwise noted. Market Cap calculated based on October 15, 2018 closing price of $37.56 (2) Non-GAAP financial measure. See the non-GAAP reconciliation at the end of this presentation.
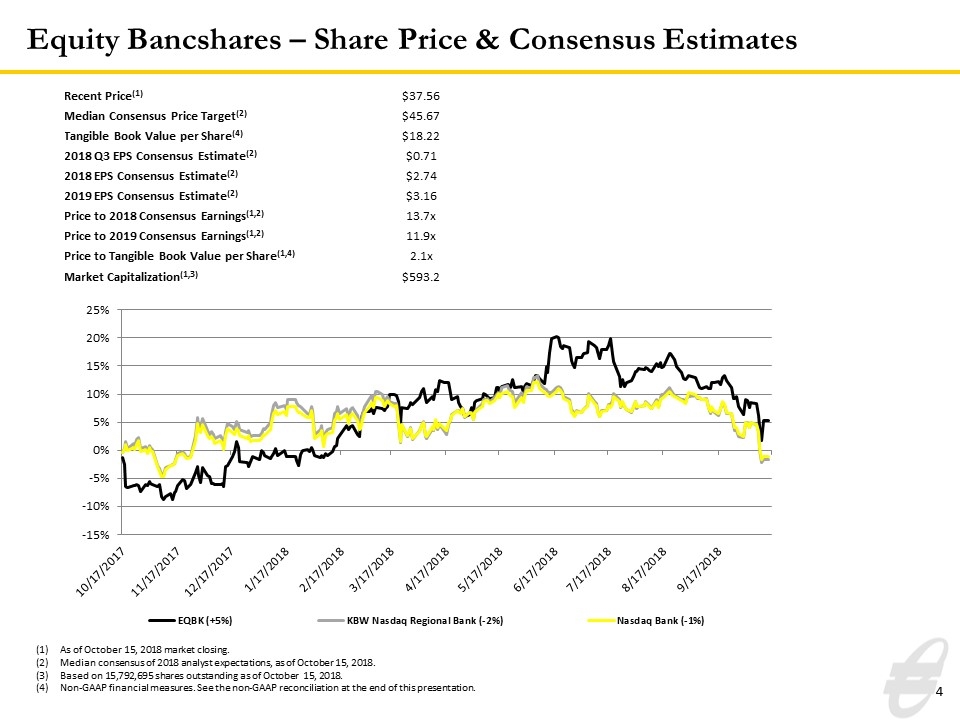
Equity Bancshares – Share Price & Consensus Estimates As of October 15, 2018 market closing. Median consensus of 2018 analyst expectations, as of October 15, 2018. Based on 15,792,695 shares outstanding as of October 15, 2018. Non-GAAP financial measures. See the non-GAAP reconciliation at the end of this presentation. Recent Price(1) $37.56 Median Consensus Price Target(2) $45.67 Tangible Book Value per Share(4) $18.22 2018 Q3 EPS Consensus Estimate(2) $0.71 2018 EPS Consensus Estimate(2) $2.74 2019 EPS Consensus Estimate(2) $3.16 Price to 2018 Consensus Earnings(1,2) 13.7x Price to 2019 Consensus Earnings(1,2) 11.9x Price to Tangible Book Value per Share(1,4) 2.1x Market Capitalization(1,3) $593.2
Pending Acquisition of Three Branches in Guymon and Cordell, Oklahoma from MidFirst Bank Announced: September 24, 2018
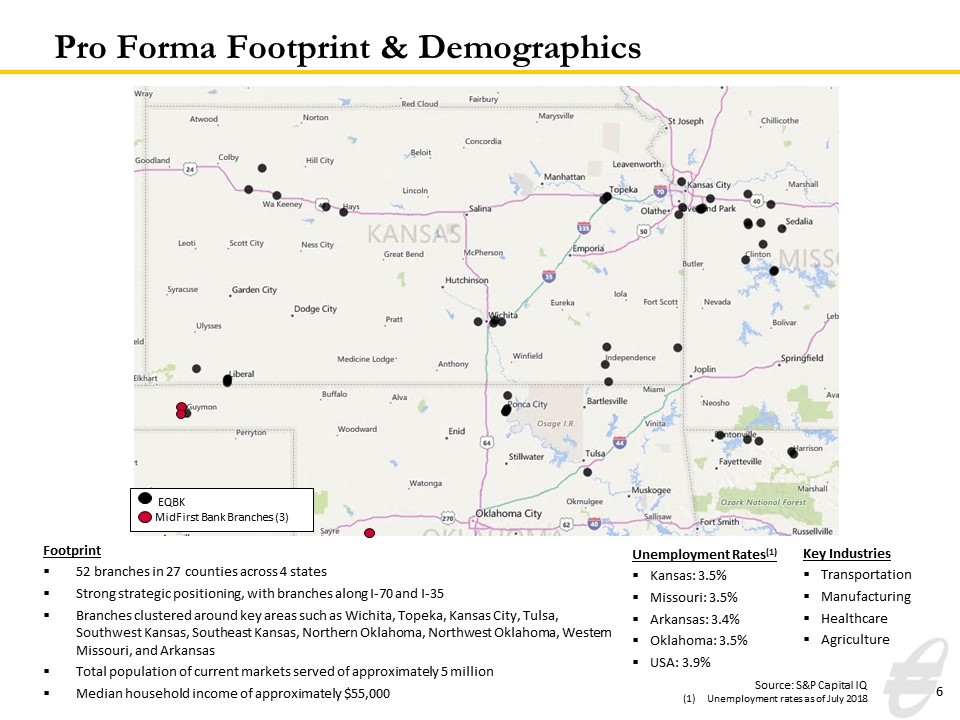
Pro Forma Footprint & Demographics EQBK MidFirst Bank Branches (3) Footprint 52 branches in 27 counties across 4 states Strong strategic positioning, with branches along I-70 and I-35 Branches clustered around key areas such as Wichita, Topeka, Kansas City, Tulsa, Southwest Kansas, Southeast Kansas, Northern Oklahoma, Northwest Oklahoma, Western Missouri, and Arkansas Total population of current markets served of approximately 5 million Median household income of approximately $55,000 Source: S&P Capital IQ Unemployment rates as of July 2018 Unemployment Rates(1) Kansas: 3.5% Missouri: 3.5% Arkansas: 3.4% Oklahoma: 3.5% USA: 3.9% Key Industries Transportation Manufacturing Healthcare Agriculture
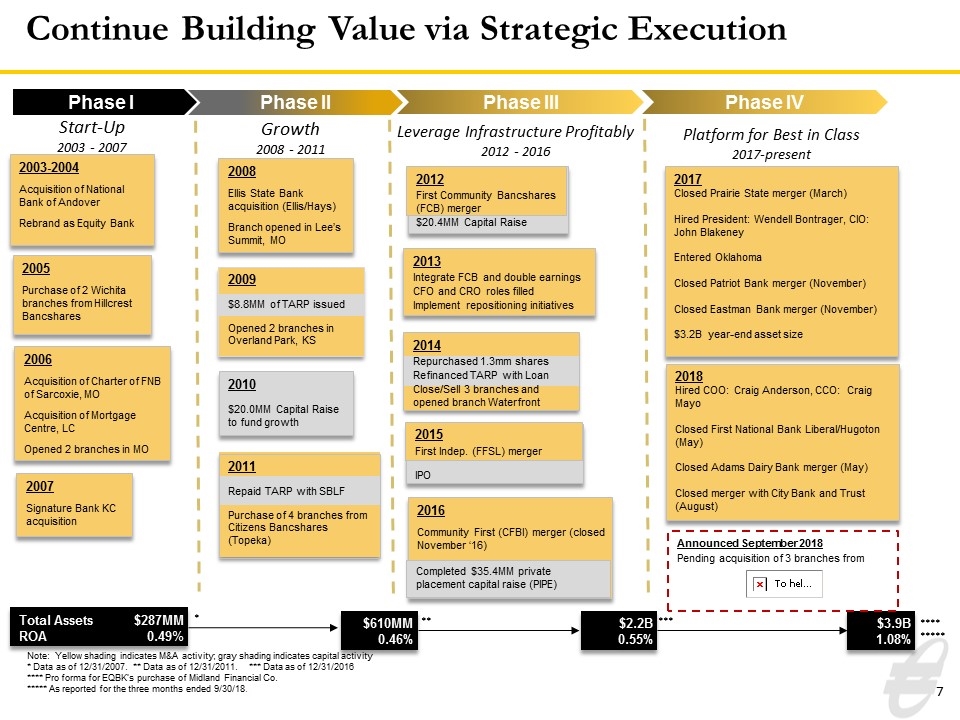
Note: Yellow shading indicates M&A activity; gray shading indicates capital activity * Data as of 12/31/2007. ** Data as of 12/31/2011. *** Data as of 12/31/2016 **** Pro forma for EQBK’s purchase of Midland Financial Co. ***** As reported for the three months ended 9/30/18. 2009 $8.8MM of TARP issued Opened 2 branches in Overland Park, KS 2014 Repurchased 1.3mm shares Refinanced TARP with Loan Close/Sell 3 branches and opened branch Waterfront 2012 First Community Bancshares (FCB) merger $20.4MM Capital Raise 2011 Repaid TARP with SBLF Purchase of 4 branches from Citizens Bancshares (Topeka) 2003-2004 Acquisition of National Bank of Andover Rebrand as Equity Bank 2005 Purchase of 2 Wichita branches from Hillcrest Bancshares 2006 Acquisition of Charter of FNB of Sarcoxie, MO Acquisition of Mortgage Centre, LC Opened 2 branches in MO 2008 Ellis State Bank acquisition (Ellis/Hays) Branch opened in Lee’s Summit, MO 2010 $20.0MM Capital Raise to fund growth 2013 Integrate FCB and double earnings CFO and CRO roles filled Implement repositioning initiatives 2007 Signature Bank KC acquisition Phase I Phase II Phase III Start-Up 2003 - 2007 Growth 2008 - 2011 Leverage Infrastructure Profitably 2012 - 2016 $2.2B 0.55% Total Assets ROA $287MM 0.49% $610MM 0.46% * ** *** 2015 First Indep. (FFSL) merger IPO Continue Building Value via Strategic Execution 2016 Community First (CFBI) merger (closed November ‘16) Completed $35.4MM private placement capital raise (PIPE) Phase IV Platform for Best in Class 2017-present 2017 Closed Prairie State merger (March) Hired President: Wendell Bontrager, CIO: John Blakeney Entered Oklahoma Closed Patriot Bank merger (November) Closed Eastman Bank merger (November) $3.2B year-end asset size $3.9B 1.08% **** ***** 2018 Hired COO: Craig Anderson, CCO: Craig Mayo Closed First National Bank Liberal/Hugoton (May) Closed Adams Dairy Bank merger (May) Closed merger with City Bank and Trust (August) Announced September 2018 Pending acquisition of 3 branches from
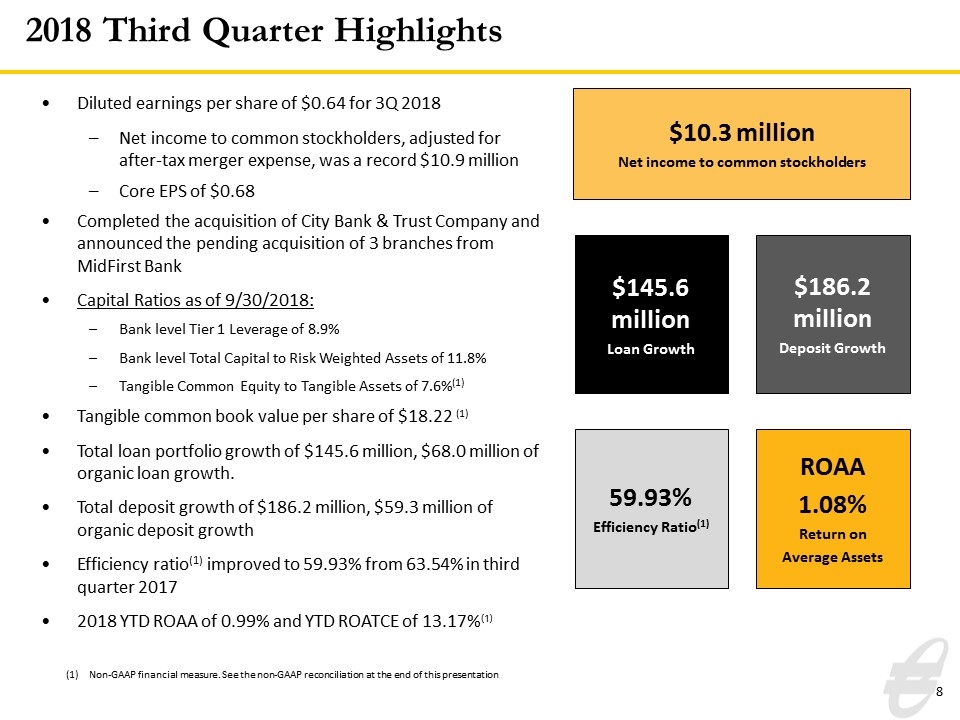
Diluted earnings per share of $0.64 for 3Q 2018 Net income to common stockholders, adjusted for after-tax merger expense, was a record $10.9 million Core EPS of $0.68 Completed the acquisition of City Bank & Trust Company and announced the pending acquisition of 3 branches from MidFirst Bank Capital Ratios as of 9/30/2018: Bank level Tier 1 Leverage of 8.9% Bank level Total Capital to Risk Weighted Assets of 11.8% Tangible Common Equity to Tangible Assets of 7.6%(1) Tangible common book value per share of $18.22 (1) Total loan portfolio growth of $145.6 million, $68.0 million of organic loan growth. Total deposit growth of $186.2 million, $59.3 million of organic deposit growth Efficiency ratio(1) improved to 59.93% from 63.54% in third quarter 2017 2018 YTD ROAA of 0.99% and YTD ROATCE of 13.17%(1) 2018 Third Quarter Highlights $10.3 million Net income to common stockholders (1) Non-GAAP financial measure. See the non-GAAP reconciliation at the end of this presentation $145.6 million Loan Growth 59.93% Efficiency Ratio(1) ROAA 1.08% Return on Average Assets $186.2 million Deposit Growth
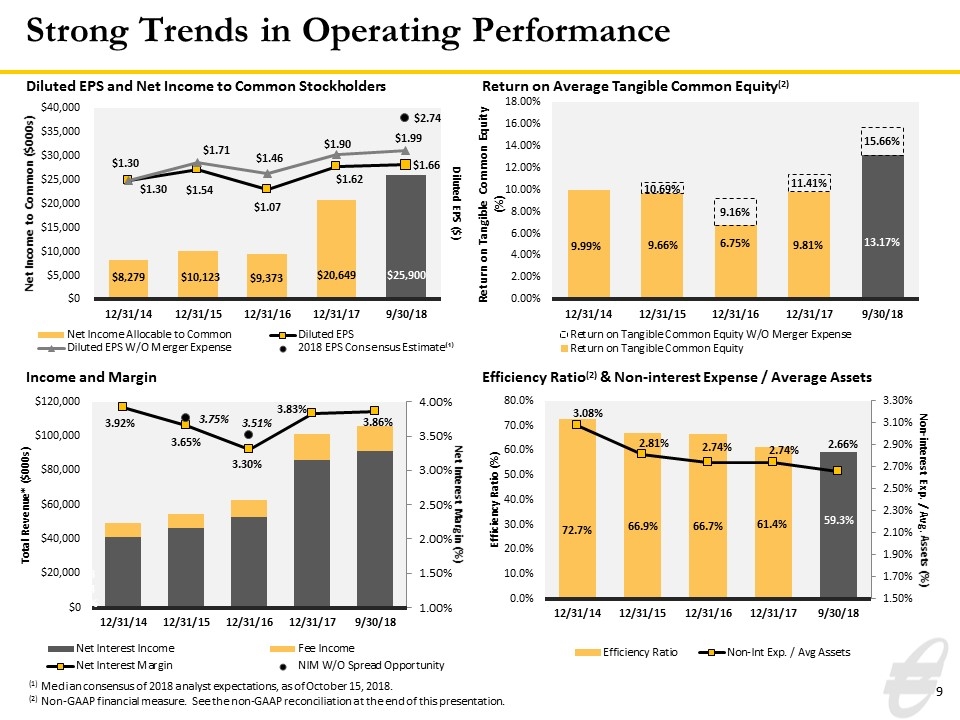
Strong Trends in Operating Performance Diluted EPS and Net Income to Common Stockholders Return on Average Tangible Common Equity(2) Income and Margin Efficiency Ratio(2) & Non-interest Expense / Average Assets (1) Median consensus of 2018 analyst expectations, as of October 15, 2018. (2) Non-GAAP financial measure. See the non-GAAP reconciliation at the end of this presentation.
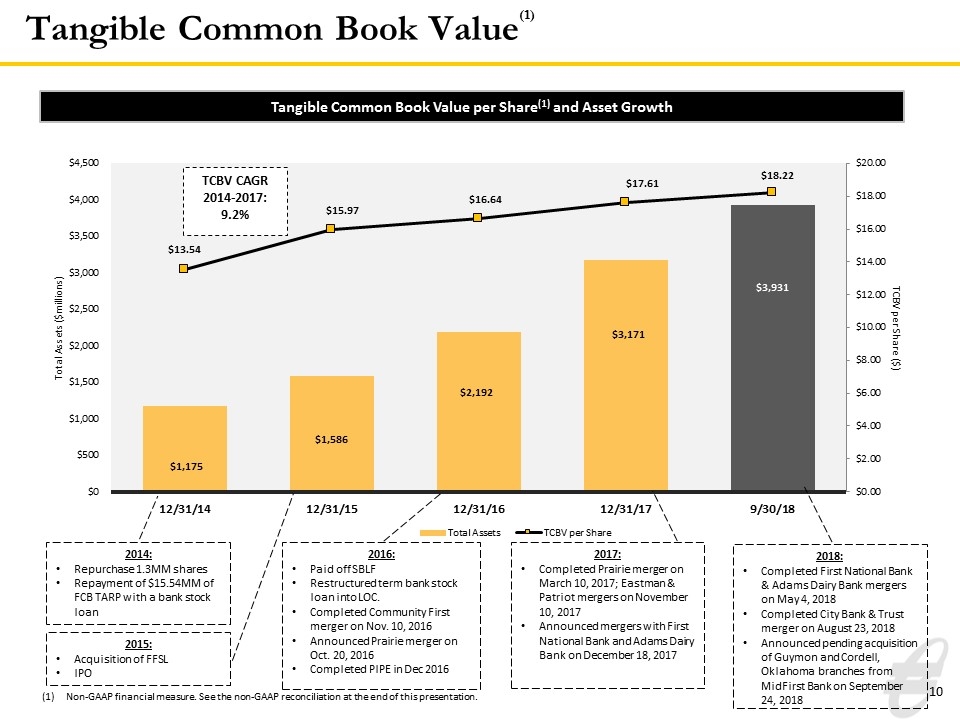
Tangible Common Book Value(1) Tangible Common Book Value per Share(1) and Asset Growth 2014: Repurchase 1.3MM shares Repayment of $15.54MM of FCB TARP with a bank stock loan 2015: Acquisition of FFSL IPO TCBV CAGR 2014-2017: 9.2% 2016: Paid off SBLF Restructured term bank stock loan into LOC. Completed Community First merger on Nov. 10, 2016 Announced Prairie merger on Oct. 20, 2016 Completed PIPE in Dec 2016 Non-GAAP financial measure. See the non-GAAP reconciliation at the end of this presentation. 2017: Completed Prairie merger on March 10, 2017; Eastman & Patriot mergers on November 10, 2017 Announced mergers with First National Bank and Adams Dairy Bank on December 18, 2017 2018: Completed First National Bank & Adams Dairy Bank mergers on May 4, 2018 Completed City Bank & Trust merger on August 23, 2018 Announced pending acquisition of Guymon and Cordell, Oklahoma branches from MidFirst Bank on September 24, 2018
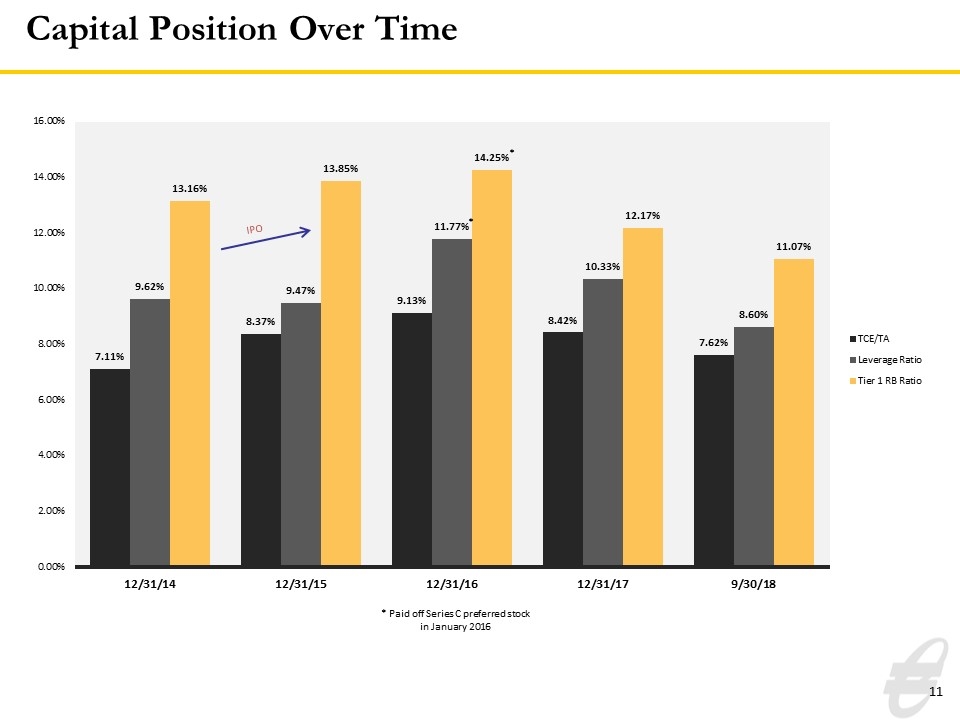
Capital Position Over Time IPO * Paid off Series C preferred stock in January 2016
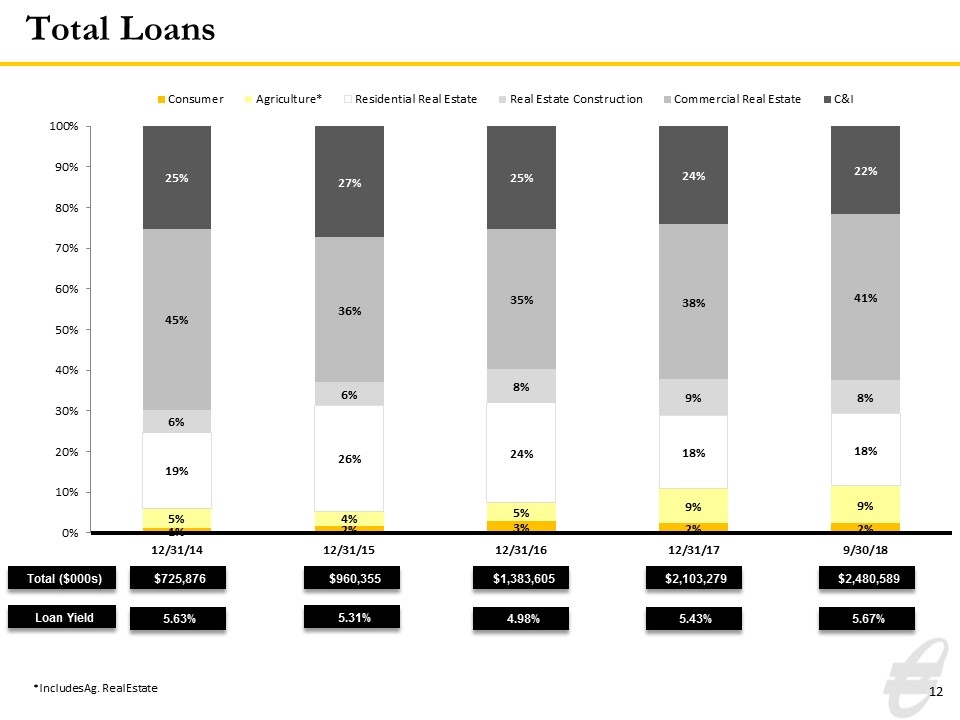
Total Loans Total ($000s) $2,103,279 $2,480,589 $725,876 $960,355 $1,383,605 Loan Yield 5.63% 5.31% 4.98% 5.43% 5.67% *Includes Ag. Real Estate
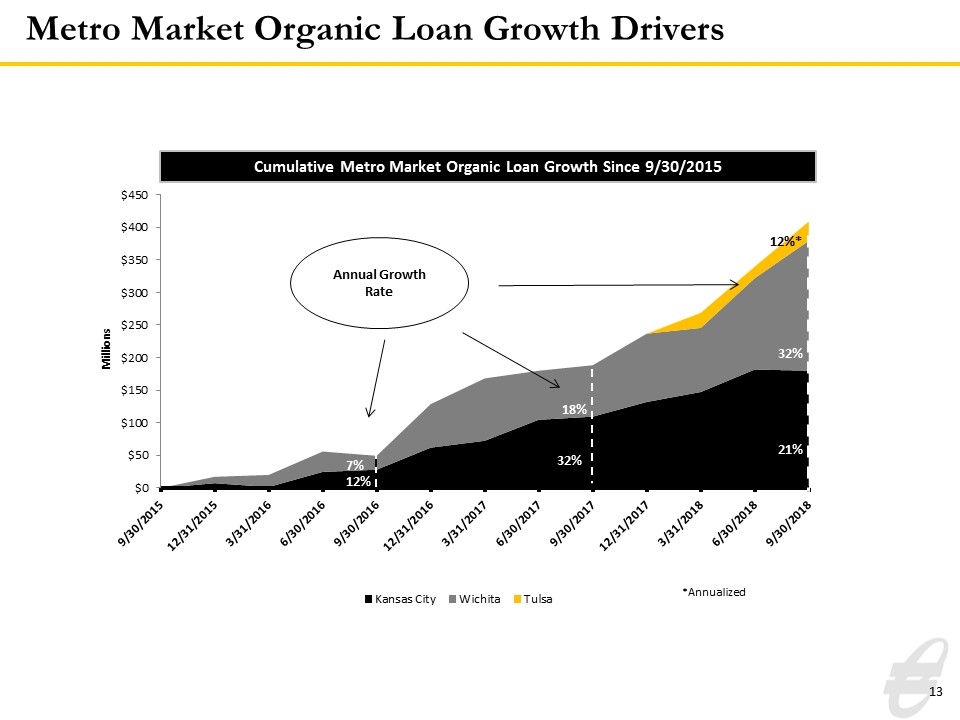
Metro Market Organic Loan Growth Drivers Cumulative Metro Market Organic Loan Growth Since 9/30/2015
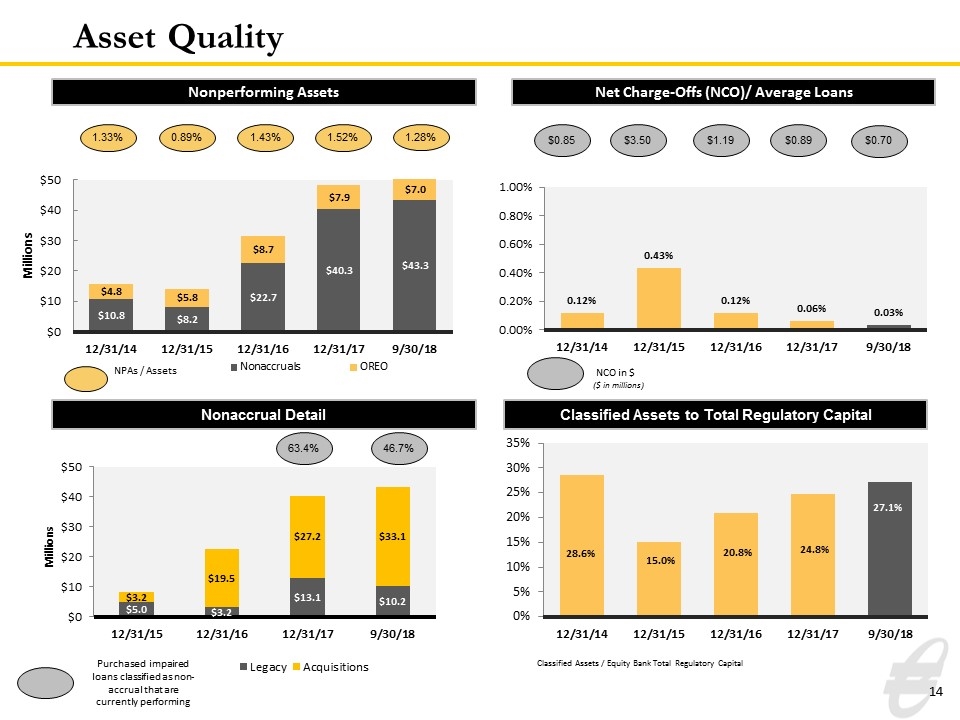
Asset Quality Nonperforming Assets 1.33% 0.89% NPAs / Assets 1.43% Net Charge-Offs (NCO)/ Average Loans $0.85 $3.50 $1.19 NCO in $ ($ in millions) Nonaccrual Detail Classified Assets to Total Regulatory Capital Classified Assets / Equity Bank Total Regulatory Capital $0.89 1.52% 1.28% $0.70 46.7% 63.4% Purchased impaired loans classified as non-accrual that are currently performing
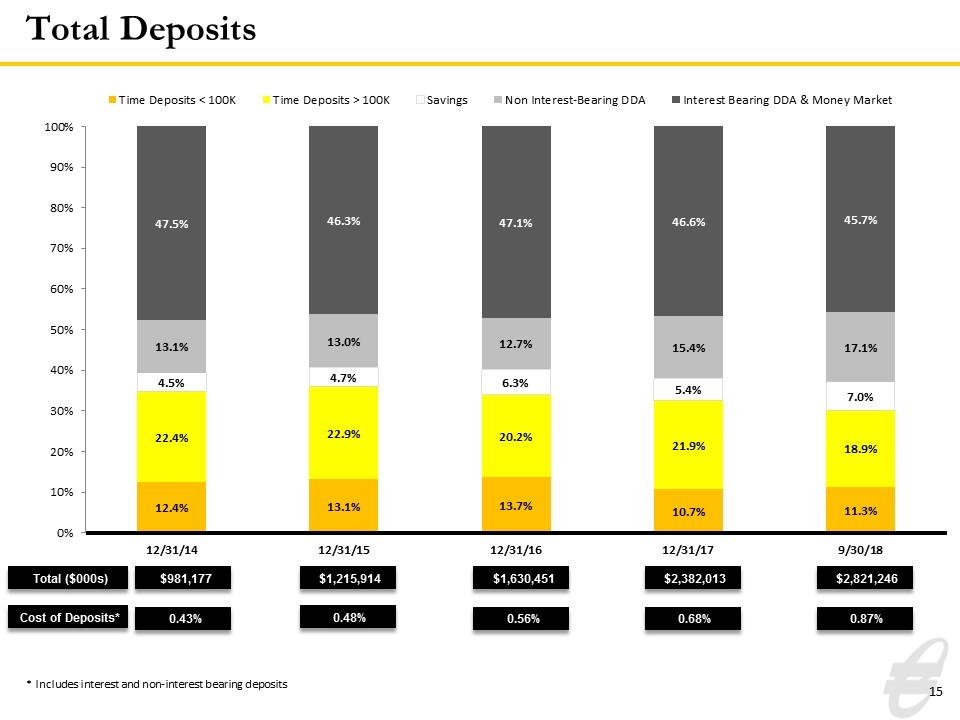
Total Deposits Total ($000s) $2,382,013 $2,821,246 $981,177 $1,215,914 $1,630,451 Cost of Deposits* 0.43% 0.48% 0.56% 0.68% 0.87% * Includes interest and non-interest bearing deposits
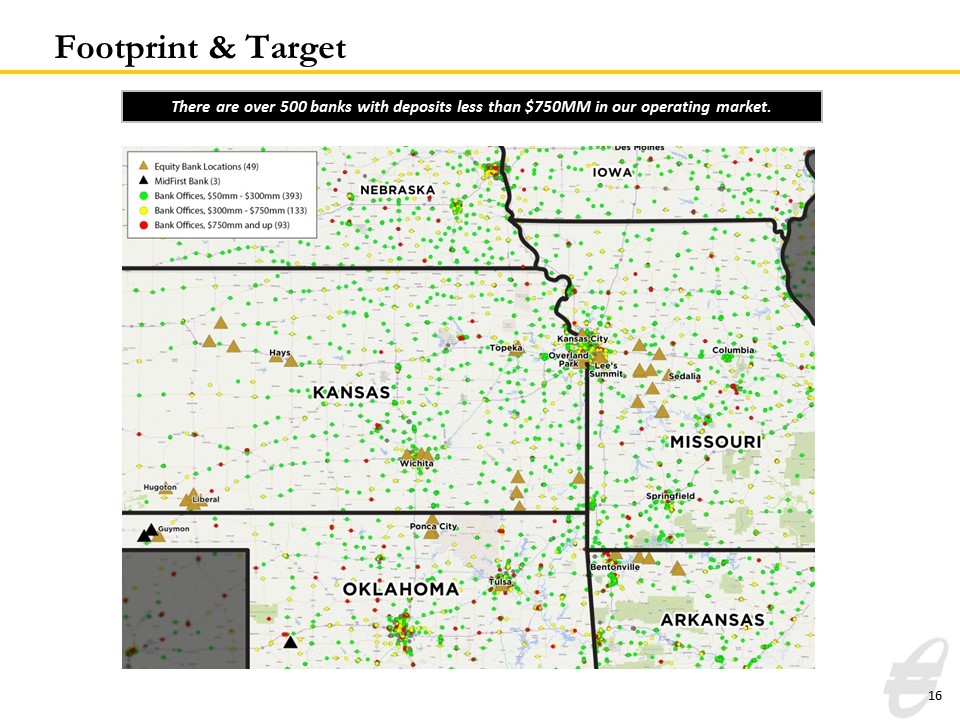
Footprint & Target There are over 500 banks with deposits less than $750MM in our operating market.
Appendix
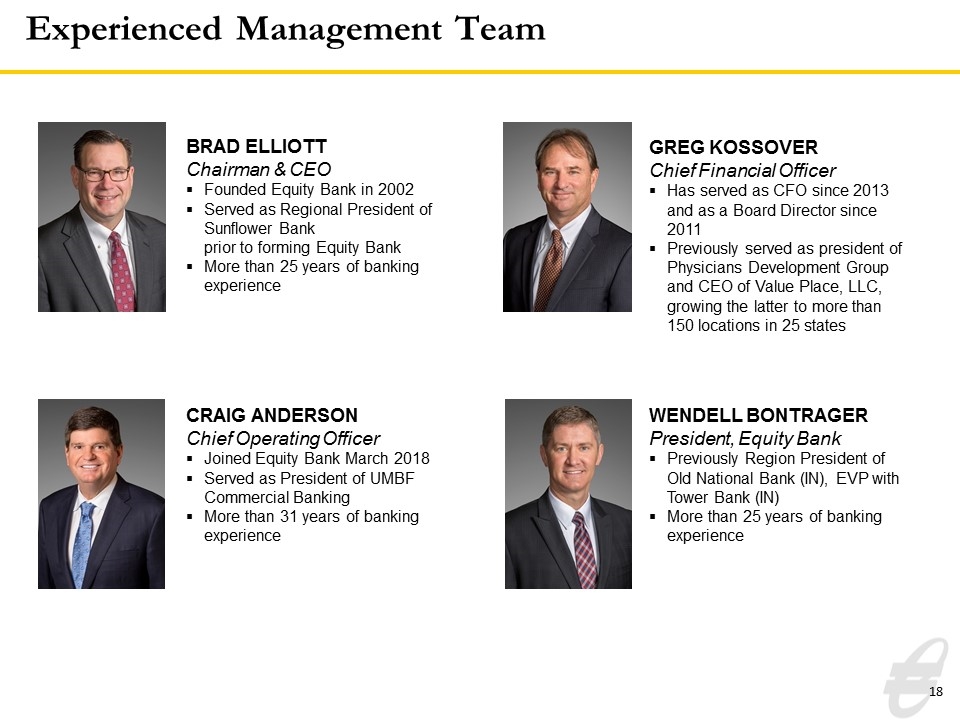
CRAIG ANDERSON Chief Operating Officer Joined Equity Bank March 2018 Served as President of UMBF Commercial Banking More than 31 years of banking experience Experienced Management Team BRAD ELLIOTT Chairman & CEO Founded Equity Bank in 2002 Served as Regional President of Sunflower Bank prior to forming Equity Bank More than 25 years of banking experience GREG KOSSOVER Chief Financial Officer Has served as CFO since 2013 and as a Board Director since 2011 Previously served as president of Physicians Development Group and CEO of Value Place, LLC, growing the latter to more than 150 locations in 25 states WENDELL BONTRAGER President, Equity Bank Previously Region President of Old National Bank (IN), EVP with Tower Bank (IN) More than 25 years of banking experience
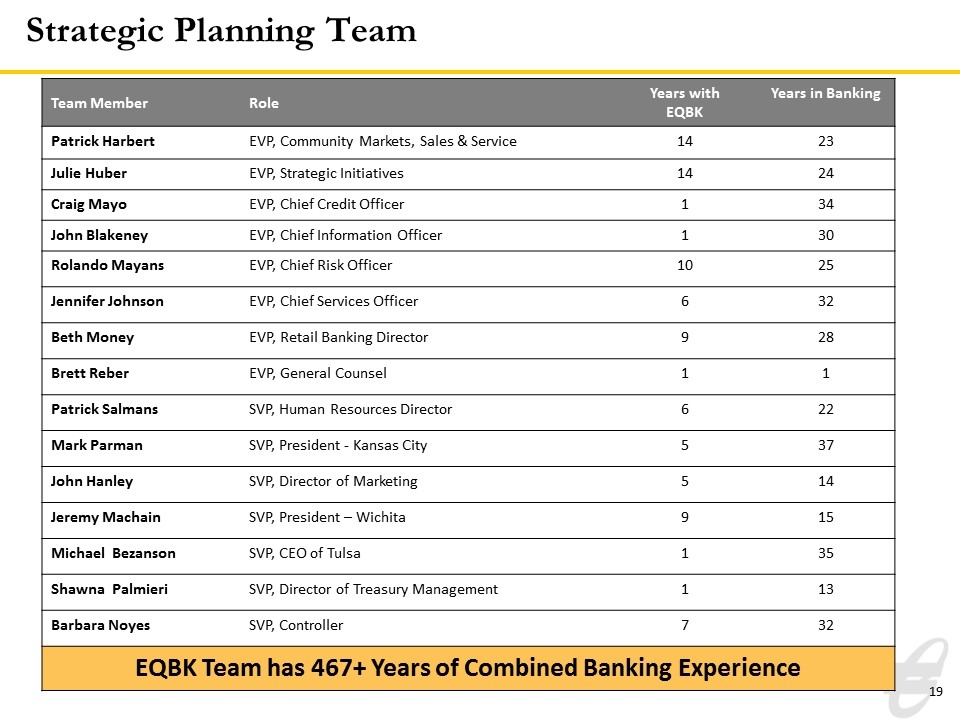
Team Member Role Years with EQBK Years in Banking Patrick Harbert EVP, Community Markets, Sales & Service 14 23 Julie Huber EVP, Strategic Initiatives 14 24 Craig Mayo EVP, Chief Credit Officer 1 34 John Blakeney EVP, Chief Information Officer 1 30 Rolando Mayans EVP, Chief Risk Officer 10 25 Jennifer Johnson EVP, Chief Services Officer 6 32 Beth Money EVP, Retail Banking Director 9 28 Brett Reber EVP, General Counsel 1 1 Patrick Salmans SVP, Human Resources Director 6 22 Mark Parman SVP, President - Kansas City 5 37 John Hanley SVP, Director of Marketing 5 14 Jeremy Machain SVP, President – Wichita 9 15 Michael Bezanson SVP, CEO of Tulsa 1 35 Shawna Palmieri SVP, Director of Treasury Management 1 13 Barbara Noyes SVP, Controller 7 32 EQBK Team has 467+ Years of Combined Banking Experience Strategic Planning Team
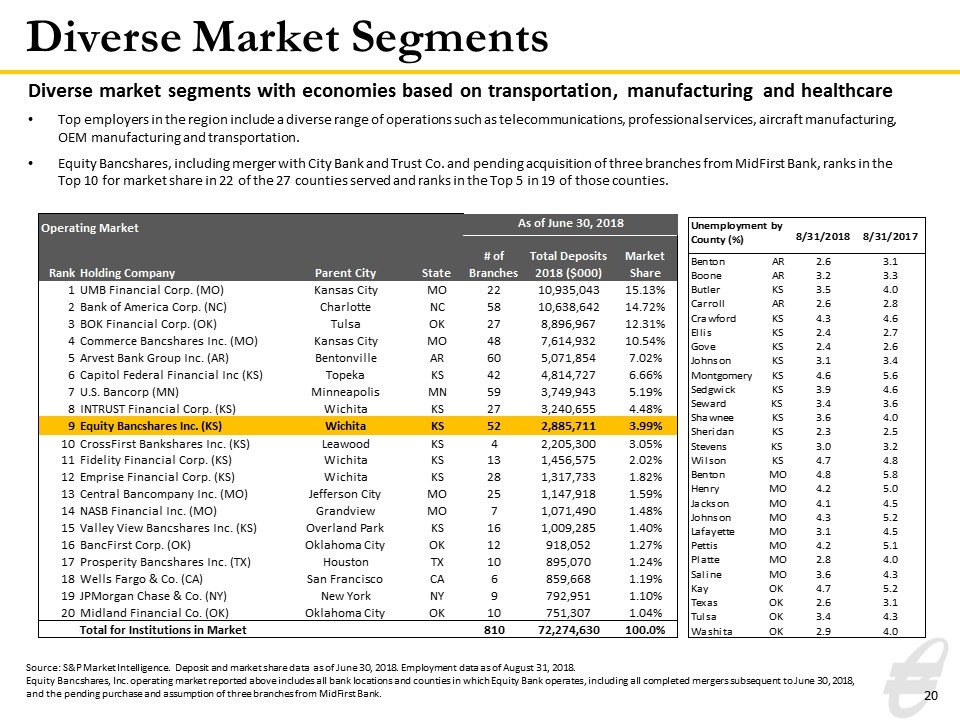
Diverse Market Segments Source: S&P Market Intelligence. Deposit and market share data as of June 30, 2018. Employment data as of August 31, 2018. Equity Bancshares, Inc. operating market reported above includes all bank locations and counties in which Equity Bank operates, including all completed mergers subsequent to June 30, 2018, and the pending purchase and assumption of three branches from MidFirst Bank. Diverse market segments with economies based on transportation, manufacturing and healthcare Top employers in the region include a diverse range of operations such as telecommunications, professional services, aircraft manufacturing, OEM manufacturing and transportation. Equity Bancshares, including merger with City Bank and Trust Co. and pending acquisition of three branches from MidFirst Bank, ranks in the Top 10 for market share in 22 of the 27 counties served and ranks in the Top 5 in 19 of those counties.
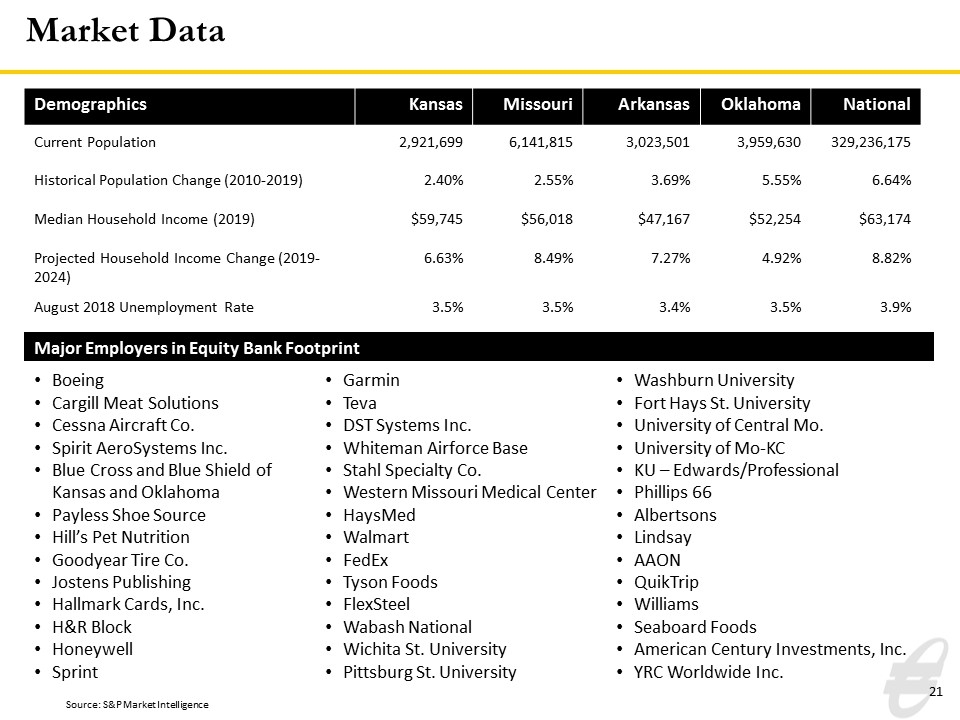
Market Data Demographics Kansas Missouri Arkansas Oklahoma National Current Population 2,921,699 6,141,815 3,023,501 3,959,630 329,236,175 Historical Population Change (2010-2019) 2.40% 2.55% 3.69% 5.55% 6.64% Median Household Income (2019) $59,745 $56,018 $47,167 $52,254 $63,174 Projected Household Income Change (2019-2024) 6.63% 8.49% 7.27% 4.92% 8.82% August 2018 Unemployment Rate 3.5% 3.5% 3.4% 3.5% 3.9% Source: S&P Market Intelligence Boeing Cargill Meat Solutions Cessna Aircraft Co. Spirit AeroSystems Inc. Blue Cross and Blue Shield of Kansas and Oklahoma Payless Shoe Source Hill’s Pet Nutrition Goodyear Tire Co. Jostens Publishing Hallmark Cards, Inc. H&R Block Honeywell Sprint Garmin Teva DST Systems Inc. Whiteman Airforce Base Stahl Specialty Co. Western Missouri Medical Center HaysMed Walmart FedEx Tyson Foods FlexSteel Wabash National Wichita St. University Pittsburg St. University Washburn University Fort Hays St. University University of Central Mo. University of Mo-KC KU – Edwards/Professional Phillips 66 Albertsons Lindsay AAON QuikTrip Williams Seaboard Foods American Century Investments, Inc. YRC Worldwide Inc. Major Employers in Equity Bank Footprint
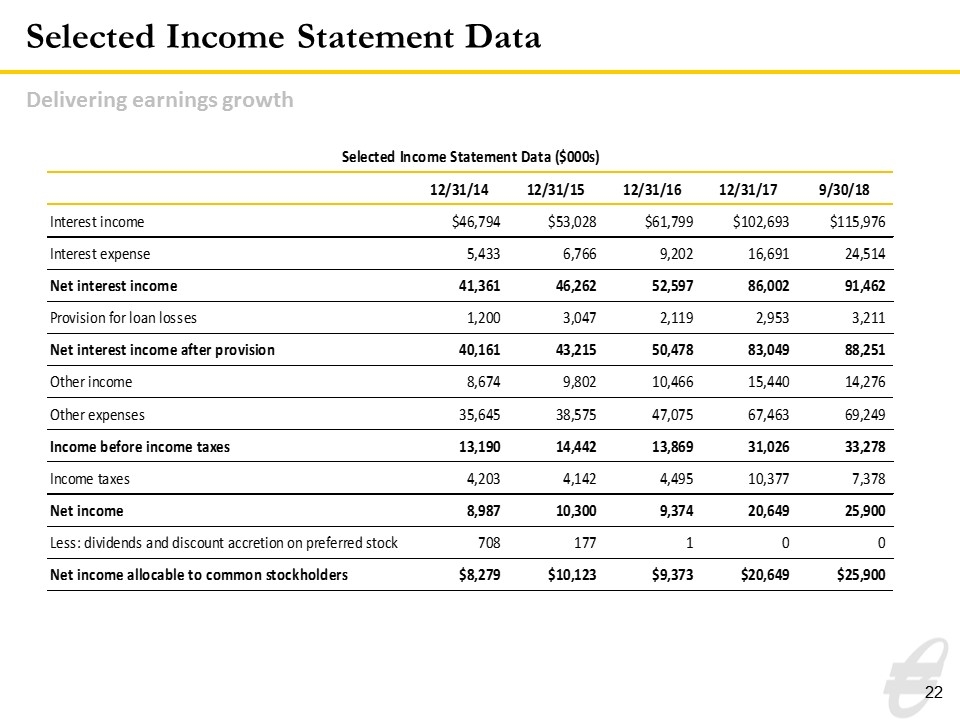
Selected Income Statement Data Delivering earnings growth Selected Income Statement Data ($000s) 12/31/14 12/31/15 12/31/16 12/31/17 9/30/18 Interest income $46,794 $53,028 $61,799 $,102,693 $,115,976 Interest expense 5433 6766 9202 16691 24514 Net interest income 41361 46262 52597 86002 91462 Provision for loan losses 1200 3047 2119 2953 3211 Net interest income after provision 40161 43215 50478 83049 88251 Other income 8674 9802 10466 15440 14276 Other expenses 35645 38575 47075 67463 69249 Income before income taxes 13190 14442 13869 31026 33278 Income taxes 4203 4142 4495 10377 7378 Net income 8987 10300 9374 20649 25900 Less: dividends and discount accretion on preferred stock 708 177 1 0 0 Net income allocable to common stockholders $8,279 $10,123 $9,373 $20,649 $25,900
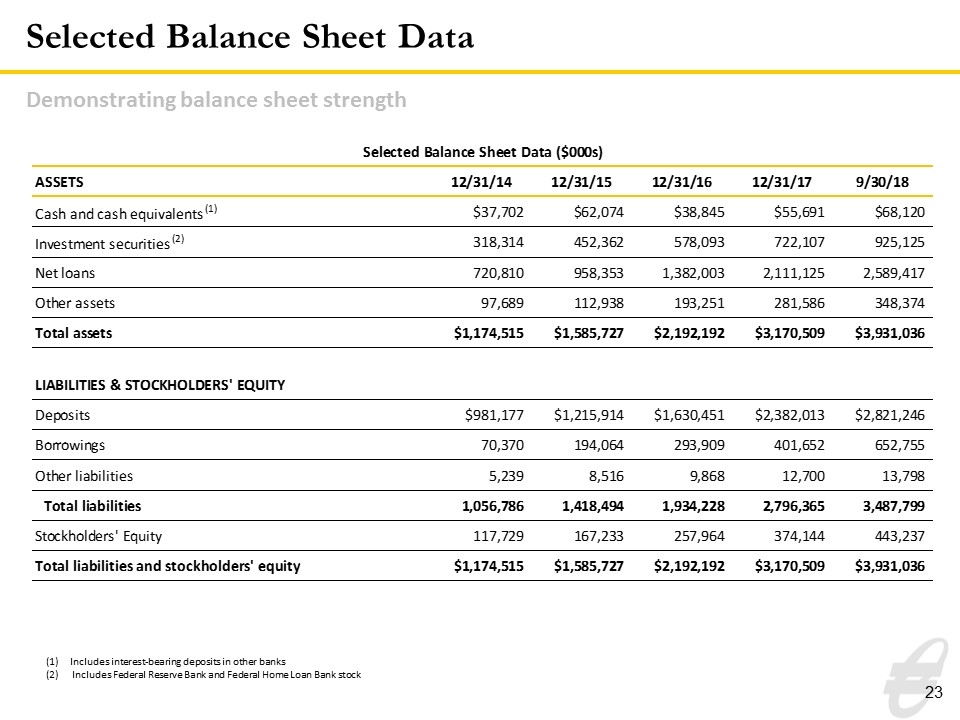
Selected Balance Sheet Data Demonstrating balance sheet strength Includes interest-bearing deposits in other banks (2) Includes Federal Reserve Bank and Federal Home Loan Bank stock Selected Balance Sheet Data ($000s) ASSETS 12/31/14 12/31/15 12/31/16 12/31/17 9/30/18 Cash and cash equivalents (1) $37,702 $62,074 $38,845 $55,691 $68,120 Investment securities (2) 318314 452362 578093 722107 925125 Net loans 720810 958353 1382003 2111125 2589417 Other assets 97689 112938 193251 281586 348374 Total assets $1,174,515 $1,585,727 $2,192,192 $3,170,509 $3,931,036 LIABILITIES & STOCKHOLDERS' EQUITY Deposits $,981,177 $1,215,914 $1,630,451 $2,382,013 $2,821,246 Borrowings 70370 194064 293909 401652 652755 Other liabilities 5239 8516 9868 12700 13798 Total liabilities 1056786 1418494 1934228 2796365 3487799 Stockholders' Equity 117729 167233 257964 374144 443237 Total liabilities and stockholders' equity $1,174,515 $1,585,727 $2,192,192 $3,170,509 $3,931,036
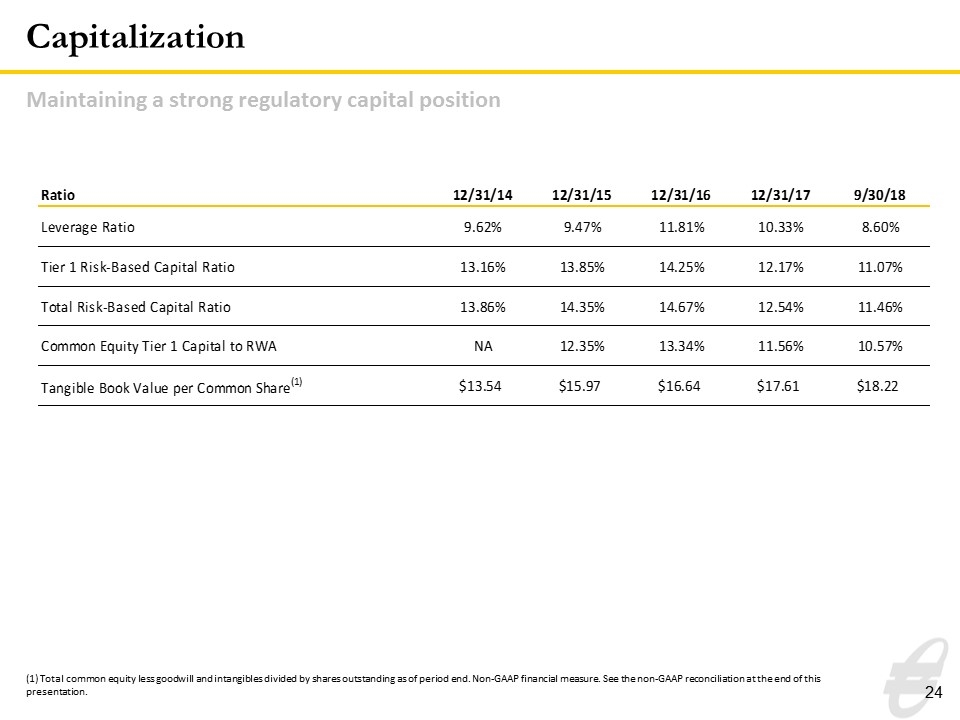
Capitalization (1) Total common equity less goodwill and intangibles divided by shares outstanding as of period end. Non-GAAP financial measure. See the non-GAAP reconciliation at the end of this presentation. Maintaining a strong regulatory capital position Ratio 12/31/14 12/31/15 12/31/16 12/31/17 9/30/18 Leverage Ratio 9.6199999999999994E-2 9.4700000000000006E-2 0.1181 0.1033 8.5999999999999993E-2 Tier 1 Risk-Based Capital Ratio 0.13159999999999999 0.13850000000000001 0.14249999999999999 0.1217 0.11070000000000001 Total Risk-Based Capital Ratio 0.1386 0.14349999999999999 0.1467 0.12540000000000001 0.11459999999999999 Common Equity Tier 1 Capital to RWA NA 0.1235 0.13339999999999999 0.11559999999999999 0.1057 Tangible Book Value per Common Share(1) $13.54 $15.97 $16.64 $17.61 $18.22
The subsequent tables present non-GAAP reconciliations of the following calculations: Tangible Common Equity (TCE) to Tangible Assets (TA) Ratio Tangible Book Value per Common Share Return on Average Tangible Common Equity (ROATCE) Efficiency Ratio
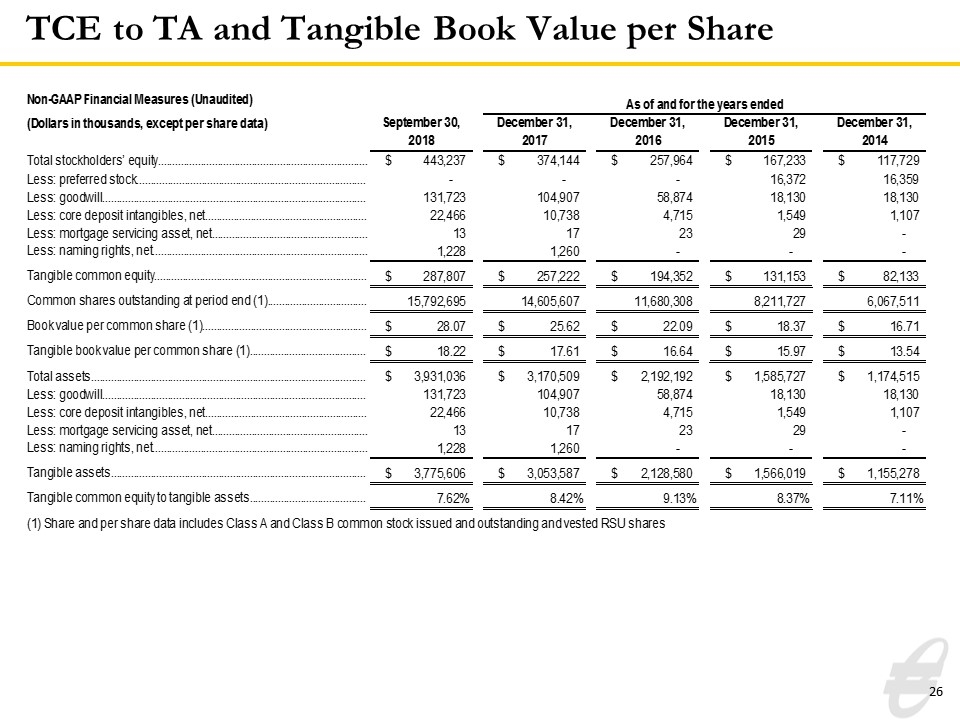
TCE to TA and Tangible Book Value per Share Non-GAAP Financial Measures (Unaudited) As of and for the years ended (Dollars in thousands, except per share data) September 30, 2018 December 31, 2017 December 31, 2016 December 31,2015 December 31,2014 December 31,2012 Total stockholders’ equity $,443,237 $,374,144 $,257,964 $,167,233 $,117,729 $,138,169 Less: preferred stock 0 0 0 16,372 16,359 31,884 Less: goodwill ,131,723 ,104,907 58,874 18,130 18,130 18,130 Less: core deposit intangibles, net 22,466 10,738 4,715 1,549 1,107 1,957 Less: mortgage servicing asset, net 13 17 23 29 0 Less: naming rights, net 1,228 1,260 0 0 0 0 Tangible common equity $,287,807 $,257,222 $,194,352 $,131,153 $82,133 $86,198 Common shares outstanding at period end (1) 15,792,695 14,605,607 11,680,308 8,211,727 6,067,511 7,431,513 Book value per common share (1) $28.06595074494885 $25.61646359511111 $22.085376515756259 $18.371409570727327 $16.707015446696349 $14.301932863469389 Tangible book value per common share (1) $18.224058654966743 $17.611181787925695 $16.639287251671785 $15.971427204046117 $13.536522636712155 $11.598983948490705 Total assets $3,931,036 $3,170,509 $2,192,192 $1,585,727 $1,174,515 $1,188,850 Less: goodwill ,131,723 ,104,907 58,874 18,130 18,130 18,130 Less: core deposit intangibles, net 22,466 10,738 4,715 1,549 1,107 1,957 Less: mortgage servicing asset, net 13 17 23 29 0 Less: naming rights, net 1,228 1,260 0 0 0 0 Tangible assets $3,775,606 $3,053,587 $2,128,580 $1,566,019 $1,155,278 $1,168,763 Tangible common equity to tangible assets 7.622802803046716E-2 8.4236014890029326E-2 9.1305941049901806E-2 8.3749303169374067E-2 7.1093710777838756E-2 7.3751479127932701E-2 (1) Share and per share data includes Class A and Class B common stock issued and outstanding and vested RSU shares Non-GAAP Financial Measures, continued (Unaudited) As of and for the three months ended As of and for the three months ended As of and for the three months ended As of and for the years ended (Dollars in thousands, except per share data) March 31, 2017 March 31, 2017 March 31, 2016 December 31,2015 December 31,2014 December 31,2012 Total average stockholders' equity $,264,736 $,264,736 $,153,929 $,137,936 $,123,174 $,102,032 Less: average intangible assets and preferred stock 65,185 65,185 20,616 31,294 37,917 33,653 Average tangible common equity (1) (3) $,199,551 $,199,551 $,133,313 $,106,642 $85,257 $68,379 Net income allocable to common stockholders (1) 4,864 4,864 3,439 10,123 8,279 3,814 Amortization of core deposit intangible 218 218 87 275 363 192 Less: tax effect of amortization of core deposit intangible (2) -76 -76 -30 -96 -,127 -65 Adjusted net income allocable to common stockholders $5,006 $5,006 $3,496 $10,302 $8,515 $3,941 Return on average tangible common equity (ROATCE) 0.10173895951967722 0.10173895951967722 0.10547234826937482 9.6603589580090396E-2 9.98744971087418E-2 5.7634653914213428E-2 Non-interest expense $15,226 $15,226 $9,689 $38,575 $35,645 $22,900 Less: merger expenses 926 926 0 1,691 0 1,519 Less: loss on debt extinguishment 0 0 58 316 0 0 Non-interest expense, excluding merger expenses and loss on debt extinguishment $14,300 $14,300 $9,631 $36,568 $35,645 $21,381 Net interest income $19,893 $19,893 $12,758 $46,262 $41,361 $25,570 Non-interest income $3,339 $3,339 $2,697 $9,802 $8,674 $4,826 Less: net gains on sales and settlement of securities 13 13 420 756 986 3 Less: net gain on acquisition 0 0 0 682 0 0 Non-interest income, excluding net gains on sales and settlement of securities and net gain on acquisition $3,326 $3,326 $2,277 $8,364 $7,688 $4,823 Efficiency ratio 0.61587493001421245 0.61587493001421245 0.64057199866977055 0.6694248160216747 0.72672225733450224 0.70348435495015305 ____________________ (1) Share and per share data includes Class A and Class B common stock issued and outstanding (2) Tax rates used in this calculation were 35% for 2015 and 2014 and 34% for 2013, 2012, and 2011 (3) All periods disclosed were calculated using a simple average of tangible common equity
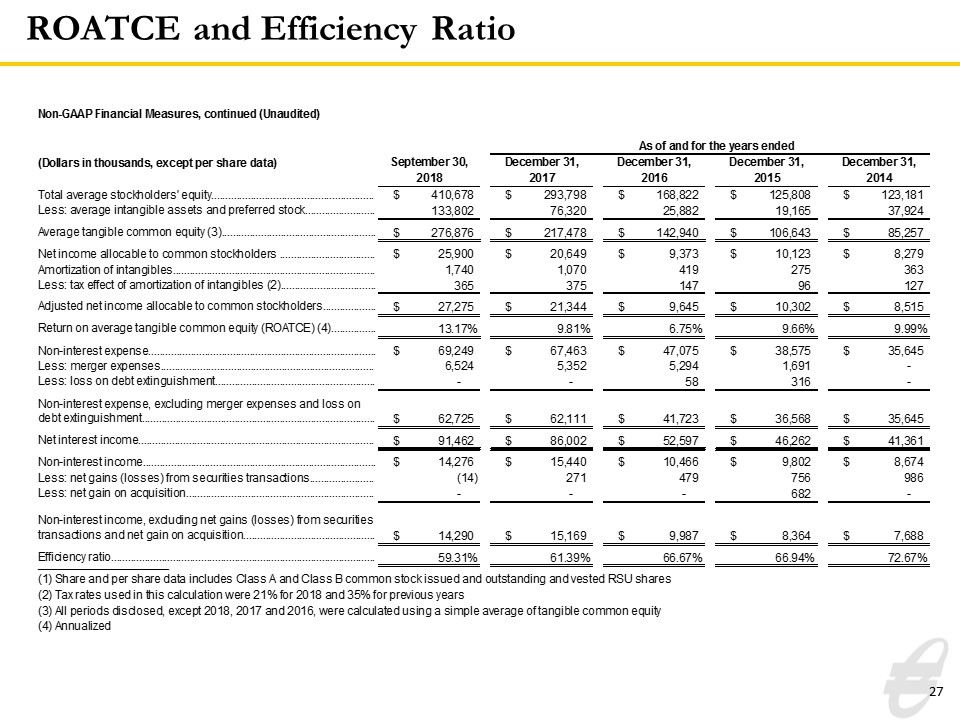
ROATCE and Efficiency Ratio Non-GAAP Financial Measures (Unaudited) Years Ended December 31, (Dollars in thousands, except per share data) Mar. 2018 2017 2016 2015 2014 Total stockholders’ equity $,381,487 $,374,144 $,257,964 $,167,232 $,117,729 Less: preferred stock 0 0 0 16,372 16,359 Less: goodwill ,103,412 ,104,907 58,874 18,130 18,130 Less: core deposit intangibles, net 10,355 10,738 4,715 1,549 1,107 Less: mortgage servicing asset, net 16 17 23 29 0 Less: naming rights, net 1,249 1,260 0 0 0 Tangible common equity $,266,455 $,257,222 $,194,352 $,131,152 $82,133 Common shares outstanding at period end (1) 14,621,258 14,605,607 11,680,308 8,211,727 6,067,511 Book value per common share $26.091256990335577 $25.61646359511111 $22.085376515756259 $18.371287793663868 $16.707015446696349 Tangible book value per common share $18.223808101874681 $17.611181787925695 $16.639287251671785 $15.971305426982656 $13.536522636712155 Total assets $3,176,062 $3,170,509 $2,192,192 $1,585,727 $1,174,515 Less: goodwill ,103,412 ,104,907 58,874 18,130 18,130 Less: core deposit intangibles, net 10,355 10,738 4,715 1,549 1,107 Less: mortgage servicing asset, net 16 17 23 29 0 Less: naming rights, net 1,249 1,260 0 0 0 Tangible assets $3,061,030 $3,053,587 $2,128,580 $1,566,019 $1,155,278 Tangible common equity to tangible assets 8.7047497084314751E-2 8.4236014890029326E-2 9.1305941049901806E-2 8.3748664607517537E-2 7.1093710777838756E-2 (1) Share and per share data includes Class A and Class B common stock issued and outsanding (2) Tax rates used in this calculation were 35% (3) All periods disclosed, except 2018, 2017 and 2016, were calculated using a simple average of tangible common equity Non-GAAP Financial Measures, continued (Unaudited) As of and for the years ended (Dollars in thousands, except per share data) September 30, 2018 December 31, 2017 December 31, 2016 December 31,2015 December 31,2014 Total average stockholders' equity $,410,678 $,293,798 $,168,822 $,125,808 $,123,181 Less: average intangible assets and preferred stock ,133,802 76,320 25,882 19,165 37,924 Average tangible common equity (3) $,276,876 $,217,478 $,142,940 $,106,643 $85,257 Net income allocable to common stockholders $25,900 $20,649 $9,373 $10,123 $8,279 Amortization of intangibles 1,740 1,070 419 275 363 Less: tax effect of amortization of intangibles (2) 365 375 147 96 127 Adjusted net income allocable to common stockholders $27,275 $21,344 $9,645 $10,302 $8,515 Return on average tangible common equity (ROATCE) (4) 0.13170724472895842 9.8143260467725466E-2 6.7475863998880656E-2 9.6602683720450472E-2 9.98744971087418E-2 Non-interest expense $69,249 $67,463 $47,075 $38,575 $35,645 Less: merger expenses 6,524 5,352 5,294 1,691 0 Less: loss on debt extinguishment 0 0 58 316 0 Non-interest expense, excluding merger expenses and loss on debt extinguishment $62,725 $62,111 $41,723 $36,568 $35,645 Net interest income $91,462 $86,002 $52,597 $46,262 $41,361 Non-interest income $14,276 $15,440 $10,466 $9,802 $8,674 Less: net gains (losses) from securities transactions -14 271 479 756 986 Less: net gain on acquisition 0 0 0 682 0 Non-interest income, excluding net gains (losses) from securities transactions and net gain on acquisition $14,290 $15,169 $9,987 $8,364 $7,688 Efficiency ratio 0.59313299039261669 0.61392098526257521 0.66667199284162082 0.6694248160216747 0.72672225733450224 ____________________ (1) Share and per share data includes Class A and Class B common stock issued and outstanding and vested RSU shares (2) Tax rates used in this calculation were 21% for 2018 and 35% for previous years (3) All periods disclosed, except 2018, 2017 and 2016, were calculated using a simple average of tangible common equity (4) Annualized
investor.equitybank.com
