Attached files
| file | filename |
|---|---|
| 8-K - 8-K - UGI CORP /PA/ | a18-36615_28k.htm |
| EX-99.3 - EX-99.3 - UGI CORP /PA/ | a18-36615_2ex99d3.htm |
| EX-99.1 - EX-99.1 - UGI CORP /PA/ | a18-36615_2ex99d1.htm |
This presentation does not constitute an offer to sell or a solicitation of an offer to buy any securities in any jurisdiction to any person to whom it is unlawful to make such an offer or solicitation in such jurisdiction. This presentation contains certain forward-looking statements that management believes to be reasonable as of today’s date only. Actual results may differ significantly because of risks and uncertainties that are difficult to predict and many of which are beyond management’s control. You should read the preliminary Offering Memorandum dated October 15, 2018 (the “Preliminary Offering Memorandum”) for more information about UGI International, LLC (the “Company”) and this offering, including the risks of investing in the offered securities described in the ”Risk Factors” section of the Preliminary Offering Memorandum, including adverse weather conditions, cost volatility and availability of all energy products, including propane, natural gas, electricity and fuel oil, increased customer conservation measures, the impact of pending and future legal proceedings, continued analysis of recent tax legislation, liability for uninsured claims and for claims in excess of insurance coverage, domestic and international political, regulatory and economic conditions in the United States and in foreign countries, including the current conflicts in the Middle East, and foreign currency fluctuations (particularly the euro), changes in Marcellus Shale gas production, the availability, timing and success of our acquisitions, commercial initiatives and investments to grow our business, our ability to successfully integrate acquired businesses and achieve anticipated synergies, and the interruption, disruption, failure, malfunction, or breach of information technology systems, including due to cyber attack. The Company undertakes no obligation to release revisions to its forward-looking statements to reflect events or circumstances occurring after today. This presentation is strictly confidential and is being furnished solely in reliance on applicable exemptions from the registration requirements under the U.S. Securities Act of 1933 (the “Securities Act”). The offered securities have not and will not be registered under the Securities Act or any state securities laws, and may not be offered or sold within the United States, or to or for the account or benefit of U.S. persons, unless an exemption from the registration requirements of the Securities Act is available. Accordingly, any offer or sale of such securities will only be offered or sold (i) within the United States, or to or for the account or benefit of U.S. persons, only to Qualified Institutional Buyers (“QIBs”) and (ii) outside the United States in offshore transactions in accordance with Regulation S. Any purchaser of such securities in the United States, or to or for the account of U.S. persons, will be deemed to have made certain representations and acknowledgments, including, without limitation, that the purchaser is a QIB. This presentation includes certain financial measures, such as EBITDA and Adjusted EBITDA, which are not calculated in accordance with U.S. generally accepted accounting principles (“GAAP”). Management uses these Non-GAAP Measures as supplemental measures when assessing the Company's ability to service debt and meet loan covenants, and the Company believes this information, when viewed together with its GAAP financial results, could also be useful to investors. However, usefulness may be limited because the Non-GAAP Measures exclude certain items that are necessary and recurring elements of our cost structure. EBITDA and Adjusted EBITDA have significant limitations as analytical tools because they exclude certain material costs. Because of these limitations, management does not view EBITDA or Adjusted EBITDA in isolation. DISCLAIMER

II. UGI International Overview Private and Confidential

• Operations in 17 countries under 8 brands throughout Europe Leading market position in France, Denmark, Austria, Hungary, Czech Republic, Slovakia, and Benelux Strong brand recognition - Market Leader • • UGI International’s customer base primarily consists of residential, commercial, industrial, agricultural, wholesale and Autogas customers 460,000 bulk LPG customers, ~31,500 energy marketing customers and over 18.5 million cylinders in circulation as of Sept. 30, 2017 Diverse Customer Base • 11% 3% Bulk Cylinder Wholesale Autogas • UGI’s products are used for both home and business needs and include Bulk (67%1), Cylinder (19%), Wholesale (11%), and Autogas (3%) Mixed Product Portfolio 19% 67% 1,806 1,811 1.50 € 1.25 € Stable Financial Profile with Consistent Growth 1,351 • Continuous growth through quality acquisitions and diversification 1,223 1,117 1.00 € 1,148 0.75 € into new markets Positive trend for both volume and revenue 0.50 € • 2008 2009 2010 20112012 2013 2014 2015 2016 2017 LPGLPVGoluTmoteal(0V0o0lu'smtoen2 s) UGI France € per Gallon $238.5 $256.5 $271.7 • Ability to maintain or improve margins despite adverse weather conditions Minimal direct exposure to commodity price movements Attractive Cash Flow Generation • • Stable operating performance and limited strong cash flow generation capital intensity lead to 2015 2016 Free Cash Flow 2017 LTM June 2018 3 FCF Conversion • Three pillars will provide excellent growth Focusing on core LPG business Developing business opportunities in natural gas, LNG and electricity Growing through strategic acquisitions and investments 1. LPG - - Strong Vision for Future Growth 2. Business Development 3. Acquisitions - 1 Based on Fiscal Year 2017 LPG sales volume 2 One ton of LPG is approximately 516 gallons of LPG 3 Free Cash Flow represents Adjusted EBITDA less capital expenditures. See Appendix for a reconciliation of non-GAAP financial measures to the most closely comparable GAAP measure 9 74.0% 72.5% $119.2 70.5% 57.7% 708698679833 0.25 € 0.00 € UGI INTERNATIONAL SNAPSHOT

LPG Distribution1 Energy Marketing Bulk (67%) Cylinders (19%) Wholesale (11%) Autogas (3%) Natural Gas Electricity • Depending on customers’ volume, demand and the timing of deliveries, UGI International’s offices across Europe can arrange and accommodate larger-scale wholesale LPG deliveries • Power growth will be propagated through focused use of existing channels, and development will be prioritized around the SME business unit • Leverage DVEP power marketing platform to expand into adjacent markets (Germany, France, the UK and Benelux) • UGI provide a wide range of steel and composite cylinder products to accommodate a variety of energy needs • Serves both residential (for heating, cooking, drying, etc.) and commercial customers (including forklift trucks, hotels, restaurants, industrial companies, etc.) • Most used alternative automotive fuel worldwide • Typically mix of propane and butane • Benefits include comparatively low price and significantly reduced amount of emissions • Plays a significant role in transportation in many countries • Markets Natural Gas to small and medium enterprises, schools, municipalities, etc. • Recently announced acquisition of Dutch energy marketer DVEP • Differentiation through Digital and Data • Strong end-to-end systems and processes to manage low cost • LPG bulk tanks are provided as a source of energy for both residential (heating, cooking, hot water generation, lighting, etc.) and commercial clients (heating, hot water generation, process energy, motorgas, etc.) Fiscal 2017 Revenue Breakdown 8% 8% 84% LPG Other NatGas Note: Revenue as of fiscal year end September 30, 2017 (“Fiscal Year 2017”) 1 Fiscal Year 2017 LPG sales volume 10 UGI INTERNATIONAL AT A GLANCE

2017 2017 energy marketing 2015 2011 2017 Italy 2010 2011 Belgium Finland Luxembourg Norway Sweden Netherlands United Kingdom 2001 (20%) 2004 (100%) 2010 Denmark 2006 Hungary Poland Romania 1999 2004 Switzerland France 2001 Austria Czech Republic Slovakia 1999 11 1999: ~44mm retail gallons 2017: ~828mm retail gallons Expanded product portfolio and scale by quality acquisitions and integration to become a leading provider of energy solutions across Europe HISTORY OF UGI INTERNATIONAL: BUILDING A EUROPEAN LEADER

• Customers use LPG for space heating, cooking, water heating, generation, manufacturing and aerosol propellant motor fuel, leisure activities, crop drying, irrigation, construction, power LPG Distribution in Europe vs. U.S LPG Sales Volume Commonalities Differences 3% • Serve bulk and cylinder business units Benefit from scale Driving unit margin increases over time through efficiencies Distribute through “hub and spoke” truck-based logistics Focus on safety and customer service • Europe - concentrated market historically comprised of oil majors LPG subsidiaries U.S. - highly fragmented with ~3,200 distributors attracted to cash generating profile Cylinders used inside the home (residential cooking) and outside in Europe vs. outside only in the U.S. (barbecue and heaters) 11% • • 19% • 67% • • • Bulk Cylinder Wholesale Autogas Note: Sales volume for Fiscal Year 2017 12 A Balanced Portfolio of Product Offerings Across Customer Type, Delivery Systems and End Users BUSINESS OVERVIEW: LPG DISTRIBUTION

Products / Customers Residential: underground & above-ground tanks, providing energy for: Bulk Footprint • • • Single family homes Apartment buildings and town houses Residential developments Non-residential: underground & above-ground tanks, providing energy for: • • • • Construction & industrial businesses Hotels & restaurants Agricultural businesses Municipalities & hospitals Finland Norway United Kingdom Sweden Denmark Description & Applications Netherland Poland Luxembourg Czech Republic Small Bulk • Small bulk customers represent the largest customer portion of UGI’s business in terms of revenue and margin • Small bulk customers are primarily residential and small business users, as well as some municipalities, that use LPG mainly for heating and cooking Medium Bulk • Medium bulk customers consist mainly of large residential housing developments, hospitals, hotels, municipalities, medium-sized industrial enterprises and poultry brooders Large Bulk • Large bulk customers represent the largest customer portion of UGI’s business in terms of volume • Large bulk customers include agriculture and other businesses that use LPG in their industrial processes France Slovakia tria Hungary Switzerland Italy Romania Note: Market rankings are estimated using the AEGPL annual LPG industry review Note: Revenue, gross profit & margin as of FYE September 2017 13 West East and Central North In Fiscal Year 2017, UGI International sold approximately 623 million gallons of bulk gas, representing approximately $1,000 million of revenue BUSINESS OVERVIEW: BULK GAS

Products / Customers LPG sold in different sized steel and composite cylinders, which provide a safe, portable and eco-friendly source of energy. • Residential: Principal end-users of cylinders • Non-residential: Cylinder Footprint • • • • • • Construction & industrial businesses Hotels Restaurants Leisure businesses Laboratories Universities SGtaeseCl Cylyinlidnedresrs Com pos ite Cylinde r s Finland Norway United Kingdom Sweden Denmark Description & Applications Used as a source of energy for a variety of needs Netherland Poland Luxembourg Czech Republic • Residential examples: France Slovakia tria Hungary • • • Cooking & barbecue Camping and caravans Heating, drying and cooling different locations Switzerland Romania • Non-residential examples: • • • • • • Welding, cutting, burning , soldering, curving, hardening Roofing, asphalting, road construction, eco-friendly alternative for weed control Heating drying and cooling different locations Fuel for forklift trucks Laboratory usage (dental technology, chemical processes, etc.) Physics courses at schools Note: Market rankings are estimated using the AEGPL annual LPG industry review Note: Revenue, gross profit & margin as of FYE September 2017 14 West East and Central North In Fiscal Year 2017, UGI International sold approximately 175 million gallons of cylinder gas, representing approximately $425 million of revenue BUSINESS OVERVIEW: CYLINDER GAS
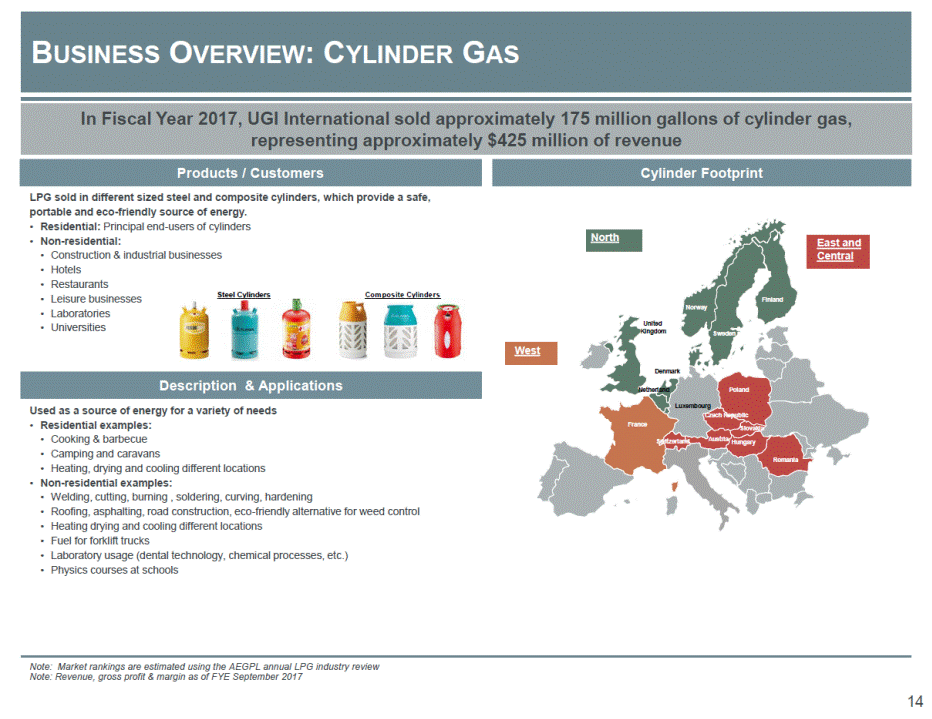
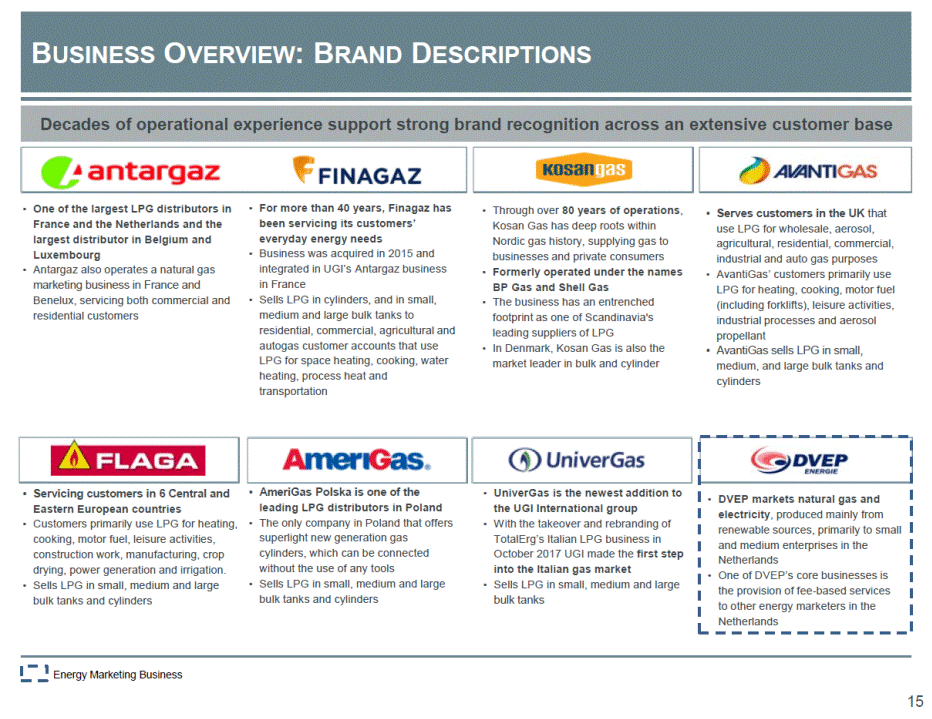
• For more than 40 years, Finagaz has been servicing its customers’ everyday energy needs Business was acquired in 2015 and integrated in UGI’s Antargaz business in France Sells LPG in cylinders, and in small, medium and large bulk tanks to residential, commercial, agricultural and autogas customer accounts that use LPG for space heating, cooking, water heating, process heat and transportation • One of the largest LPG distributors in France and the Netherlands and the largest distributor in Belgium and Luxembourg Antargaz also operates a natural gas marketing business in France and Benelux, servicing both commercial and residential customers • Through over 80 years of operations, Kosan Gas has deep roots within Nordic gas history, supplying gas to businesses and private consumers Formerly operated under the names BP Gas and Shell Gas The business has an entrenched footprint as one of Scandinavia's leading suppliers of LPG In Denmark, Kosan Gas is also the market leader in bulk and cylinder • Serves customers in the UK that use LPG for wholesale, aerosol, agricultural, residential, commercial, industrial and auto gas purposes AvantiGas’ customers primarily use LPG for heating, cooking, motor fuel (including forklifts), leisure activities, industrial processes and aerosol propellant AvantiGas sells LPG in small, medium, and large bulk tanks and cylinders • • • • • • • • • AmeriGas Polska is one of the leading LPG distributors in Poland The only company in Poland that offers superlight new generation gas cylinders, which can be connected without the use of any tools Sells LPG in small, medium and large bulk tanks and cylinders • UniverGas is the newest addition to the UGI International group With the takeover and rebranding of TotalErg’s Italian LPG business in October 2017 UGI made the first step into the Italian gas market Sells LPG in small, medium and large bulk tanks • Servicing customers in 6 Central and Eastern European countries Customers primarily use LPG for heating, cooking, motor fuel, leisure activities, construction work, manufacturing, crop drying, power generation and irrigation. Sells LPG in small, medium and large bulk tanks and cylinders • • • • • • Energy Marketing Business 15 • DVEP markets natural gas and electricity, produced mainly from renewable sources, primarily to small and medium enterprises in the Netherlands • One of DVEP’s core businesses is the provision of fee-based services to other energy marketers in the Netherlands Decades of operational experience support strong brand recognition across an extensive customer base BUSINESS OVERVIEW: BRAND DESCRIPTIONS
Russia is maximizing • Europe is a net propane importer Almost half of the propane comes from the North Sea Region close to Norway and the UK Waterborne imports are rising, putting pressure on the port infrastructure UGI stores LPG at various storage facilities and terminals located across Europe. UGI has ownership interests in 10 primary storage facilities and over 60 secondary storage facilities Import terminal - SEA Import terminal - PIPELINE Import terminal - RAILCARS Terminal - REFINERY Depots / Railheads / Storage sea-borne exports to North West Europe, reducing inland flows • to Eastern Europe and exports out of the • Black Sea • Intra-Europe trade flows are increasing (approx. 30% of consumption in 2017) Hamina • UGI also manages an extensive logistics and transportation network Railcars transportation fleet is either leased, or bought as a service (i.e. railcar transportation from point A to point B). UGI leases about 140 railcars as of 6/30/2018 UGI LPG Supply Contracts by Volume • Mossmorran Esbjerg Stanlow Malaszewicze Norgal Imports from outside Europe growing (43% of consumption in 2017), particularly US Slawkow Donges FR: 40+ depots Halmeu Ambes Lavera Norway US Other EU Russia Algeria Kazakhstan UK Other non EU Germany 16 Strategically Located Supply Assets Provide Flexibility SIGNIFICANT TRANSPORTATION AND LOGISTICS ASSETS

• Diverse Supplier Base • • UGI holds supply contracts with more than 50 different suppliers. UGI has contracts with major oil and gas trading companies (including Total Raffinage France, SHV, GUNVOR and SIBUR and refineries (including Stanlow and Mosmorran) to meet its LPG supply requirements throughout Europe Supplier concentration is limited with only two countries in which a single supplier represents 50% or more of the overall volume: • • • United Kingdom Italy • Majority of Supply Contracted Limited Exposure to Energy Prices • • 95% of UGI’s supply is contracted (spot market represents less than 5% of total volumes) In Eastern Europe it is more common to actively trade on the spot market to manage volatility of demand due to the wide variety of trade patterns, supply routes, etc. • Insulated From Disruptions • Supply disruptions of a few days can easily be mitigated with UGI’s own flexibilities (contractual, inventories, cross-border etc.), therefore at minimal costs Longer supply disruption are extremely rare, but in this case the likely scenario is that UGI's position in neighboring countries would be leveraged to assist the country where the disruption occurred • 17 STRONG AND DIVERSIFIED SUPPLY CHANNELS

LPG Consumption for Energy Purposes1 Nordics 800 K tons Germany 1.7 MM tons Italy 3.2 MM tons Spain 1.5 MM tons Expand within and outside UGI’s footprint • Seek to increase/optimize market share in existing footprint • • Pursue opportunities to capture additional synergies and cost efficiencies Target entrance into large, mature markets in Europe (Italy, Germany, Spain) • UniverGas in 2017 1 Source: well-known industry report 18 M&A in Mature LPG Markets CLEAR VISIBILITY INTO GROWTH OPPORTUNITIES

Retail Energy Marketing Grew business from ground up beginning in 2012 Leveraging sales force and best practices with goal to double the existing business Acquired Dutch energy marketer DVEP in 2017 UGI International is leveraging the market expertise of UGI Corporation’s Midstream and Marketing businesses to accelerate growth Existing UGI LPG Territory Existing Gas Marketing Operations • • Existing Gas & Power Marketing Operations No UGI operations • • LNG Distribution Longer-term business objective Assessing LNG distribution opportunities Focus on U.K. and Nordic countries Motor fuel and marine markets are potentially attractive • • • • *Business acquired 2017 ** Includes sales to the exchange of renewable power 19 OPPORTUNITY BEYOND LPG

IV. Credit Highlights Private and Confidential

1 2 3 4 5 6 7 25 Experienced Management Team Strong Parent Support Mechanisms for Stable Margins History of Solid Growth and Unit Margin Stability Serving a Diverse Customer Base Mixed Product Portfolio with Recognized Brands Market Leading Positions KEY CREDIT HIGHLIGHTS

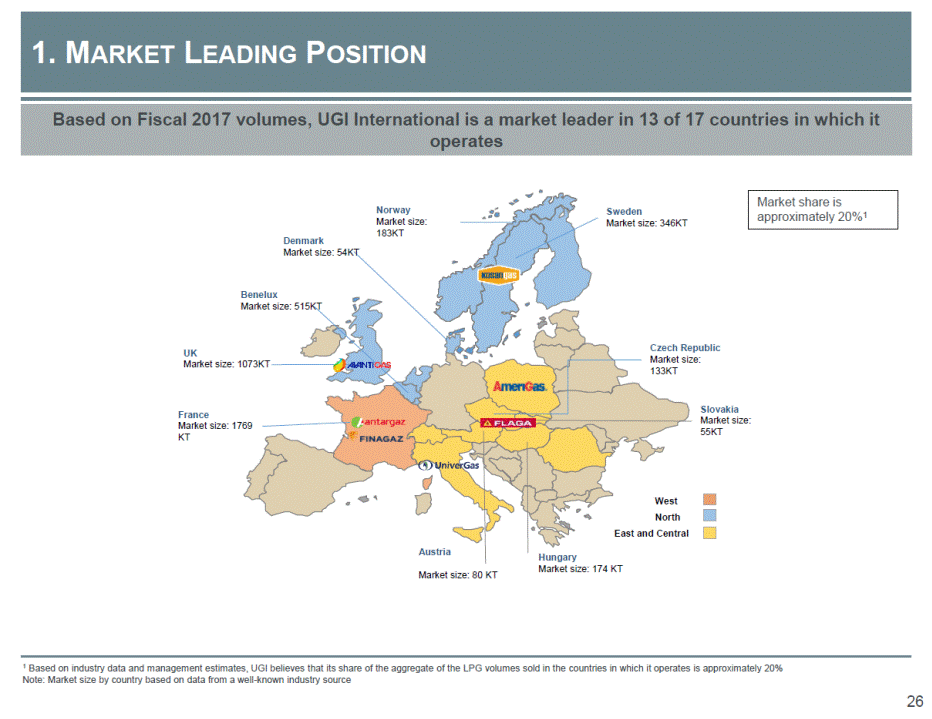
Norway Market size: 183KT Sweden Market size: 346KT Denmark Market size: 54KT Benelux Market size: 515KT Czech Republic Market size: 133KT UK Market size: 1073KT Slovakia Market size: 55KT France Market size: 1769 KT West North East and Central Austria Hungary Market size: 174 KT Market size: 80 KT 1 Based on industry data and management estimates, UGI believes that its share of the aggregate of the LPG volumes sold in the countries in which it operates is approximately 20% Note: Market size by country based on data from a well-known industry source 26 Market share is approximately 20%1 Based on Fiscal 2017 volumes, UGI International is a market leader in 13 of 17 countries in which it operates 1. MARKET LEADING POSITION
LPG for Consumers Bulk Gas Cylinder Gas Autogas LPG for Business Bulk Gas Cylinder Gas Autogas Wholesale 27 2. MIXED PRODUCT PORTFOLIO WITH RECOGNIZED BRANDS

Agriculture Large market off-season Autogas Market demand is government policy dependent Aerosol Growth expected in UK and across Europe Commercial & Industrial Stable Market which contributes more of the volume Energy Marketing New growth opportunities in the natural gas and electric sectors Residential Major growth from heating oil conversions Customer Overview UGI International’s largest volume comes from commercial industrial customers, followed by residential customers LPG Customer Breakdown by Volume • and 10% • No single customer represents more than 5% of total revenues for UGI International 20% • As of September 30, 2017, UGI had over 460,000 bulk LPG customers, ~31,500 energy marketing customers and over 18.5 million cylinders in circulation 45% 25% Commercial & Industrial Wholesale and Other Residential Agricultural 28 UGI serves customers across a broad market 3. SERVING A DIVERSE CUSTOMER BASE, WITH LIMITED CUSTOMER CONCENTRATION

Historical LPG Volume (kt) Historical Revenue ($ in millions) $2,323 $2,180 1,806 1,811 $956 1,148 1,117 2008 2009 2010 2011 2012 2013 2014 2015 2016 2017 2008 2009 2010 2011 2012 2013 2014 2015 2016 2017 Historical Unit Margins vs. Average Platt’s Cost 1 1.50 € 1.25 € 1.00 € 0.75 € 0.50 € 0.25 € 0.00 € 2008 2009 2010 2011 2012 2013 2014 2015 2016 2017 Avg. Platt's Cost UGI France euro per gallon margins 1 CIF ARA – monthly cash settled futures contract based upon the average daily prices published by Argus for propane 29 € per Gallon 1,351 1,223 833 708698679 $1,789$1,862$1,878 $1,946 $1,489 $1,125$1,059 Revenue is correlated to global commodity prices; Cash Flow is correlated to volumes 4. HISTORY OF SOLID GROWTH AND UNIT MARGIN STABILITY

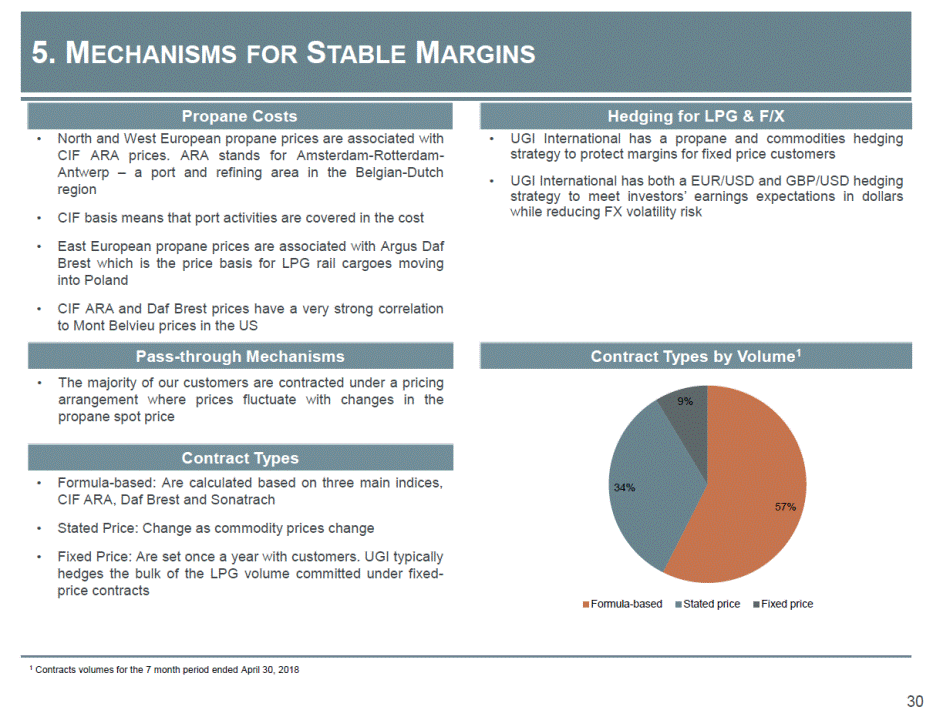
Propane Costs North and West European propane prices are associated with Hedging for LPG & F/X UGI International has a propane and commodities hedging strategy to protect margins for fixed price customers UGI International has both a EUR/USD and GBP/USD hedging • • CIF ARA prices. ARA Antwerp – a port and region stands refining for Amsterdam-Rotterdam-area in the Belgian-Dutch • strategy to meet investors’ earnings expectations while reducing FX volatility risk in dollars • CIF basis means that port activities are covered in the cost • East European propane prices are associated with Argus Daf Brest which is the price basis for LPG rail cargoes moving into Poland CIF ARA and Daf Brest prices have a very strong correlation to Mont Belvieu prices in the US • Pass-through Mechanisms The majority of our customers are contracted under a pricing arrangement where prices fluctuate with changes in the propane spot price Contract Types by Volume1 • 9% Contract Types Formula-based: Are calculated based on three main indices, CIF ARA, Daf Brest and Sonatrach Stated Price: Change as commodity prices change • 34% 57% • • Fixed Price: Are set once a year with customers. UGI typically hedges the bulk of the LPG volume committed under fixed-price contracts Formula-based Stated price Fixed price 1 Contracts volumes for the 7 month period ended April 30, 2018 30 5. MECHANISMS FOR STABLE MARGINS
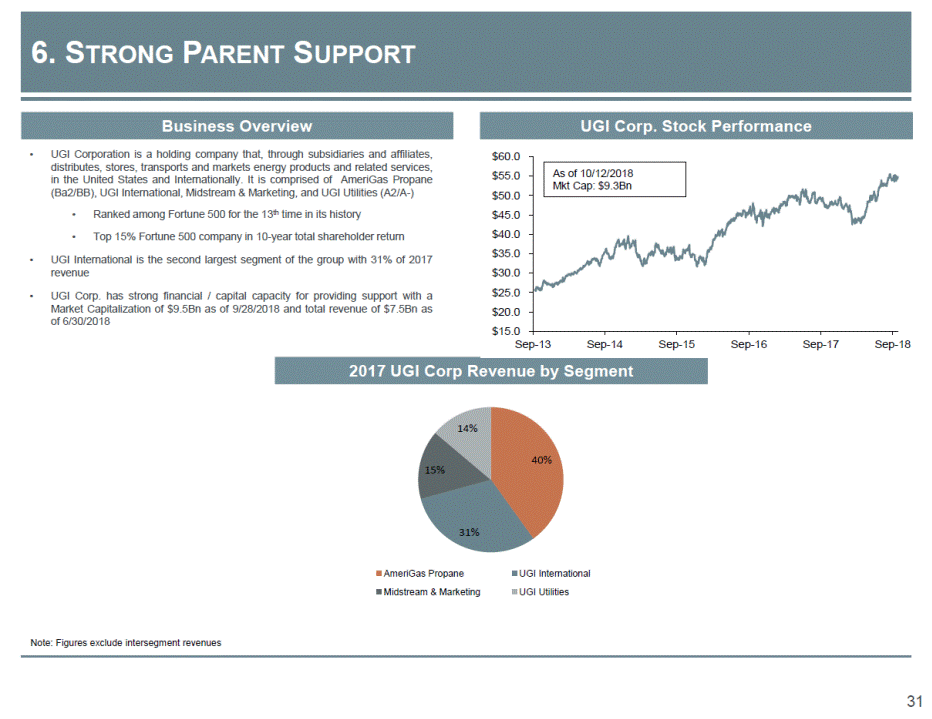
Business Overview UGI Corporation is a holding company that, through subsidiaries and affiliates, distributes, stores, transports and markets energy products and related services, in the United States and Internationally. It is comprised of AmeriGas Propane (Ba2/BB), UGI International, Midstream & Marketing, and UGI Utilities (A2/A-) UGI Corp. Stock Performance • $60.0 $55.0 $50.0 $45.0 $40.0 $35.0 $30.0 $25.0 $20.0 $15.0 • Ranked among Fortune 500 for the 13th time in its history Top 15% Fortune 500 company in 10-year total shareholder return • • UGI International is the second largest segment of the group with 31% of 2017 revenue • UGI Corp. has strong financial / capital capacity for providing support with a Market Capitalization of $9.5Bn as of 9/28/2018 and total revenue of $7.5Bn as of 6/30/2018 Sep-13 Sep-14 Sep-15 Sep-16 Sep-17 Sep-18 2017 UGI Corp Revenue by Segment 14% 40% 15% 31% AmeriGas Propane Midstream & Marketing UGI International UGI Utilities Note: Figures exclude intersegment revenues 31 As of 10/12/2018 Mkt Cap: $9.3Bn 6. STRONG PARENT SUPPORT
V. Financial Overview Private and Confidential

Revenue Gross Profit & Margin ($ in millions) ($ in millions) $1,132.9 $2,593.8 2015 2016 Gross Profit 2017 Gross Margin LTM June 2018 2015 2016 2017 LTM June 2018 Free Cash Flow1 & Conversion2 Adjusted EBITDA & Margin ($ in millions) $271.7 $256.3 $346.6 $338.4 2015 2016 Free Cash Flow 2017 FCF Conversion LTM June 2018 1 Defined as Adjusted EBITDA less capital expenditures 2 Percentage expresses conversion ratio of Free Cash Flow / Adjusted EBITDA Note: See Appendix for a reconciliation of Adjusted EBITDA to the most closely comparable GAAP measure 34 $238.5 72.5% 73.9% $117.7 70.5% 57.3% ($ in millions) $375.0 201520162017LTM June 2018 Adj. EBITDAAdj. EBITDA Margin 14.5% $205.2 18.2% 18.5% 11.5% $1,788.7 $1,862.1 $1,877.5 $996.0 $961.1 43.7% $653.4 53.5% 51.2% 36.5% Strong performance driven by volume growth and margin stability SUMMARY FINANCIAL PERFORMANCE

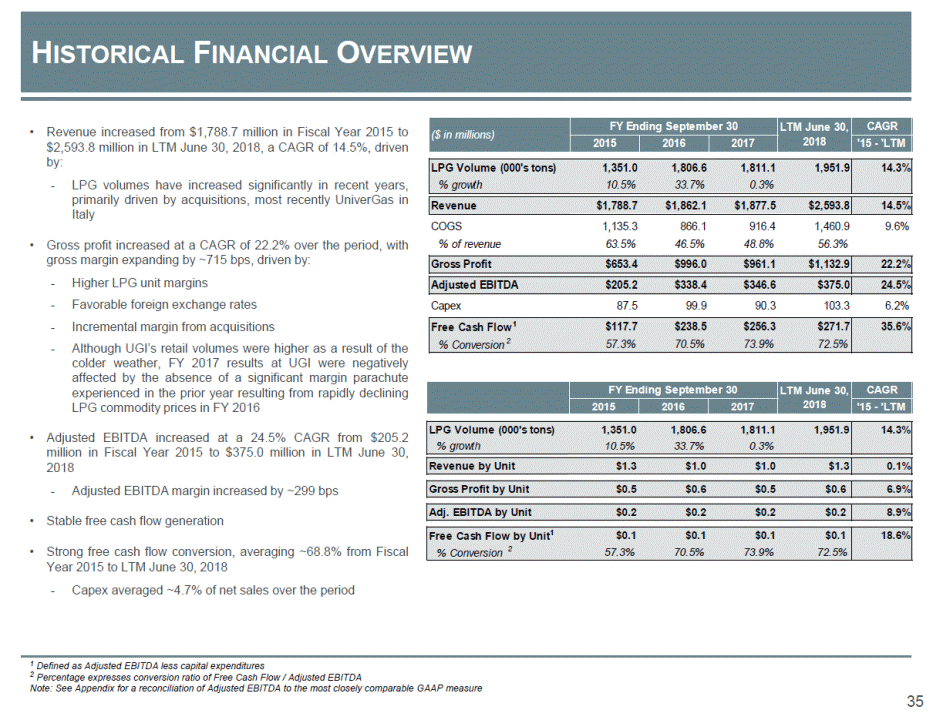
• Revenue increased from $1,788.7 million in Fiscal Year 2015 to $2,593.8 million in LTM June 30, 2018, a CAGR of 14.5%, driven by: LPG volumes have increased significantly in recent years, primarily driven by acquisitions, most recently UniverGas in Italy - COGS % of revenue 1,135.3 63.5% 866.1 46.5% 916.4 48.8% 1,460.9 56.3% 9.6% • Gross profit increased at a CAGR of 22.2% over the period, with gross margin expanding by ~715 bps, driven by: Higher LPG unit margins Favorable foreign exchange rates Incremental margin from acquisitions Although UGI’s retail volumes were higher as a result of the colder weather, FY 2017 results at UGI were negatively affected by the absence of a significant margin parachute experienced in the prior year resulting from rapidly declining LPG commodity prices in FY 2016 - - - - Capex 87.5 99.9 90.3 103.3 6.2% % Conversion • Adjusted EBITDA increased at a 24.5% CAGR from $205.2 million in Fiscal Year 2015 to $375.0 million in LTM June 30, 2018 Adjusted EBITDA margin increased by ~299 bps - • Stable free cash flow generation • Strong free cash flow conversion, averaging ~68.8% from Fiscal Year 2015 to LTM June 30, 2018 Capex averaged ~4.7% of net sales over the period - 1 Defined as Adjusted EBITDA less capital expenditures 2 Percentage expresses conversion ratio of Free Cash Flow / Adjusted EBITDA Note: See Appendix for a reconciliation of Adjusted EBITDA to the most closely comparable GAAP measure 35 Free Cash Flow by Unit1 $0.1 $0.1 $0.1 $0.1 % Conversion 2 57.3% 70.5% 73.9% 72.5% 18.6% Adj. EBITDA by Unit $0.2 $0.2 $0.2 $0.2 8.9% Gross Profit by Unit $0.5 $0.6 $0.5 $0.6 6.9% LPG Volume (000's tons) 1,351.0 1,806.6 1,811.1 1,951.9 % growth 10.5% 33.7% 0.3% 14.3% Revenue by Unit $1.3 $1.0 $1.0 $1.3 0.1% FY Ending September 30 LTM June 30, 2018 CAGR 2015 2016 2017 '15 - 'LTM Free Cash Flow 1$117.7$238.5$256.3$271.7 257.3%70.5%73.9%72.5% 35.6% Gross Profit$653.4$996.0$961.1$1,132.9 22.2% Adjusted EBITDA$205.2$338.4$346.6$375.0 24.5% LPG Volume (000's tons)1,351.01,806.61,811.11,951.9 % growth10.5%33.7%0.3% 14.3% Revenue$1,788.7$1,862.1$1,877.5$2,593.8 14.5% ($ in millions) FY Ending September 30 LTM June 30, 2018 CAGR 2015 2016 2017 '15 - 'LTM HISTORICAL FINANCIAL OVERVIEW
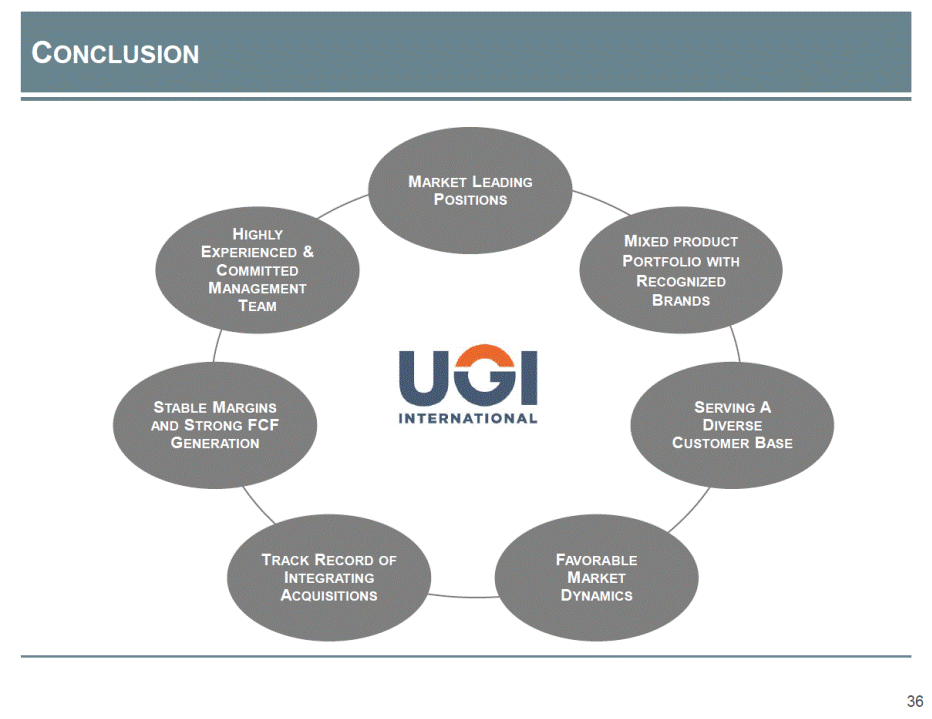
MARKET LEADING POSITIONS HIGHLY EXPERIENCED & COMMITTED MANAGEMENT TEAM MIXED PRODUCT PORTFOLIO WITH RECOGNIZED BRANDS STABLE MARGINS AND STRONG FCF GENERATION SERVING A DIVERSE CUSTOMER BASE TRACK RECORD OF INTEGRATING ACQUISITIONS FAVORABLE MARKET DYNAMICS 36 CONCLUSION
VI. Appendix Private and Confidential
Revenue 1,789 1,862 1,878 1,511 2,227 2,594 - COGS 1,135 866 916 756 1,301 1,461 Gross Profit - Other Opex - D&A 653 500 86 996 647 112 961 637 121 755 474 87 927 554 107 1,133 718 141 -/+ Other (2) 7 (2) (2) - (1) Operating Income 69 230 205 196 266 275 Other non-operating (expense) income (including equity investees) (1) (0) (24) (16) 10 2 Interest Expense (35) (24) (21) (15) (16) (22) EBT 33 206 161 164 259 255 Tax (10) (77) (9) (19) (77) (67) NI Including Noncontrolling Interests 22 129 152 146 182 188 Noncontrolling Interests - - - - 2 2 Net Income 22 129 152 146 185 191 Note: Audited financial statements (E&Y) for Fiscal Years, unaudited for interim 1 Includes the effects of rounding 38 UGI International - Historical Income Statements (1) 9M June 9M June LTM June $MM 2015 2016 2017 30, 2017 30, 2018 30, 2018 INCOME STATEMENT

Cas h and Equivalents Res tricted Cas h Accounts Receivable Inventories Derivatives Ins trum ents Prepaid Expens es and Other Current As s ets 358 - 233 67 16 11 361 1 300 84 34 38 246 1 399 81 58 29 Total Current Assets Net PP&E Goodwill Other Long-Term As s ets 685 1,101 817 224 818 1,128 926 286 813 1,128 970 316 Total Assets 2,827 3,158 3,228 Short-Term Debt (incl. Current Portion) Accounts Payable Other Short-Term Liabilities 1 164 190 96 195 259 71 209 271 Total Current Liabilities Long-Term Debt Other Long-Term Liabilities 354 779 610 550 760 593 550 684 576 Total Liabilities Equity 1,744 1,084 1,904 1,254 1,810 1,417 Total Liabilities & Equity 2,827 3,158 3,228 Note: Audited financial statements (E&Y) for Fiscal Years, unaudited for interim 1 Includes the effects of rounding 39 UGI International - Historical Balance Sheets (1) June 30, $MM 2016 2017 2018 BALANCE SHEET

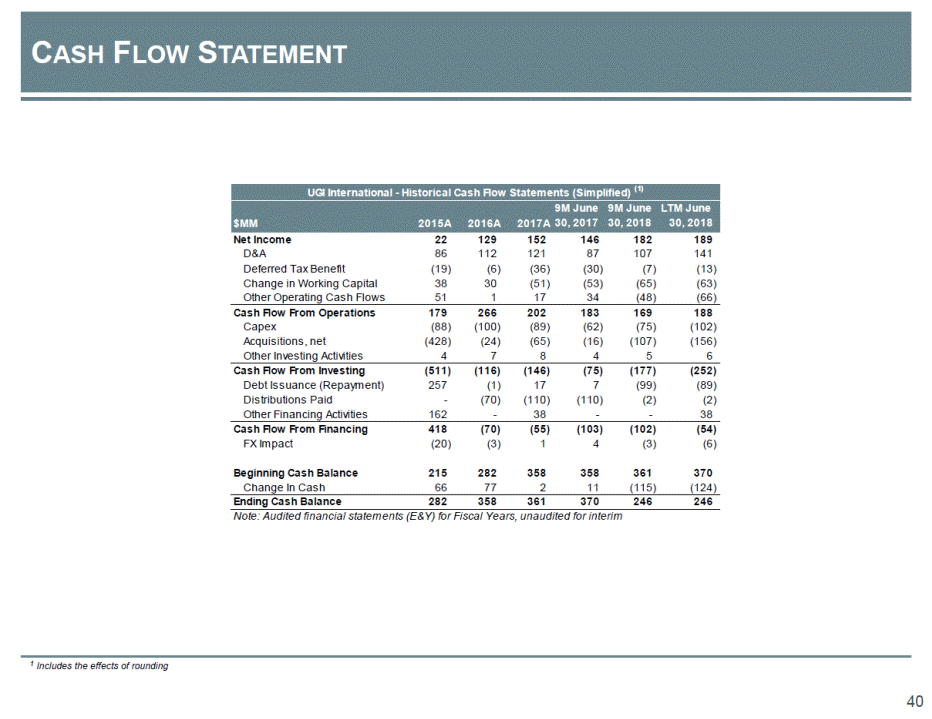
Net Income D&A Deferred Tax Benefit Change in Working Capital Other Operating Cas h Flows 22 86 (19) 38 51 129 112 (6) 30 1 152 121 (36) (51) 17 146 87 (30) (53) 34 182 107 (7) (65) (48) 189 141 (13) (63) (66) Cash Flow From Operations Capex Acquis itions , net Other Inves ting Activities 179 (88) (428) 4 266 (100) (24) 7 202 (89) (65) 8 183 (62) (16) 4 169 (75) (107) 5 188 (102) (156) 6 Cash Flow From Investing Debt Is s uance (Repaym ent) Dis tributions Paid Other Financing Activities (511) 257 - 162 (116) (1) (70) - (146) 17 (110) 38 (75) 7 (110) - (177) (99) (2) - (252) (89) (2) 38 Cash Flow From Financing FX Im pact 418 (20) (70) (3) (55) 1 (103) 4 (102) (3) (54) (6) Beginning Cash Balance Change In Cas h 215 66 282 77 358 2 358 11 361 (115) 370 (124) Ending Cash Balance 282 358 361 370 246 246 Note: Audited financial statem ents (E&Y) for Fiscal Years, unaudited for interim 1 Includes the effects of rounding 40 UGI International - Historical Cash Flow Statements (Simplified) (1) 9M June 9M June LTM June $MM 2015A 2016A 2017A 30, 2017 30, 2018 30, 2018 CASH FLOW STATEMENT
Net Income Attributable to UGI International + Net income attributable to noncontrolling interests + Income Tax + Interest Expense 22 - 10 35 129 - 77 24 152 - 9 21 146 - 19 15 185 (2) 77 16 191 (2) 67 22 + Depreciation & Amortization 86 112 121 87 107 141 EBITDA +/-on commodity derivative instruments not associated with current-period transactions 154 342 302 266 382 418 28 (32) (19) 7 (39) (65) +/-on certain foreign currency derivative instruments - - 24 16 (24) (16) + Integration and acquisition expenses associated with Finagaz2 23 28 40 22 21 39 Adjusted EBITDA 205 338 347 311 339 375 1 Includes the effects of rounding 2 Represents expenses relating to the integration of Totalgaz SAS (now known as “Finagaz”) subsequent to its acquisition on May 29, 2015 41 Adj. EBITDA Reconciliation (1) 9M June9M June LTM June $MM 2015A 2016A 2017A 30, 2017 30, 2018 30, 2018 ADJ. EBITDA RECONCILIATION


