Attached files
| file | filename |
|---|---|
| EX-99.3 - EX-99.3 - Nine Energy Service, Inc. | d613649dex993.htm |
| EX-99.2 - EX-99.2 - Nine Energy Service, Inc. | d613649dex992.htm |
| EX-99.1 - EX-99.1 - Nine Energy Service, Inc. | d613649dex991.htm |
| EX-2.1 - EX-2.1 - Nine Energy Service, Inc. | d613649dex21.htm |
| 8-K - 8-K - Nine Energy Service, Inc. | d613649d8k.htm |
Exhibit 99.4
This summary provides a brief overview of information contained elsewhere in this offering memorandum. Because it is abbreviated, this summary does not contain all of the information that you should consider before investing in the notes. You should read the entire offering memorandum carefully before making an investment decision, including the information presented under “Cautionary note regarding forward-looking statements,” “Risk factors,” “Unaudited pro forma condensed combined financial information” and “Management’s discussion and analysis of financial condition and results of operations” and the historical consolidated financial statements and related notes thereto included elsewhere in this offering memorandum.
Company overview
We are a leading North American onshore completion and production services provider that targets unconventional oil and gas resource development. We partner with our exploration and production (“E&P”) customers across all major onshore basins in both the U.S. and Canada to design and deploy downhole solutions and technology to prepare horizontal, multistage wells for production. We focus on providing our customers with cost-effective and comprehensive completion solutions designed to maximize their production levels and operating efficiencies. We believe our success is a product of our culture, which is driven by our intense focus on performance and wellsite execution as well as our commitment to forward-leaning technologies that aid us in the development of smarter, customized applications that drive efficiencies.
We provide our comprehensive completion solutions across a diverse set of well-types, including on the most complex, technically demanding unconventional wells. Modern, high-intensity completion techniques are a more effective way for our customers to maximize resource extraction from horizontal oil and gas wells. These completion techniques provide improved estimated ultimate recovery per lateral foot and a superior return on investment, which make them attractive to operators despite their associated increased well cost. We compete with a limited number of service companies for the most intricate and demanding projects, which are characterized by extended reach horizontal laterals, increased stage counts per well and increased proppant loading per lateral foot. As stage counts per well and multi-well pads increase, so do our operating leverage and returns, as we are able to complete more jobs and stages with the same number of units and crews. Service providers for these demanding projects are selected based on their technical expertise and ability to execute safely and efficiently, rather than only price.
We offer a variety of completion applications and technologies to match customer needs across the broadest addressable completions market. Our comprehensive well solutions range from cementing the well at the initial stages of the completion, preparing the well for stimulation, isolating all the stages of an extended reach lateral, and drilling out plugs and performing associated remedial work as production comes online. Our completion techniques are specifically tailored to the customer and geology of each well. At the initial stage of a well completion, our lab facilities produce customized cementing slurries used to secure the production casing to ensure well integrity throughout the life of the well. Once the casing is in place, we utilize our
1
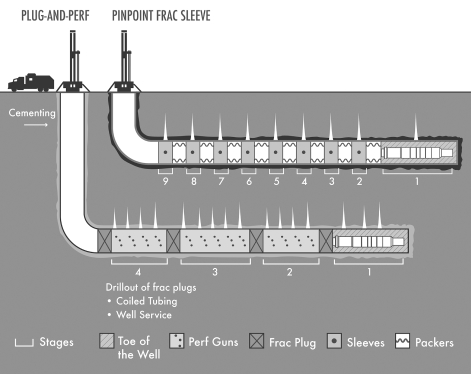
proprietary tools at the toe (end) of the well, often called stage one, to prepare for the well stimulation process. We provide customers with plug-and-perf or pinpoint frac sleeve system technology to complete the remaining stages of the well. Through our wireline units, we provide plug-and-perf services that, when combined with our fully-composite or dissolvable frac plugs, create perforations to isolate and divert the fracture to the correct stage. Our pinpoint frac sleeve system involves packers, either hydraulic or swellable, to isolate sections of the wellbore and frac sleeves to provide access to each stage for stimulation and production. Our equipment also includes high-specification, large diameter coiled tubing units and workover rigs that are capable of reaching the farthest depths for the removal of plugs and cleaning of the wellbore to prepare for production. Once a well is producing, we are able to offer a range of production enhancement and well workover services through our fleet of well service rigs and ancillary equipment.
The following graphic provides a summary of our comprehensive well solutions that span the life cycle of a well completion.
Magnum Acquisition overview
On October 15, 2018, we entered into a Securities Purchase Agreement (the “Magnum Purchase Agreement”) to acquire (the “Magnum Acquisition”) all of the equity interests of Magnum Oil Tools International, LTD, Magnum Oil Tools GP, LLC and Magnum Oil Tools Canada Ltd. (collectively, “Magnum”). Under the terms of the Magnum Purchase Agreement, consideration will consist of approximately $334.5 million, subject to customary adjustments, in cash (the “Cash Consideration”), 5,000,000 shares of our common stock as well as potential future earn-out payments. The Magnum Acquisition is subject to antitrust clearance and other customary closing conditions. The Magnum Purchase Agreement contains customary representations and
2
warranties, covenants, indemnification and termination provisions. See “—Recent developments—Acquisition of Magnum” for more detail on the transaction.
Magnum Acquisition rationale
Magnum is a leading oilfield completion tools company that is focused on the development of innovative tools for unconventional oil and gas resource development. Magnum has a broad offering of proprietary downhole completions consumables products, including a comprehensive line of dissolvable and composite frac plugs; disk subs, including intervention-less designs, for wellbore isolation and casing flotation device applications; and dissolvable frac balls and composite cement retainers. We believe that Magnum is a leader by market share in the United States for dissolvable frac plugs, which are increasingly being used within extended reach laterals.
We believe that successful completion of the Magnum Acquisition will substantially enhance Nine’s completion tools portfolio. Through the Magnum Acquisition, we believe that we would gain a first mover advantage in dissolvable plugs and position our company as a premier provider of differentiated isolation tools. We expect the Magnum Acquisition will further enable us to continue to develop a business that is less labor-intensive, less capital-intensive, more free cash flow generative and differentiated. We expect that the Magnum Acquisition will more than double the proportion of our revenue that is derived from completion tools. In addition, we expect that synergies resulting from the Magnum Acquisition could provide an accelerant to our other service offerings, allowing us to leverage current capabilities to improve operational efficiencies, gain market share and lower costs. As a result, we expect the Magnum Acquisition to be accretive to our earnings per share, our margins, and long term returns on invested capital.
Our services
We operate in two segments: Completion Solutions and Production Solutions. Our Completion Solutions segment provides services integral to the completion of unconventional wells through a full range of tools and methodologies. Our Production Solutions segment provides a range of production enhancement and well workover services that are performed with a well servicing rig and ancillary equipment.
Completion Solutions
The following is a description of the primary service offerings and deployment methods within the Completion Solutions business segment:
Cementing services: Our cementing services consist of blending high-grade cement and water with various solid and liquid additives to create a cement slurry that is pumped between the casing and the wellbore of the well. We currently have three high-quality laboratory facilities capable of designing and testing all of the current industry cement designs. The laboratory facilities operate twenty-four hours a day and are fully staffed by qualified technicians with the latest equipment and modeling software. Additionally, our technicians and engineers ensure that all tests are performed to American Petroleum Institute specifications and results are delivered to customers promptly. Our cement slurries are designed to achieve the proper cement thickening time, compressive strength and fluid loss control. Our slurries can be modified to address a wide range of downhole needs of our E&P customers, including varying well depths, downhole
3
temperatures, pressures and formation characteristics. We deploy our slurries by using our customized design twin-pumping units, which are fully redundant and significantly decrease our risk of downtime due to mechanical failure. From January 2014 through June 2018, we completed approximately 13,000 cementing jobs, with an on-time rate of approximately 90%. Punctuality of service has become one of the primary metrics that E&P operators use to evaluate the cementing services they receive. Key contributors to our 90% on-time rate include our lab capabilities, personnel, close proximity to our customers’ acreage, dual-sided bulk loading plants and our service-driven culture.
Completion tools: We provide unconventional and conventional downhole solutions and technology used for multistage completions. Our comprehensive completion service offerings are complemented by our unconventional open hole and cemented completion tool products, such as liner hangers and accessories, fracture isolation packers, frac sleeves, stage one prep tools, fully composite and dissolvable frac plugs and specialty open hole float equipment and centralizers. Our completion tools provide pinpoint frac sleeve system technologies that enable comparable rates per stage while providing more control over fracture initiation. A few examples of our innovative portfolio of completion tools are: (i) the Scorpion Fully-Composite Plug™, a patented packer-style fully composite plug designed to provide zonal isolation in a multi-stage well completion; we offer a diverse product group of fully-composite plugs designed for 3.5” to 5.5” well casings as well as a unique Scorpion Extended Range plug, which is used in demanding well applications where operators have to negotiate through internal diameter restrictions, (ii) the Scorpion Dissolvable Plug, a high performance plug designed to provide zonal isolation that is made entirely from proprietary materials that dissolve over time, leaving the wellbore unobstructed for production and eliminating the risk and costs of conventional plug removal, (iii) the SmartStart PLUS™, an interventionless time-delayed pressure-activated sleeve that we have the exclusive distribution rights to in the northeastern U.S. and with certain customers in other regions, that eliminates the need for tubing or pipe-conveyed perforating when completing the toe stage of horizontal wells, (iv) the Storm Re-Frac Packer™, a system that allows our customers to re-stimulate their existing wells using standard size plug-and-perf procedures to extend and enhance their production profiles with minimal flow restriction during stimulation, (v) the FlowGun®™, a stage one interventionless casing-conveyed perforating technology that eliminates the need to run wireline or coil tubing and requires no electronic detonation allowing our customers to perform a maximum pressure test and perforate stage one more efficiently with less risk and with no lateral length limitations, (vi) the Coil Frac Sleeve System, a system that utilizes coiled tubing to deploy a resettable frac packer, that we have the exclusive distribution rights to in the U.S., which is used to open and isolate frac sleeves that have been installed as an integral part of the casing, and (vii) the EON Ball Drop system, an interventionless single-size ball activated pinpoint frac sleeve system, that we have exclusive distributions rights to in the U.S. and Canada. The BreakthruTM Casing Flotation Tool delivers a dependable, a durable and cost-efficient method for floating casing to bottom in long lateral wells. The barrier is made of a proprietary material that shatters upon activation, eliminating the need for a debris sub. Our systems provide completion efficiencies at the wellsite by reducing our customers’ equipment needs and stimulation time and allowing for specific zonal treatment. From March 2011 through June 2018, we deployed approximately 136,000 isolation and stage one tools and approximately 22,000 frac sleeves for downhole completions.
With the acquisition of Magnum, we will add a number of differentiated and patented downhole technologies to our completion tools portfolio including: (i) proprietary and patented Magnum Vanishing Plug (MVPTM ) and Hollow PointTM Dissolvable Frac Plugs, designed to provide
4
wellbore/frac isolation, which are fully dissolvable with the presence of fluid and targeted well temperatures (including low, mid and high temp offerings (100-360 degrees Fahrenheit) with applications across all basins within the U.S., Canada and the International markets); (ii) a patented suite of five composite frac plug lines purpose-designed to provide wellbore isolation in nearly any application, with offerings ranging in sizes from 2 3/8” to 13 3/8”, extended reach capabilities, and high temperature and high pressure applications, which can enable operators to enhance the safety, efficiency and economics of their well completions; and (iii) the patented MagnumDiskTM wellbore isolation technology, which includes a comprehensive range of tools designed to isolate pressure in a variety of casing and tubing applications.
Additionally, we offer a portfolio of completion technologies used for completing the toe stage of a horizontal well, as well as fully-composite, dissolvable and extended-range frac plugs to isolate stages during plug-and-perf operations.
Wireline services: Our wireline services involve the use of a wireline unit equipped with a spool of wireline that is unwound and lowered into oil and gas wells to convey specialized tools or equipment for well completion, well intervention or pipe recovery. Our wireline units are equipped with the latest technology utilized to service long lateral completions, including head tension tools, ballistic release tools and addressable switches. The majority of our wireline work consists of plug-and-perf completions, which is a multistage well completion technique for cased-hole wells that consists of deploying perforating guns to a specified depth. We deploy proprietary specialized tools like our fully-composite frac plugs through our wireline units. From January 2014 through June 2018, we completed approximately 88,000 wireline stages in the U.S. with a success rate of over 99%.
Coiled tubing services: Coiled tubing services perform wellbore intervention operations utilizing a continuous steel pipe that is transported to the wellsite wound on a large spool in lengths of up to 25,000 feet. Coiled tubing provides a cost-effective solution for well work due to the ability to deploy efficiently and safely into a live well using specialized well-control equipment. The live well work capability limits the customer’s risk of formation damage associated with “killing” a well (the temporary placement of heavy fluids in a wellbore to keep reservoir fluids in place), while allowing for safer operations due to minimal equipment handling. Coiled tubing facilitates a variety of services in both new and old wells, such as milling, drilling, fishing, production logging, artificial lift installation, cementing, stimulation and restimulation services. In addition, our units are also used in conjunction with pinpoint hydraulic fracturing operations. Most of our coiled tubing units are capable of reaching total measured depths of 21,500 feet and beyond, including lateral lengths in excess of 12,500 feet, keeping pace with the industry’s most challenging downhole environments. While we specialize in larger-diameter (2 3/8” and 2 5/8”) applications, we also offer 2” and 1 1/4” diameter solutions to our customers. From April 2014 through June 2018, we have performed approximately 6,700 jobs and deployed approximately 136 million running feet of coiled tubing, with a success rate of over 99%.
Production Solutions
The following is a description of the primary service offerings conducted within the Production Solutions business segment:
Well services: Our well servicing business encompasses a full range of services performed with a mobile well servicing rig (or workover rig) and ancillary equipment throughout a well’s life cycle from completion to plugging and abandonment. Our rigs and personnel install and remove
5
downhole equipment and eliminate obstructions in the well to facilitate the flow of oil and natural gas, often immediately increasing a well’s production. We believe the production increases generated by our well services substantially enhance our customers’ returns and significantly reduce their payback periods. Activities performed with our well servicing rigs can range from the milling of plugs following a plug-and-perf completion, to the installation and repair of artificial lift, to the ultimate plug and abandonment of a depleted well. Key components of our well services success include our geographic footprint, employee culture, fleet of rigs and inventory of equipment. Our operations extend across six major onshore U.S. basins, and our employee culture fosters local relationships within this expansive geographic footprint through excellent customer service and basin-level expertise.
We utilize a fleet of more than 100 rigs, approximately 40% of which are capable of performing completion-oriented work. This fleet and the inventory of equipment maintained at each of our regional locations are tailored to the needs of our customers in each particular basin. The high-specification rigs we utilize are engineered to perform in the most demanding laterals being drilled in the U.S. today. From January 2014 through June 2018, we operated more than 998,000 rig hours. According to the Association of Energy Service Companies, only 51% of industry reported well service rigs were active or available from January 2015 through June 2018. In contrast, approximately 65% of our rigs have remained utilized in the same period.
Our competitive strengths
We believe that the following strengths differentiate us from many of our competitors and will contribute to our ongoing success:
Technology-driven business model enhances ability to capitalize on industry trend towards more technically demanding unconventional wells
We invest in innovative technology and equipment designed for modern completion and production techniques that increase efficiencies and production for our customers. North American unconventional onshore wells are increasingly characterized by multi-well pads, extended lateral lengths, tighter spacing between hydraulic fracturing stages, increased cluster density and heightened proppant loads. Drilling and completion activities for wells in unconventional resource plays are extremely complex, and downhole risks and operating costs increase as the complexity and lateral length of these wells increase. For these reasons, E&P companies with complex wells generally prefer to partner with technically-proficient, established service companies that are capable of providing the necessary equipment and techniques to complete the services safely, efficiently and with a focus on operational excellence. We believe that these unconventional wells will comprise a growing portion of the market, and that our comprehensive completion service and solutions offerings position us well to capture this growing market.
We have developed or have rights to a suite of proprietary downhole tools, products and techniques, such as the Scorpion Fully-Composite Plug™, Scorpion Dissolvable Plug, SmartStart PLUS™, Flow Gun®™, Coil Frac Sleeve System, EON Ball Drop System and Storm Re-Frac Packer™, through both internal resources as well as strategic partnerships with manufacturers and engineering companies looking for a reliable and expansive channel to market. We have also made an investment in an advanced electromagnetic (EM) fracture monitoring service, Deep Imaging Technologies, which allows our customers to measure fracture efficacy, informing well
6
spacing and infill development decisions. We will further enhance our completion tools portfolio through our pending Magnum Acquisition. Magnum has a broad offering of proprietary downhole completions consumables products, including a comprehensive line of dissolvable and composite frac plugs; disk subs, including intervention-less designs, for wellbore isolation and casing flotation device applications; and dissolvable frac balls and composite cement retainers. We believe that Magnum is a leader by market share in the United States for dissolvable frac plugs, which are increasingly being used within extended reach laterals.
We believe we have become a “go-to” service provider for piloting new technologies across the U.S. and Canada because of our service quality and scale. These strategic partnerships provide us and our customers with access to unique downhole technology from independent innovators. This also allows us to minimize exposure to potential technology adoption risks and the significant costs associated with developing and implementing research and development (“R&D”) internally. Our internal resources are focused on evolving our existing proprietary tools to stay on trend and ensure quicker, lower cost completions for our customers.
Customized solutions offerings and a differentiated level of customer service
We are able to provide customized solutions for all completion types across North America, including plug-and-perf, pinpoint frac sleeve systems and hybrid wells. Our comprehensive completion service offerings, together with our complementary production services, enable us to deliver the most value to our customers throughout the life of the well. Through our strong relationships with our customers, we maintain a continuous dialogue and real-time feedback loop, allowing us to remain nimble and evolve our service offerings in concert with changing demands from our customers. We believe that our ability to be highly responsive to customers and nimbly address requests for changes in service delivery is a distinct competitive advantage and a cornerstone of our brand.
Established presence in all major onshore basins in both the U.S. and Canada
We operate in all major onshore basins in both the U.S. and Canada, including the Permian Basin, Marcellus and Utica Shales, Eagle Ford Shale, SCOOP / STACK Formation, Bakken Formation, Haynesville Formation and Western Canada Sedimentary Basin. We provide our services through strategically placed operating facilities located in-basin throughout North America. This local presence allows us to quickly respond to customer demands and operate efficiently. Additionally, through our extensive footprint, we are able to track and implement best practices around completion and production trends and technology across all divisions and geography.
7
The following map illustrates our and Magnum’s geographic footprint.
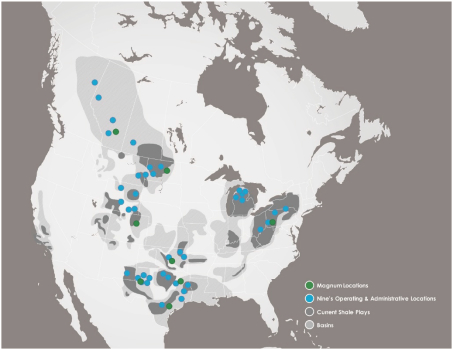
We believe that our strategic geographic positioning will benefit us as activity increases in our core operating areas. Our broad geographic footprint provides us with exposure to the ongoing recovery in drilling and completion activity and will allow us to opportunistically pursue new business in basins with the most active drilling environments.
Returns-focused business model with high operational leverage
We are focused on generating attractive returns on capital. Our completion and production services require less equipment and fewer people than many other oilfield service lines. Unlike pressure pumping, the increase in oil and gas well completion intensity does not significantly impact our equipment. The rising level of completion intensity in our core operating areas contributes to improved margins and returns for us on a per job basis. This provides us significant operational leverage, and we believe positions us well to continue to generate attractive returns on capital as industry activity increases and the market for oilfield services improves. As part of our returns-focused approach to capital spending, we are focused on maintaining a capital efficient program with respect to the development of new products. We have a balanced approach to R&D and strategic acquisitions and partnerships with oilfield product development companies, who view us as an attractive distribution platform for their products. This allows us to benefit from new products and technologies while minimizing our R&D expenditures.
Experienced and entrepreneurial management team and board of directors with a successful track record of executing growth and acquisition strategies
The members of our management team and board of directors have a blend of operating, financial and leadership experience in the industry, that we believe provides us with a competitive advantage. We have a deep management team, with experienced mid-level and field
8
managers, many of whom previously started and managed smaller independent onshore oilfield services companies. Our management team has an average of over 20 years of experience in the oilfield service industry, and our field managers have expertise in the geological basins in which they operate and understand the regional challenges that our customers face. We believe this experience provides our management team with an in-depth understanding of our customers’ needs, which enhances our ability to deliver innovative, customer-driven solutions throughout varying industry cycles, which in turn strengthens our relationships with our customers. Many members of our senior management team are entrepreneurs and company founders who joined our company and remain major stockholders, and over 80% of company founders who joined our company continue to be a part of our company today. This is an important part of our growth-focused corporate culture. We focus on partnering with the right management teams and companies, which has enabled us to identify and acquire high-quality businesses with a similar culture to us and synergistically integrate them into our existing operation. Nine has completed four acquisitions, not including the Magnum Acquisition, as well as the Combination with Beckman. We believe this significant experience in identifying and closing acquisitions will help us identify additional attractive acquisition opportunities in the future. In addition, we believe that our extensive industry contacts and those of SCF Partners, L.P. (“SCF Partners”), our equity sponsor, will facilitate the identification of acquisition opportunities. We also believe we will benefit from SCF Partners’ investment experience in the oilfield services sector and its expertise in mergers and acquisitions.
Conservative balance sheet and flexibility to selectively pursue accretive growth avenues
We plan to continue to maintain a conservative balance sheet, which will allow us to better react to potential changes in industry and market conditions and opportunistically grow our business. As of June 30, 2018, on a pro forma basis giving effect to this offering as well as the repayment and termination of our existing credit facility, the entry into our new credit facility, the Magnum Acquisition and the payment of related fees and expenses (collectively, the “Transactions”), each of which are expected to occur in connection with the consummation of this offering, as of June 30, 2018, we would have had approximately $26.1 million of cash on hand and approximately $103.2 million of undrawn capacity under the borrowing base under our new credit facility (net of an approximate $0.7 million outstanding letter of credit). See “—Recent developments—Refinancing of our existing credit facility and entry into our new credit facility” for information regarding our new credit facility. We believe our liquidity will provide us with the financial flexibility to quickly and opportunistically capitalize on opportunities that may arise to grow and increase our value. Given our broad geographic and services footprint and strong reputation in the industry, we believe that we will have significant optionality to grow in existing service areas or expand into new areas as demanded by our customers.
9
Our business strategies
Our company strategy is very focused on returns on invested capital achieved through serving our customers’ needs to help maximize production and drive cost efficiencies through a unique combination of technology and service. We expect to achieve this through the deployment of the following strategies:
Continue to innovate and enhance our technology-driven offerings
We intend to continue to invest and develop new technologies, techniques and equipment to provide our customers with continuously innovating services and the tools of tomorrow needed to efficiently complete and produce the most complex wells. The growth of unconventional oil and gas resources drives the need for new technologies, completion techniques and equipment to increase recovery rates, lower production costs and accelerate field development. Our customers operate in an extremely competitive environment, and they demand technology-driven service and innovative tools suitable for the most modern completion and production techniques. We have instilled in our employees a culture of innovation and open communication with both our customers and management to be the first responders to our customers’ need for the next innovation or tool. We will continue to listen and learn from operators and experts in the field to facilitate a fast and informative feedback loop that allows us to stay ahead of customers’ needs and share industry best practices across basins. With this real-time information, we seek strategic partnerships and accretive acquisitions with companies and innovators that specialize in developing new production equipment and technologies. We believe that our real-time access to information and focus on technology-driven innovation and efficiency will continue to differentiate us from our competitors and will drive our success with customers that demand a technologically focused and tailored approach.
Continue to focus on service quality and flawless wellsite execution
A successful completion requires both the implementation of a variety of technologies and the commitment to wellsite execution. As well complexities continue to increase, service quality becomes a key criteria used by operators in selecting their oilfield service providers. An E&P operator’s downhole risks and operating costs increase as the complexity and lateral lengths of wells increase. Our customers demand high quality service with fast and nimble responses. We seek to meet this demand by developing our employees through extensive classroom and on-the-job training, as well as health, safety and environmental (“HSE”) and the U.S. Department of Transportation (the “DOT”) training programs. This also enables us to have a flatter organization and empower employees throughout all levels of the company. Our employees’ extensive knowledge and training allows for more autonomy in the field, ultimately reducing response time and establishing trust with our customers. We continue to develop and implement comprehensive metrics and company standards while allowing our regional leadership to operate autonomously in accordance with those standards. We believe this nimble, customer-focused approach to service will allow us to increase efficiencies for our customers and drive success for our company.
Continue to capitalize on efficiencies being demanded by our customer base
Our customers are increasingly focused on driving efficiencies in drilling and completion techniques of unconventional wells. This focus has led to an increase in the adoption of pad
10
drilling, zipper fracs and other techniques intended to reduce the time and cost inherent in drilling and completing wells. We believe that we are well-positioned to benefit from these efficiencies, which allow us to complete a greater number of jobs (such as stages, plugs or drillouts) with fewer workers and minimal capital maintenance and equipment, ultimately generating additional revenue and better margins. Prior to the adoption of longer laterals, more stages and pad drilling, the completion of 100 stages would require approximately ten wireline, coil or workover units (one unit per well). The increase in operating efficiencies of our E&P customers produced by developments in horizontal drilling have produced efficiencies in our operations. For example, operators in the current environment are completing 100 stages at a single pad, allowing us to send one unit and two crews to location. We now require less people and equipment to generate the same stage counts or drillouts. In 2014, we averaged approximately 5.5 stages per employee per month compared to approximately 7.1 in 2016, approximately 10.2 in 2017 and approximately 14.7 in the first six months of 2018. Additionally, we completed approximately 27 stages per well in 2014, 28 stages per well in 2015, 40 stages per well in 2016 and 48 stages per well in 2017. We have and will continue to be aligned to our customers’ efficiencies, which drive down our costs and increase our utilization.
Leverage our strategic footprint to pilot new technologies and share best practices
Our strategy includes leveraging our broad geographic and services footprint, customer network and strong reputation in the industry to serve as a channel to market for new and innovative technology and communicate best practices internally and to our customers. Having a local presence within each basin allows us to provide more responsive customer service, as well as significant exposure to every type of completion methodology and technology across North America. This expertise and knowledge is quickly shared across the company allowing us to inform customers, modify techniques and introduce new technology across all basins.
For example, we have successfully leveraged our Canadian team that has helped introduce new technologies across the company, including a new coated wireline recently deployed in the Northeast, SCOOP / STACK formation and the Permian Basin. We will continue to bring innovative best practices to our customers and alter completion applications to help customers maximize production. With a broad geographic footprint, we are also the ideal service provider for manufacturing, engineering and independent innovators looking for a reliable channel to market for new technology. We provide exposure to a large customer base across all major North American basins coupled with a high quality sales team with the ability to capture market share and promote new products in every onshore basin in North America. We will continue to establish regional locations to maintain high quality customer service, implement best practices and seek strategic partnerships.
Grow our product and service offerings through internal development, strategic partnerships and accretive acquisitions
We anticipate demand for our services to increase over the medium- and long-term throughout all onshore basins in North America. We plan to drive growth both organically and through strategic partnerships and accretive acquisitions. Our organic growth strategies, which focus on continuing to provide customers with exceptional service and a comprehensive array of technology-based solutions, give us a cost-effective way of growing our revenue base by leveraging our existing infrastructure and customer network. Our organic growth initiatives target areas that are expected to provide the highest economic return while taking into
11
consideration strategic goals, such as growing or maintaining our key customer relationships. To complement our organic growth, we intend to continue to enter into strategic partnerships, including with technology-focused companies to enhance our ability to provide technologically-advanced solutions at a comparatively lower cost. We also intend to continue to actively pursue targeted, accretive acquisitions, such as the Magnum Acquisition, that will enhance our portfolio of products and services, market positioning or geographic presence. We seek potential acquisition targets with cultures compatible with our recognized service quality and forward-looking company culture. While we operate in all major onshore basins in both the U.S. and Canada, we do not currently offer all of our services in each of these basins. We plan to efficiently leverage our existing infrastructure in select basins to grow the breadth of our service offerings. We believe this will provide us with a cost-effective way to offer additional, complementary services to existing customers, thereby offering them a more comprehensive service offering and allowing us to respond more quickly to their needs and enhancing our revenue generation potential.
Maintain a strong balance sheet with ample liquidity to preserve operational and strategic flexibility
We intend to maintain financial flexibility through a conservative approach to managing our balance sheet, which positions us to take advantage of growth opportunities as they arise and allows us to better react to changes in commodity prices and related demand for our services as well as overall market conditions. We carefully manage our liquidity and debt position through monitoring our cash flows and spending levels. On a pro forma basis giving effect to the Transactions, as of June 30, 2018, we would have had approximately $26.1 million of cash on hand and approximately $103.2 million of undrawn capacity under the borrowing base under our new credit facility (net of an approximate $0.7 million outstanding letter of credit).
Recent developments
Acquisition of Magnum
On October 15, 2018, we entered into the Magnum Purchase Agreement to acquire all of the equity interests of Magnum. Under the terms of the Magnum Purchase Agreement, consideration will consist of approximately $334.5 million, subject to customary adjustments, in cash, 5,000,000 shares of our common stock as well as potential future earn-out payments. For a discussion of the potential future earn-out payments, please see Note 1 to the unaudited pro forma condensed combined financial information included under “Unaudited pro forma condensed combined financial information.”
Magnum is a leading oilfield completion tools company that is focused on the development of innovative tools for unconventional oil and gas resource development. Magnum has a broad offering of proprietary downhole completions consumables products, including a comprehensive line of dissolvable and composite frac plugs; disk subs, including intervention-less designs, for wellbore isolation and casing flotation device applications; and dissolvable frac balls and composite cement retainers. We believe that Magnum is a leader by market share in the United States for dissolvable frac plugs, which are increasingly being used within extended reach laterals. Supporting its innovative, differentiated completion tools portfolio and proven track record of successful and forward-thinking R&D is Magnum’s strong product sales and marketing team that sells products from its seven locations covering the major U.S. basins and its Calgary-area location as well as through direct sales effort and contract companies.
12
Upon consummation of the Magnum Acquisition, we expect Magnum’s operations will be included in our Completions Solutions segment.
We believe that successful completion of the Magnum Acquisition will substantially enhance Nine’s completion tools portfolio. Through the Magnum Acquisition, we believe that we would gain a first mover advantage in dissolvable plugs and position our company as a premier provider of differentiated isolation tools. We expect the Magnum Acquisition will further enable us to continue to develop a business that is less labor-intensive, less capital-intensive, more free cash flow generative and differentiated. We expect that the Magnum Acquisition will more than double the proportion of our revenue that is derived from completion tools. In addition, we expect that synergies resulting from the Magnum Acquisition could provide an accelerant to our other service offerings, allowing us to leverage current capabilities to improve operational efficiencies, gain market share and lower costs. As a result, we expect the Magnum Acquisition to be accretive to our earnings per share, our margins, and long term returns on invested capital.
The Magnum Acquisition is expected to close later this month. The Magnum Acquisition is subject to antitrust clearance and other customary closing conditions. The Magnum Purchase Agreement contains customary representations and warranties, covenants, indemnification and termination provisions.
We cannot assure you that we will complete the Magnum Acquisition on the terms contemplated in this offering memorandum or at all. Please read “Risk factors—Risks related to the Magnum Acquisition” for more information on the Magnum Acquisition and the risks related thereto. The consummation of this offering is expected to occur prior to, and is not conditioned on, the closing of the Magnum Acquisition. However, if the Magnum Acquisition is not consummated on or prior to November 30, 2018, the notes will be redeemed at 100% of their issue price, plus accrued and unpaid interest, if any, to but excluding, the redemption date. See “Description of notes—Special mandatory redemption.”
Refinancing of our existing credit facility and entry into our new credit facility
Concurrently with the consummation of the Magnum Acquisition, we intend to fully repay and terminate the $115.3 million of outstanding term loan borrowings and the outstanding revolving credit commitments under our existing credit facility (the “existing credit facility”) with a portion of the proceeds from this offering and replace our existing credit facility with a new credit facility. We have received commitments from a syndicate of commercial banks to provide a new senior secured revolving credit facility with JPMorgan Chase Bank, N.A., as administrative agent, that would permit aggregate borrowings of up to $200.0 million, subject to a borrowing base, including a Canadian tranche with a sub-limit of up to $25.0 million and a sub-limit of $50.0 million for letters of credit. The borrowing base will initially be approximately $130.0 million, which we expect to increase in the fourth quarter of 2018 after the completion of the Magnum Acquisition. Borrowings under our new credit facility (other than borrowings under the Canadian tranche) will be secured by first priority liens on substantially all personal property of the Company and the domestic guarantors. Our new credit facility will mature five years from the date of its effectiveness or, if earlier, on the date that is 180 days before the scheduled maturity date of the notes offered hereby if such notes have not been redeemed or repurchased by such date. Effectiveness of the new credit facility and the funding of any borrowing thereunder is subject to the satisfaction of certain conditions precedent customary for this type of transaction. The consummation of this offering is not conditioned upon the entry into and effectiveness of our new credit facility. We
13
expect to borrow approximately $26.1 million under our new credit facility to fund a portion of the upfront cash purchase price of the Magnum Acquisition, leaving approximately $103.2 million of undrawn capacity under the borrowing base and approximately $173.2 million of undrawn revolver commitments thereunder (in each case, net of an approximate $0.7 million outstanding letter of credit). See “Description of other indebtedness” for additional information regarding our existing credit facility and our new credit facility.
While we anticipate that the existing credit facility will be refinanced and the Magnum Acquisition will be consummated substantially simultaneously with the consummation of this offering of notes, we have obtained an amendment from the requisite lenders under our existing credit facility to permit the incurrence of the notes offered hereby (and redemption thereof) in the event such notes offering is completed prior to the consummation of the Magnum Acquisition and the refinancing of the existing credit facility as described above.
See “Description of other indebtedness” for additional information regarding the existing credit facility and the new credit facility.
Transactions sources and uses of funds
As of June 30, 2018, on a pro forma basis giving effect to the Transactions, we expect to fund the upfront cash portion of the purchase price of the Magnum Acquisition with cash on hand, the net proceeds from this offering and borrowings under our new credit facility. The table below sets forth the estimated sources and uses of funds in connection with the Transactions. The actual sources and uses of funds may vary from the estimated sources and uses of funds set forth below.
(1) In addition, on the closing date of the Magnum Acquisition, we will issue 5,000,000 shares of our common stock to the sellers of Magnum in a private placement.
(2) Excludes deferred financing costs of $1.4 million.
(3) Consists of our estimate of fees and expenses associated with the Transactions, including breakage costs, underwriting discounts and commissions and related expenses.
Preliminary estimate of the Company’s selected third quarter 2018 financial results
We have prepared the following prospective financial information to present our estimated results for the three months ended September 30, 2018. This information was not prepared with a view toward public disclosure or with a view toward complying with the guidelines established by the American Institute of Certified Public Accountants with respect to prospective financial information but, in our view is reasonable, reflects the best currently available estimates and judgments, and presents our expected performance.
We have prepared the below estimates on a basis materially consistent with the financial information presented elsewhere in this offering memorandum and in good faith based upon our internal reporting as of and for the three months ended September 30, 2018. These estimated ranges are preliminary and unaudited and are thus inherently uncertain and subject to
14
change as we complete our financial results for the three months ended September 30, 2018. We are in the process of completing our customary quarterly close and review procedures as of and for the three months ended September 30, 2018, and there can be no assurance that our final results for this period will not differ from these estimates. During the course of the preparation of our consolidated financial statements and related notes as of and for the three months ended September 30, 2018, we may identify items that could cause our final reported results to be materially different from the preliminary financial estimates presented herein. Important factors that could cause actual results to differ from our preliminary estimates are set forth under the headings “Risk factors” and “Cautionary note regarding forward-looking statements.”
These estimates should not be viewed as a substitute for full interim financial statements prepared in accordance with GAAP. In addition, these preliminary estimates for the three months ended September 30, 2018 are not necessarily indicative of the results to be achieved for any future period. Our consolidated financial statements and related notes as of and for the three months ended September 30, 2018 are not expected to be filed with the SEC until after this offering is completed. The preliminary estimates have been prepared by and are the responsibility of management. In addition, the preliminary financial results presented above have not been audited, reviewed or compiled by our independent registered public accounting firm. Accordingly, our independent registered public accounting firm does not express an opinion or any other form of assurance with respect thereto and assumes no responsibility for, and disclaims any association with, this information.
Based on the information and data currently available, although our results of operations for the three months ended September 30, 2018 are not yet final, we estimate, on a preliminary basis, that revenue will be within a range of $218.0 million to $219.0 million for the three months ended September 30, 2018, as compared to $148.2 million for the same period in 2017.
Based on currently available information, we also estimate that our capital expenditures will total $21.5 million to $22.5 million during the three months ended September 30, 2018, compared to $11.3 million for the same period in 2017. Our capital expenditure budget for 2018, excluding possible acquisitions, is expected to be between $53.0 million and $57.0 million. We continually evaluate our capital expenditures, and the amount we ultimately spend will depend on a number of factors including expected industry activity levels and company initiatives.
In addition, we estimate that our net income will be within a range of $9.3 million to $13.0 million for the three months ended September 30, 2018, as compared to a net loss of $5.1 million for the same period in 2017, and our Adjusted EBITDA will be within a range of $36.0 million to $38.0 million for the three months ended September 30, 2018, as compared to $18.1 million for the same period in 2017.
15
Adjusted EBITDA is a non-GAAP financial measure. For a definition of Adjusted EBITDA, see “—Summary historical and pro forma financial data—Non-GAAP financial measures” below. The following table presents a reconciliation of the Company’s non-GAAP financial measures of EBITDA and Adjusted EBITDA to the GAAP financial measure of net income for the three months ended September 30, 2018 (estimated) and 2017 (actual):
| Three months ended September 30, | ||||||||||||
| (in thousands) | 2018 | 2017 | ||||||||||
| (unaudited) | Low | High | Actual | |||||||||
| EBITDA reconciliation: |
||||||||||||
| Net income (loss) |
$ | 9,300 | $ | 13,000 | $ | (5,052 | ) | |||||
| Interest expense |
1,600 | 1,540 | 4,093 | |||||||||
| Depreciation |
13,550 | 13,500 | 13,150 | |||||||||
| Amortization |
1,910 | 1,880 | 2,200 | |||||||||
| Income tax expense |
680 | 930 | 766 | |||||||||
|
|
|
|||||||||||
| EBITDA |
$ | 27,040 | $ | 30,850 | $ | 15,157 | ||||||
|
|
|
|||||||||||
| Adjusted EBITDA reconciliation: |
||||||||||||
| EBITDA |
$ | 27,040 | $ | 30,850 | $ | 15,157 | ||||||
| Transaction expenses |
3,960 | 2,800 | 50 | |||||||||
| Loss from the revaluation of contingent liabilities(1) |
— | — | 277 | |||||||||
| Loss on equity investment |
— | — | 83 | |||||||||
| Non-cash stock-based compensation expense |
3,550 | 3,520 | 2,185 | |||||||||
| (Gain) loss on sale of assets |
(950 | ) | (1,070 | ) | 148 | |||||||
| Legal fees and settlements(2) |
2,400 | 1,900 | 188 | |||||||||
|
|
|
|||||||||||
| Adjusted EBITDA |
$ | 36,000 | $ | 38,000 | $ | 18,088 | ||||||
|
|
||||||||||||
(1) Loss related to the revaluation of liability for contingent consideration relating to our acquisition of our various Scorpion plugs to be paid in shares of Company common stock and in cash, contingent upon quantities of Scorpion Composite Plugs sold during 2016 and gross margin related to the product sales for three years following the acquisition.
(2) Amount represents fees and legal settlements associated with legal proceedings brought pursuant to the Fair Labor Standards Act and/or similar state laws.
Preliminary estimate of Magnum’s selected third quarter 2018 financial results
Magnum has prepared the following prospective financial information to present Magnum’s estimated results for the three months ended September 30, 2018. This information was not prepared with a view toward public disclosure or with a view toward complying with the guidelines established by the American Institute of Certified Public Accountants with respect to prospective financial information but, in Magnum’s view is reasonable, reflects the best currently available estimates and judgments, and presents Magnum’s expected performance.
Magnum has prepared the below estimates on a basis materially consistent with the financial information presented elsewhere in this offering memorandum and in good faith based upon its internal reporting as of and for the three months ended September 30, 2018. These estimated ranges are preliminary and unaudited and are thus inherently uncertain and subject to change as Magnum completes its financial results for the three months ended September 30, 2018. Magnum is in the process of completing its customary quarterly close and review procedures as of and for the three months ended September 30, 2018, and there can be no assurance that its final results for this period will not differ from these estimates. During the course of the
16
preparation of its consolidated financial statements and related notes as of and for the three months ended September 30, 2018, Magnum may identify items that could cause its final reported results to be materially different from the preliminary financial estimates presented herein. Important factors that could cause actual results to differ from Magnum preliminary estimates are similar to the factors that could impact the Company set forth under the headings “Risk factors” and “Cautionary note regarding forward-looking statements.”
These estimates should not be viewed as a substitute for full interim financial statements prepared in accordance with GAAP. In addition, these preliminary estimates for the three months ended September 30, 2018 are not necessarily indicative of the results to be achieved for any future period. The preliminary estimates have been prepared by and are the responsibility of Magnum’s management. In addition, the preliminary financial results presented above have not been audited, reviewed or compiled by our or Magnum’s independent registered public accounting firm. Accordingly, neither our nor Magnum’s independent registered public accounting firm expresses an opinion or any other form of assurance with respect thereto and assumes no responsibility for, and disclaims any association with, this information.
Based on the information and data currently available, although its results of operations for the three months ended September 30, 2018 are not yet final, Magnum estimates, on a preliminary basis, that revenue will be within a range of $39.0 million to $40.0 million for the three months ended September 30, 2018, as compared to $24.2 million for the same period in 2017. Based on currently available information, Magnum also estimates that its capital expenditures totaled
$0.3 million to $0.5 million during the three months ended September 30, 2018, compared to less than $0.1 million for the same period in 2017.
In addition, Magnum estimates that its net income will be within a range of $12.3 million to $13.3 million for the three months ended September 30, 2018, as compared to net income of $6.6 million for the same period in 2017, and its Adjusted EBITDA will be within a range of $13.6 million to $14.2 million for the three months ended September 30, 2018, as compared to $6.9 million for the same period in 2017.
Adjusted EBITDA is a non-GAAP financial measure used by Magnum. Magnum defines Adjusted EBITDA as EBITDA further adjusted for transaction expenses related to the Magnum Acquisition. The following table presents a reconciliation of Magnum’s non-GAAP financial measures of EBITDA and Adjusted EBITDA to the GAAP financial measure of net income for the three months ended September 30, 2018 (estimated) and 2017 (actual):
| Three months ended September 30, | ||||||||||||
| (in thousands) | 2018 | 2017 | ||||||||||
| (unaudited) | Low | High | Actual | |||||||||
| EBITDA reconciliation: |
||||||||||||
| Net income |
$ | 12,300 | $ | 13,300 | $ | 6,583 | ||||||
| Interest expense, net |
— | — | 4 | |||||||||
| Depreciation and amortization |
230 | 170 | 265 | |||||||||
| Income tax expense |
470 | 530 | 56 | |||||||||
|
|
|
|||||||||||
| EBITDA |
$ | 13,000 | $ | 14,000 | $ | 6,908 | ||||||
|
|
|
|
|
|
|
|||||||
| Adjusted EBITDA reconciliation: |
||||||||||||
| EBITDA |
$ | 13,000 | $ | 14,000 | $ | 6,908 | ||||||
| Transaction expenses |
600 | 200 | — | |||||||||
|
|
|
|||||||||||
| Adjusted EBITDA |
$ | 13,600 | $ | 14,200 | $ | 6,908 | ||||||
|
|
||||||||||||
17
Corporate information
Nine Energy Service, Inc. is a Delaware corporation. Our principal executive offices are located at 2001 Kirby Drive, Suite 200, Houston, Texas 77019, and our telephone number at that address is (281) 730-5100. Our website is available at www.nineenergyservice.com. Our website and the information contained on, or accessible through, our website is not part of this offering memorandum, and you should rely only on the information contained in this offering memorandum when making a decision as to whether to invest in the notes.
Pro forma organizational structure
The following chart reflects our simplified organizational structure as of June 30, 2018, on a pro forma basis after giving effect to the Transactions.
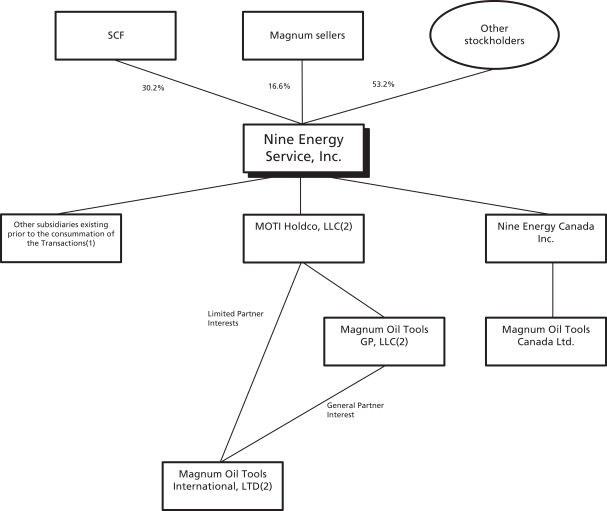
All ownership is 100% unless otherwise noted.
(1) All domestic subsidiaries of the Company will initially be guarantors of the notes.
(2) These Magnum entities will become guarantors of the notes after completion of the Magnum Acquisition. See “Description of note—Certain covenants—Additional guarantees.”
18
Summary historical and pro forma financial data
The following table presents our summary financial data for the periods and as of the dates indicated. The financial data set forth below, as well as our audited consolidated financial statements and related notes thereto and our unaudited condensed consolidated financial statements and related notes thereto, each included elsewhere in this offering memorandum and, except as otherwise indicated, all financial data provided in this offering memorandum, give effect to the Combination and represent the combined results of Nine and Beckman and their respective subsidiaries.
The summary historical consolidated financial data as of and for the years ended December 31, 2016 and December 31, 2017 are derived from our audited historical consolidated financial statements and related notes thereto included elsewhere in this offering memorandum. The summary financial data for the six months ended June 30, 2017 and June 30, 2018, and as of June 30, 2018, are derived from our unaudited historical condensed consolidated financial statements and related notes thereto included elsewhere in this offering memorandum and which, in the opinion of management, include all adjustments, consisting only of normal recurring adjustments, necessary for a fair statement of the results for the unaudited interim periods. Historical results are not necessarily indicative of our future results of operations, financial position and cash flows.
The following table also includes unaudited pro forma condensed combined financial data for the year ended December 31, 2017, for the six months ended June 30, 2018, and as of and for the twelve months ended June 30, 2018. The unaudited pro forma condensed combined balance sheet as of June 30, 2018 is presented as if the Transactions had occurred on June 30, 2018. The unaudited pro forma condensed combined statement of operations for the six months ended June 30, 2018, the twelve months ended June 30, 2018 and the year ended December 31, 2017 is presented as if the Transactions occurred on January 1, 2017. See “—Recent developments” for information regarding the Transactions.
The unaudited pro forma condensed combined financial data is presented for illustrative purposes only and is not necessarily indicative of the financial position that would have existed or the financial results that would have occurred if the Transactions had been consummated on the dates indicated above, nor are they necessarily indicative of our financial position or results of operations in the future. The pro forma adjustments, as described in the notes to the unaudited pro forma condensed combined financial information included under ‘‘Unaudited pro forma condensed combined financial information,’’ are preliminary and based upon currently available information and certain assumptions that our management believes are reasonable. The pro forma adjustments reflected herein are limited to amounts that are directly attributable to the Transactions, factually supportable, and with respect to the pro forma condensed combined statement of operations, are expected to have a continuing impact. These pro forma adjustments will differ from the actual adjustments, and such differences may be material. In particular, the fair value of the assets acquired and liabilities assumed are based upon estimates. Accordingly, the purchase price allocation pro forma adjustments are preliminary and have been made solely for the purpose of providing unaudited pro forma condensed combined financial data in this offering memorandum. The final allocation is dependent upon valuations and other studies that will not be completed until after the Magnum Acquisition has been consummated.
The data presented below should be read in conjunction with, and are qualified in their entirety by reference to, “—Recent developments,” “Use of proceeds,” “Capitalization,” “Unaudited pro
19
forma condensed consolidated financial information” and “Management’s discussion and analysis of financial condition and results of operations,” our historical audited and unaudited consolidated financial statements and the related notes thereto included elsewhere in this offering memorandum and Magnum’s historical consolidated financial statements and the related notes thereto included elsewhere in this offering memorandum. Among other things, those historical and pro forma financial statements and related notes thereto include more detailed information regarding the basis of presentation for the following information.
| Historical | Pro forma combined (unaudited) |
|||||||||||||||||||||||||||
| Six months ended June 30, |
Year ended December 31, |
Six months ended June 30, |
Twelve months ended June 30, |
Year ended December 31, |
||||||||||||||||||||||||
| (in thousands) | 2018 | 2017 | 2017 | 2016 | 2018 | 2018 | 2017 | |||||||||||||||||||||
| (unaudited) | (unaudited) | |||||||||||||||||||||||||||
| Statement of operations data: |
||||||||||||||||||||||||||||
| Revenues |
$ | 379,299 | $ | 241,213 | $ | 543,660 | $ | 282,354 | $ | 451,714 | $ | 803,922 | $ | 633,248 | ||||||||||||||
| Cost and expenses |
||||||||||||||||||||||||||||
| Cost of revenues (exclusive of depreciation and amortization shown separately below) |
301,818 | 202,992 | 448,467 | 246,109 | 342,751 | 616,042 | 499,918 | |||||||||||||||||||||
| General and administrative expenses |
31,498 | 24,758 | 49,552 | 39,387 | 37,579 | 68,298 | 61,310 | |||||||||||||||||||||
| Depreciation |
26,321 | 27,176 | 53,422 | 55,260 | 26,766 | 53,613 | 54,553 | |||||||||||||||||||||
| Amortization of intangibles |
3,796 | 4,401 | 8,799 | 9,083 | 8,776 | 18,154 | 18,759 | |||||||||||||||||||||
| Impairment of goodwill |
- | - | 31,530 | 12,207 | - | 31,530 | 31,530 | |||||||||||||||||||||
| Impairment of intangibles |
- | - | 3,800 | - | - | 3,800 | 3,800 | |||||||||||||||||||||
| Loss on equity method investment |
193 | 172 | 368 | - | 193 | 389 | 368 | |||||||||||||||||||||
| (Gain) loss on sale of property and equipment |
(511 | ) | 4,645 | 4,688 | 3,320 | (562 | ) | (570 | ) | 4,683 | ||||||||||||||||||
|
|
|
|||||||||||||||||||||||||||
| Income (loss) from operations |
16,184 | (22,931 | ) | (56,966 | ) | (83,012 | ) | 36,211 | 12,666 | (41,673 | ) | |||||||||||||||||
|
|
|
|||||||||||||||||||||||||||
| Other income (expense) |
||||||||||||||||||||||||||||
| Other income (expense) |
- | - | - | - | 133 | (390 | ) | (144 | ) | |||||||||||||||||||
| Interest expense, net |
(4,745 | ) | (7,687 | ) | (15,703 | ) | (14,185 | ) | (18,132 | ) | (36,264 | ) | (36,264 | ) | ||||||||||||||
|
|
|
|||||||||||||||||||||||||||
| Total other expense |
(4,745 | ) | (7,687 | ) | (15,703 | ) | (14,185 | ) | (17,999 | ) | (36,654 | ) | (36,408 | ) | ||||||||||||||
|
|
|
|||||||||||||||||||||||||||
| Income (loss) before income taxes |
11,439 | (30,618 | ) | (72,669 | ) | (97,197 | ) | 18,212 | (23,988 | ) | (78,081 | ) | ||||||||||||||||
| Income tax expense (benefit) |
745 | 2,201 | (4,987 | ) | (26,286 | ) | 3,215 | (478 | ) | (6,833 | ) | |||||||||||||||||
|
|
|
|||||||||||||||||||||||||||
| Net income (loss) |
$ | 10,694 | $ | (32,819 | ) | $ | (67,682 | ) | $ | (70,911 | ) | $ | 14,997 | $ | (23,510 | ) | $ | (71,248 | ) | |||||||||
|
|
|
|||||||||||||||||||||||||||
| Other comprehensive income (loss), net of tax |
||||||||||||||||||||||||||||
| Foreign currency translation adjustments, net of tax of $0, $0, $0, and $0) |
(644 | ) | (87 | ) | (198 | ) | 210 | |||||||||||||||||||||
|
|
|
|||||||||||||||||||||||||||
| Total other comprehensive income (loss), net of tax |
(644 | ) | (87 | ) | (198 | ) | 210 | |||||||||||||||||||||
|
|
|
|||||||||||||||||||||||||||
| Total comprehensive income (loss) |
$ | 10,050 | $ | (32,906 | ) | $ | (67,880 | ) | $ | (70,701 | ) | |||||||||||||||||
|
|
||||||||||||||||||||||||||||
| Balance sheet data (at period end): |
||||||||||||||||||||||||||||
| Cash and cash equivalents |
$ | 70,860 | $ | 17,513 | $ | 4,074 | $ | 26,066 | ||||||||||||||||||||
| Property and equipment, net |
248,803 | 259,039 | 273,210 | 251,488 | ||||||||||||||||||||||||
| Total assets |
656,386 | 578,859 | 576,094 | 1,118,918 | ||||||||||||||||||||||||
20
| Historical | Pro forma combined (unaudited) |
|||||||||||||||||||||||||||
| Six months ended June 30, |
Year ended December 31, |
Six months ended June 30, |
Twelve months ended June 30, |
Year ended December 31, |
||||||||||||||||||||||||
| (in thousands) | 2018 | 2017 | 2017 | 2016 | 2018 | 2018 | 2017 | |||||||||||||||||||||
| (unaudited) | (unaudited) | |||||||||||||||||||||||||||
| Total long-term debt (including current portion) |
113,879 | 241,509 | 244,262 | 426,100 | ||||||||||||||||||||||||
| Total stockholders’ equity |
472,180 | 287,358 | 288,186 | 608,609 | ||||||||||||||||||||||||
| Statement of cash flows data: |
||||||||||||||||||||||||||||
| Net cash provided by (used in) operating activities |
$ | 25,200 | $ | (20,982 | ) | $ | 5,671 | $ | (3,290 | ) | ||||||||||||||||||
| Net cash used in investing activities |
(15,028 | ) | (19,086 | ) | (44,464 | ) | (4,176 | ) | ||||||||||||||||||||
| Net cash provided by (used in) financing activities |
43,482 | 48,184 | 52,342 | (7,315 | ) | |||||||||||||||||||||||
| Other financial data: (unaudited) |
||||||||||||||||||||||||||||
| EBITDA(1) |
$ | 46,301 | $ | 8,646 | $ | 5,255 | $ | (18,669 | ) | $ | 71,886 | $ | 84,043 | $ | 31,495 | |||||||||||||
| Adjusted EBITDA(1) |
54,723 | 21,757 | 58,220 | 9,537 | 80,257 | 132,217 | 84,455 | |||||||||||||||||||||
| Adjusted EBITDA margin(1)(2) |
14.4% | 9.0% | 10.7% | 3.4% | 17.8% | 16.4% | 13.3% | |||||||||||||||||||||
| Net income (loss) margin(3) |
2.8% | (13.6)% | (12.5)% | (25.1)% | 3.3% | (2.9)% | (11.3)% | |||||||||||||||||||||
|
|
||||||||||||||||||||||||||||
(1) EBITDA, Adjusted EBITDA and Adjusted EBITDA margin are non-GAAP financial measures. For definitions of these measures and a reconciliation of EBITDA and Adjusted EBITDA to our net income (loss), see “—Non-GAAP financial measures” below.
(2) Adjusted EBITDA margin means Adjusted EBITDA calculated as a percentage of revenues.
(3) Net income margin means net income calculated as a percentage of revenues.
Non-GAAP financial measures
EBITDA and Adjusted EBITDA
EBITDA and Adjusted EBITDA are supplemental non-GAAP financial measures that are used by management and external users of our financial statements, such as industry analysts, investors, lenders and rating agencies.
We define EBITDA as net income (loss) before net interest expense, depreciation, amortization and income tax expense. EBITDA is not a measure of net income or cash flows as determined by GAAP.
We define Adjusted EBITDA as EBITDA further adjusted for (i) impairment of goodwill and other intangible assets, (ii) transaction expenses related to acquisitions or the Combination, (iii) loss from discontinued operations, (iv) loss from the revaluation of contingent liabilities, (v) loss on equity investment, (vi) non-cash stock-based compensation expense, (vii) loss or gains on sale of assets, and (viii) other expenses or charges to exclude certain items that we believe are not reflective of the ongoing performance of our business, such as costs related to legal expenses and settlement costs related to litigation outside the ordinary course of business, and restructuring costs.
Management believes EBITDA and Adjusted EBITDA are useful because they allow for a more effective evaluation of our operating performance and compare the results of our operations from period to period without regard to our financing methods or capital structure. We exclude the items listed above from net income (loss) in arriving at these measures because these amounts can vary substantially from company to company within our industry depending upon accounting methods and book values of assets, capital structures and the method by which the
21
assets were acquired. These measures should not be considered as an alternative to, or more meaningful than, net income (loss) as determined in accordance with GAAP or as an indicator of our operating performance. Certain items excluded from these measures are significant components in understanding and assessing a company’s financial performance, such as a company’s cost of capital and tax structure, as well as the historic costs of depreciable assets, none of which are components of these measures. Our computations of these measures may not be comparable to other similarly titled measures of other companies. We believe that these are widely followed measures of operating performance.
The following table presents a reconciliation of the non-GAAP financial measures of EBITDA and Adjusted EBITDA to the GAAP financial measure of net income (loss) of the Company:
| Historical | Pro forma | |||||||||||||||||||||||||||
| (in thousands) (unaudited) |
Six months ended June 30, |
Year ended December 31, |
Six months ended June 30, |
Twelve months ended June 30, |
Year ended December 31, |
|||||||||||||||||||||||
| 2018 | 2017 | 2017 | 2016 | 2018 | 2018 | 2017 | ||||||||||||||||||||||
| EBITDA reconciliation: |
||||||||||||||||||||||||||||
| Net income (loss) |
$ | 10,694 | $ | (32,819 | ) | $ | (67,682 | ) | $ | (70,911 | ) | $ | 14,997 | $ | (23,510 | ) | $ | (71,248 | ) | |||||||||
| Interest expense, net |
4,745 | 7,687 | 15,703 | 14,185 | 18,132 | 36,264 | 36,264 | |||||||||||||||||||||
| Depreciation |
26,321 | 27,176 | 53,422 | 55,260 | 26,766 | 53,613 | 54,553 | |||||||||||||||||||||
| Amortization of intangibles |
3,796 | 4,401 | 8,799 | 9,083 | 8,776 | 18,154 | 18,759 | |||||||||||||||||||||
| Income tax expense (benefit) |
745 | 2,201 | (4,987 | ) | (26,286 | ) | 3,215 | (478 | ) | (6,833 | ) | |||||||||||||||||
|
|
|
|||||||||||||||||||||||||||
| EBITDA |
$ | 46,301 | $ | 8,646 | $ | 5,255 | $ | (18,669 | ) | $ | 71,886 | $ | 84,043 | $ | 31,495 | |||||||||||||
|
|
|
|||||||||||||||||||||||||||
| Adjusted EBITDA reconciliation: |
||||||||||||||||||||||||||||
| EBITDA |
$ | 46,301 | $ | 8,646 | $ | 5,255 | $ | (18,669 | ) | $ | 71,886 | $ | 84,043 | $ | 31,495 | |||||||||||||
| Impairment of goodwill and other intangible assets |
- | - | 35,330 | 12,207 | - | 35,707 | 35,330 | |||||||||||||||||||||
| Transaction expenses |
377 | 3,365 | 3,622 | - | 377 | 1,927 | 3,622 | |||||||||||||||||||||
| Loss from the revaluation of contingent liabilities(1) |
1,670 | 144 | 415 | 1,735 | 1,670 | 464 | 415 | |||||||||||||||||||||
| Loss on equity investment |
193 | 172 | 368 | - | 193 | 6,407 | 368 | |||||||||||||||||||||
| Non-cash stock-based compensation expense |
6,211 | 4,195 | 7,568 | 5,711 | 6,211 | 2,862 | 7,568 | |||||||||||||||||||||
| (Gain) loss on sale of assets |
(511 | ) | 4,645 | 4,688 | 3,320 | (562 | ) | 423 | 4,683 | |||||||||||||||||||
| Legal fees and settlements(2) |
482 | 590 | 974 | 4,145 | 482 | 384 | 974 | |||||||||||||||||||||
| Restructuring costs |
- | - | - | 1,088 | - | - | - | |||||||||||||||||||||
|
|
|
|||||||||||||||||||||||||||
| Adjusted EBITDA |
$ | 54,723 | $ | 21,757 | $ | 58,220 | $ | 9,537 | $ | 80,257 | $ | 132,217 | $ | 84,455 | ||||||||||||||
|
|
||||||||||||||||||||||||||||
(1) Loss related to the revaluation of liability for contingent consideration relating to our acquisition of our various Scorpion plugs to be paid in shares of Company common stock and in cash, contingent upon quantities of Scorpion Composite Plugs sold during 2016 and gross margin related to the product sales for three years following the acquisition.
(2) Amount represents fees and legal settlements associated with legal proceedings brought pursuant to the Fair Labor Standards Act and/or similar state laws.
22