Attached files
| file | filename |
|---|---|
| 8-K - 8-K - Valeritas Holdings Inc. | a8-k101218.htm |

Valeritas Corporate Presentation NASDAQ: VLRX October 2018 Improving health and simplifying life for people with diabetes ©2018 Valeritas, Inc.

Forward Looking Statements This presentation shall not be deemed an offer to sell securities nor a solicitation of an offer to purchase securities. Any sale by the company shall be made pursuant to a definitive purchase agreement. Unless otherwise stated in this presentation, references to “Valeritas,” “we,” “us,” “our” or “our company” refer to Valeritas Holdings, Inc. and its subsidiaries. This presentation contains estimates, projections and forward-looking statements. Our estimates, projections and forward-looking statements are based on our management’s current assumptions and expectations of future events and trends, which affect or may affect our business, strategy, operations or financial performance, including but not limited to our revenue, gross margin and cash- flow break-even projections. Although we believe that these estimates, projections and forward-looking statements are based upon reasonable assumptions and expectations, they are subject to numerous known and unknown risks and uncertainties and are made in light of information currently available to us. Many important factors may adversely and materially affect our results as indicated in forward-looking statements. All statements other than statements of historical fact are forward-looking statements. The words “believe,” “may,” “might,” “could, “would,” “will,” “aim,” “estimate,” “continue,” “anticipate,” “intend,” “expect,” “plan” and similar words are intended to identify estimates, projections and forward-looking statements. Estimates, projections and forward- looking statements speak only as of the date they are made, and, except to the extent required by law, we undertake no obligation to update or review any estimate, projection or forward-looking statement because of new information, future events or other factors. Our estimates, projections and forward-looking statements may be influenced by one or more of the following factors: • our history of operating losses and uncertainty regarding our ability to achieve profitability; • our reliance on V-Go® Wearable Insulin Delivery device, or V-Go®, to generate all of our revenue; • our inability to retain a high percentage of our patient customer base or our significant wholesale customers; • the failure of V-Go® to achieve and maintain market acceptance; • our inability to operate in a highly competitive industry and to compete successfully against competitors with greater resources; • competitive products and other technological breakthroughs that may render V-Go® obsolete or less desirable; • our inability to maintain or expand our sales and marketing infrastructure; • any inaccuracies in our assumptions about the insulin-dependent diabetes market; • manufacturing risks, including risks related to manufacturing in Southern China, damage to facilities or equipment and failure to efficiently increase production to meet demand; • our dependence on limited source suppliers and our inability to obtain components for our product; • our failure to secure or retain adequate coverage or reimbursement for V-Go® by third-party payers; • our inability to enhance and broaden our product offering, including through the successful commercialization of the V-Go® SIMTM and V-Go® pre-fill; • our inability to protect our intellectual property and proprietary technology; • our failure to comply with the applicable governmental regulations to which our product and operations are subject; • our ability to operate as a going concern; and • our liquidity. ©2018 Valeritas, Inc. 2

Valeritas: Rapidly Ramping Revenue & Poised for Significant Value Creation Consistent Robust Highly Attractive Unrivaled Market Top-Line Growth Financial Profile Opportunity 30%+ YoY growth and Gross Margins ~50% Global Type 2 diabetes accelerating tracking to 80% pandemic New commercial model Profitability can be attained 5.6 million U.S. Type 2 validated well before 80% patients already on insulin Significant opportunity to Raising funds to reach High barriers to further enhance growth breakeven competitive entry ©2018 Valeritas, Inc. 3

Accelerating Revenue Growth in a Massive Market Establishing a high-touch & higher-service sales model has been the key to unlocking Valeritas’ growth $7,000 Sequential Quarterly Revenue (Q2 2016 - Q2 2018) $6,500 $6,000 Began initiating components of new model with $5,500 fewer reps (in 000’s) (in $5,000 $4,500 Higher-touch & higher-service model created growth inflection $4,000 Q2'16 Q3'16 Q4'16 Q1'17 Q2'17 Q3'17 Q4'17 Q1'18 Q2'18 Note: Percentages reflect year-over-year growth ©2018 Valeritas, Inc. 4

New Higher-Service Sales and Marketing Model Model validated, driving targeted account penetration and robust top-line growth DIRECT SALES REPs ON-LINE ADs INDIRECT REPs EDUCATION PROMOTION DEMO KIT EDUCATORs DESIRE PRESCRIBE TARGETED KOLs PRINT ADs PATIENT PHYSICIAN DIRECT-TO- • Activate patients to seek and ask for V-Go® • Target high insulin volume prescribers CONFERENCES CUSTOMER PILOT • Direct-to-Patient multi-channel marketing • High frequency of office contact • Patient education and support • High support with service to prescriber and patient ©2018 Valeritas, Inc. 5

New Sales Model Validation – Key Metrics Key sales metrics validate our Med Tech sales model drives a highly effective, efficient and scalable commercial organization capable of meaningful market penetration “Old” Pharma Sales “New” Med Tech Sales Model Model Q2 ’18 CFBE (2022E) # of 75 50 75 Sales Representatives (Reps) Rep Interactions with Target 1.3 3 4 Doctor/HCP per Month Revenue per Rep ~$250K ~$500K ~$1,200K Target Market Share per Target <1% <5% <11% Doctor/HCP* * Target Market Share of type 2 patients on basal+bolus insulin per Target Doctor/HCP ©2018 Valeritas, Inc. 6

Direct Sales Footprint – Significant Organic Growth Opportunity With sales model validated top-line growth can be accelerated by disciplined sales force expansion . Currently ~50 direct reps . Add ~25 direct reps & additional CDEs over time . Large markets under- represented or uncovered . Potential to rapidly accelerate revenues via proven sales model ©2018 Valeritas, Inc. 7
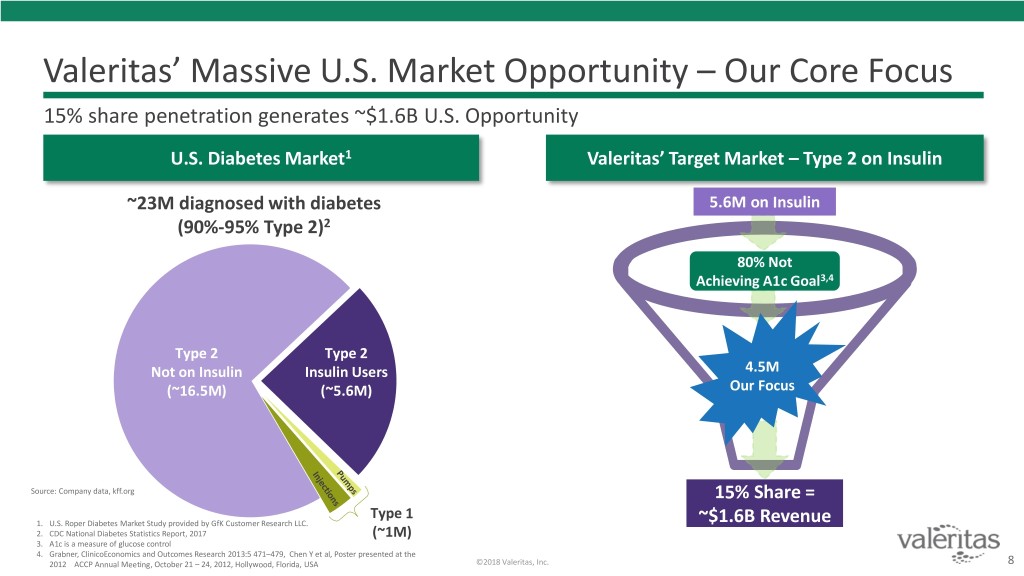
Valeritas’ Massive U.S. Market Opportunity – Our Core Focus 15% share penetration generates ~$1.6B U.S. Opportunity U.S. Diabetes Market1 Valeritas’ Target Market – Type 2 on Insulin ~23M diagnosed with diabetes 5.6M on Insulin (90%-95% Type 2)2 80% Not Achieving A1c Goal3,4 Type 2 Type 2 Not on Insulin Insulin Users 4.5M (~16.5M) (~5.6M) Our Focus Source: Company data, kff.org 15% Share = Type 1 1. U.S. Roper Diabetes Market Study provided by GfK Customer Research LLC. ~$1.6B Revenue 2. CDC National Diabetes Statistics Report, 2017 (~1M) 3. A1c is a measure of glucose control 4. Grabner, ClinicoEconomics and Outcomes Research 2013:5 471–479, Chen Y et al, Poster presented at the 2012 ACCP Annual Meeting, October 21 – 24, 2012, Hollywood, Florida, USA ©2018 Valeritas, Inc. 8
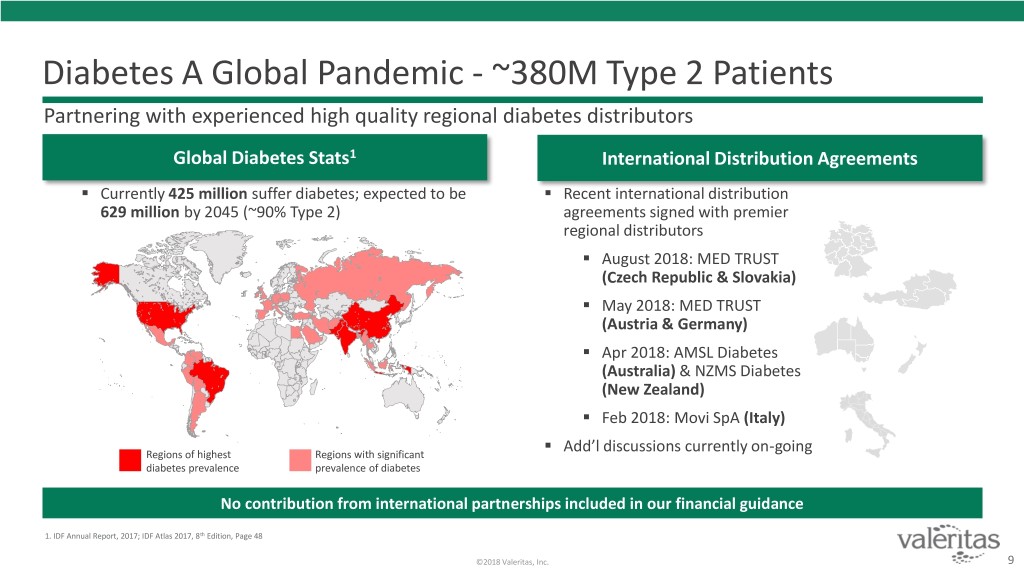
Diabetes A Global Pandemic - ~380M Type 2 Patients Partnering with experienced high quality regional diabetes distributors Global Diabetes Stats1 International Distribution Agreements . Currently 425 million suffer diabetes; expected to be . Recent international distribution 629 million by 2045 (~90% Type 2) agreements signed with premier regional distributors . August 2018: MED TRUST (Czech Republic & Slovakia) . May 2018: MED TRUST (Austria & Germany) . Apr 2018: AMSL Diabetes (Australia) & NZMS Diabetes (New Zealand) . Feb 2018: Movi SpA (Italy) . Regions of highest Regions with significant Add’l discussions currently on-going diabetes prevalence prevalence of diabetes No contribution from international partnerships included in our financial guidance 1. IDF Annual Report, 2017; IDF Atlas 2017, 8th Edition, Page 48 ©2018 Valeritas, Inc. 9

Key Problem Managing Type 2 Diabetes “Drugs don’t work in people who don’t take them” – C. Everett Koop, M.D.1 Type 2 Insulin Users Intentionally Skip and/or Current Insulin Delivery Standard of Care Forget to Take Injections2 Most Type 2 patients will not inject away from home3 1. Eur J Heart Fail. 2017 Nov;19(11):1412-1413 2. Randlov J, et al. J Diabetes Schi Technol. 2008;Mar;2(2):229-35 3. Data from U.S. Roper Diabetes Patient Market study provided by GfK Custom Research LLC and distributed only with express written permission of GfK Custom Research LLC. This study is an annual survey of over 2,000 diabetes patients (n=2,104 in 2011; 692 who use insulin) via telephone and internet. ©2018 Valeritas, Inc. 10

Our Solution, V-Go®: Discreet, Effective & Simple to Use Designed for the Type 2 Patient V-Go’s Benefits Discreet Simple to Use Convenient Better A1c Control* Cost Neutral Self-contained Sharps Container Pharmacy vs. DME * Company data, kff.org (13 published clinical papers and 58 presentations at National Conferences) ©2018 Valeritas, Inc. 11

V-Go® Competition: Pens not Pumps Unique Needs of Type 2 Patients Creates Valeritas’ Opportunity & Differentiates it from Others TYPE 1 TYPE 2 Typical Patient Engaged / Advocate Embarrassment / Stigma Attitude Complex Device More Likely Less Likely Acceptable? (~30% of Type 1 are on pump therapy)1 Willing to Participate More Likely Less Likely in Extensive Training V-Go® Therapy Solutions Offered / Competitors 1. Sikes, et al. Diabetes and the Use of Insulin Pumps. 2016 ©2018 Valeritas, Inc. 12
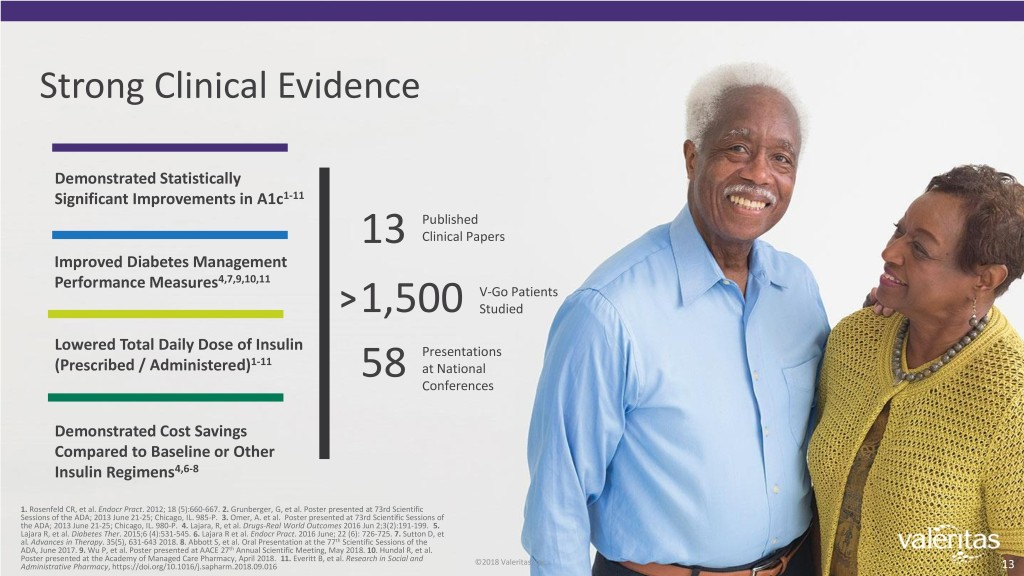
Strong Clinical Evidence Demonstrated Statistically Significant Improvements in A1c1-11 Published 13 Clinical Papers Improved Diabetes Management Performance Measures4,7,9,10,11 V-Go Patients >1,500 Studied Lowered Total Daily Dose of Insulin Presentations 1-11 (Prescribed / Administered) at National 58 Conferences Demonstrated Cost Savings Compared to Baseline or Other Insulin Regimens4,6-8 1. Rosenfeld CR, et al. Endocr Pract. 2012; 18 (5):660-667. 2. Grunberger, G, et al. Poster presented at 73rd Scientific Sessions of the ADA; 2013 June 21-25; Chicago, IL. 985-P. 3. Omer, A. et al. Poster presented at 73rd Scientific Sessions of the ADA; 2013 June 21-25; Chicago, IL. 980-P. 4. Lajara, R, et al. Drugs-Real World Outcomes 2016 Jun 2;3(2):191-199. 5. Lajara R, et al. Diabetes Ther. 2015;6 (4):531-545. 6. Lajara R et al. Endocr Pract. 2016 June; 22 (6): 726-725. 7. Sutton D, et al. Advances in Therapy. 35(5), 631-643 2018. 8. Abbott S, et al. Oral Presentation at the 77th Scientific Sessions of the ADA, June 2017. 9. Wu P, et al. Poster presented at AACE 27th Annual Scientific Meeting, May 2018. 10. Hundal R, et al. Poster presented at the Academy of Managed Care Pharmacy, April 2018. 11. Everitt B, et al. Research in Social and ©2018 Valeritas, Inc.. Administrative Pharmacy, https://doi.org/10.1016/j.sapharm.2018.09.016 13

V-Go®: Improved A1c Control with Less Insulin A Prospective Study of 415 Patients Showed V-Go Superiority vs. Standard Treatment Optimization (STO)1 Greater Improvement in A1c2 Less Insulin Used & More Cost Effective V-Go STO n=169 n=246 29% Less Insulin with V-Go vs STO at 4 months (54 vs 72 u/day) -0.46* P<0.001 P = 0.0018 Change in A1c (%) A1cin Change -0.95* V-Go $24.48 vs STO $39.95 per patient per day N= 415 patients across 52 Sites with duration of up to 4 months for each 1% drop in A1c3 1 Study conducted by HealthCore, Inc., an outcomes research subsidiary of Anthem, Inc. STO included patents currently using insulin therapy with a total daily dose of 30 U to 120 u/day and treated using standard of care by their physician, without forced or mandated protocols or titration regimens *Significant compared to baseline. Significant between groups. Statistical significance between groups was maintained when adjusted for imbalance in baseline A1c (data on file). Baseline A1C (%): V-Go 9.88 and STO 9.34 Baseline total daily insulin dose (u/day): V-Go 71 and STO 72 2 As measured by A1c levels 3 Cost includes the WAC cost for all diabetes treatments and medications and based on per patient/day (PPPD) at study end. The cost is calculated as the sum of published price of insulin, device and concomitant medications. ©2018 Valeritas, Inc. 14 Abbott, S, et al. Presented as an oral presentation at the 77th ADA Scientific Sessions, San Diego, CA 2017

Robust Pipeline to Drive Long-Term Growth V-Go® is a platform with the potential to disrupt the diabetes & insulin markets V-Go® SIMTM V-Go® Prefill1,3 h-PatchTM4 (Simple Insulin Management)1,2 Being developed to: (core technology behind V-Go) Being developed to: • Eliminate filling step as it would include a Potential future uses: prefilled insulin cartridge • Provide connectivity to smart phones and • Combines advantages of transdermal patches support data aggregation on partner platforms • Eliminate need for & cost of V-Go® EZ Fill with accuracy and flexibility of conventional 2 • Permit tracking and reporting of basal rate and • Lower number of co-pays ambulatory pumps bolus insulin usage • Provide revenue from insulin • Covers wide range of therapeutic applications • Assist in diabetes management and HCP-patient • Expand target population (1st line Insulin) • Pre-filled liquid or point-of-care fill engagement • Extend patent life to 2032 • Good for drugs with short half-lives or • Improve patient adherence frequent / cumbersome dosing regimes 1. Product currently under development. 2. We expect market introduction in the US of the V-Go SIM by the end of the first half of 2019. 3. Assumes V-Go® devices and insulin cartridges packaged in a single box under a single NDC thereby potentially reducing the number of prescriptions and the number of co-pays required per patient. 4. The potential use of this technology with other future applications is currently under development and will require regulatory approval. ©2018 Valeritas, Inc.. 15

Growth and Milestones to Drive Significant Shareholder Value Grow Our Share Expand Our Reach Leverage Pipeline Launch Expand V-Go Prefill Advance Sales Force Product Launch V-Go Next in U.S. Collaborate V-Go SIMTM Gen / Line Launch with (Int’l) Extensions Payors V-Go SIMTM Expand h-Patch Expansion of (U.S.) Technology Int’l Sales Force Increase Preferred Distrib. prudently Formulary V-Go® Share Partners in U.S. Position V in U.S. Targeted A Accounts L U E CONTINUED GROWTH IN U.S. WITH HIGH TOUCH / HIGH SERVICE MODEL SHORT-TERM 6 – 18 months MID-TERM 1 – 3 Years LONGER-TERM > 3 years Core Technology= h-patch platform OUS= Outside the United States Line Extensions= V-Go® Link, V-Go® Prefill and future product developments ©2018 Valeritas, Inc.. 16

Strong Gross Margin Mitigates Capital Needs to Break-Even Planned capital raise expected to fund through break-even Quarterly Revenue Level at Which 45% Historical and Projected Gross Margin Gross Margin was Achieved* vs. ($ in million) Revenue $61.1 ~30% 80% Margin Improvement $26-28M $20M $20M 50% $27.0 40% $18M 36% $21.4 21% $5.8 Valeritas Dexcom Tandem Insulet 2015 2016 2017 2018E Projected *Respective past company public filings. Gross margins from each company and product may not be directly comparable ©2018 Valeritas, Inc. 17

Components Of Expected Gross Margin Improvement V-Go’s design and low-cost production empowers a best-in-class gross margin profile that significantly reduces future cash need to break-even 2022E @ 2018E Key Drivers Of Gross Margin Improvement Comments CFBE •1 Expected growth significantly ~80.0% reduces per unit cost ~70.0% • Price breaks already ~+2.5% agreed with existing ~+2.5% Long-Term ~+15.0% Goal manufacturing partner 3 Efficiency • Leverage fixed overhead ~50.0% 2 Net Selling Improvements price 1 Volume Improvement •2 At expected volumes, will see improvements in sales deductions •3 Component cost reductions and planned operating Projected Q4 2018 improvements Gross Margin ©2018 Valeritas, Inc. 18

Financial Summary Financial Summary Quarterly Summary YTD Summary ($ in millions) 2Q18 2Q17 Change 2018 2017 Change Revenue $6.5 $4.8 +36% $12.6 $9.4 +34% Gross Profit $3.1 $1.8 +71.5% $6.0 $3.5 +69.4% Gross Margin 47.6% 37.7% +990 bp 47.6% 37.6% +1000 bp Net Loss $11.0 $12.0 -7.5% $22.7 $23.8 -4.6% Total Debt $38.0 $36.0 +3.6% $37.3 $36.0 +3.6% Cash and Cash Equivalents $33.0 $26.0 27.3% $33.0 $26.0 27.3% ©2018 Valeritas, Inc.. 19

Valeritas: Rapidly Ramping Revenue & Poised for Significant Value Creation Consistent Robust Highly Attractive Unrivaled Market Top-Line Growth Financial Profile Opportunity 30%+ YoY growth and Gross Margins ~50% Global Type 2 diabetes accelerating tracking to 80% pandemic New commercial model Profitability can be attained 5.6 million U.S. Type 2 validated well before 80% patients already on insulin Significant opportunity to Raising funds to reach High barriers to further enhance growth breakeven competitive entry ©2018 Valeritas, Inc. 20

Valeritas Corporate Presentation Appendix NASDAQ: VLRX October 2018 ©2018 Valeritas, Inc.. 21

4.5M U.S. Type 2 Patients on Insulin are not Achieving A1c Goal Despite Serious Health Consequences % of Type 2 Patients on Insulin NOT at Goal1 Impact of Improving A1c Control2 Every 1% improvement in A1c decreases diabetes related events in: AT A1c Goal NOT AT A1c Goal 20% 80% Deaths Heart Attacks 21% 14% Microvascular Complications Amputation or Death from PVD* 37% 43% 1. Grabner M, et al. Clinicoecon Outcomes Res. 2013;5:471-479 2. Stratton IM et al. BMJ. 2000;321:405-412. * Peripheral Vascular Disease ©2018 Valeritas, Inc. 22

Significant Market Opportunity for Valeritas in the U.S. U.S. Type 2 Diabetes Initial V-Go® Target Market V-Go Potential Revenue 5.6M Patients with Type 2 2M Type 2 on Multiple Daily Injections Diabetes On Insulin1 With Current Sales Force 15% “IF” Market Share V-Go Revenue 2 2M on 15% $75 Million MDI With National Sales Force “IF” Market Share V-Go Revenue 15% $700 Million3 2.5M on Longer-Term V-Go Market 1-2 Shots (with V-Go® pipeline products) ~ ~ 4.5 atNot M A1cGoal ~ ~ 4.5M Not at A1c Goal 15% 1.2M at 4.5M on $1.6 Billion V-Go Potential Revenue4 A1c Goal Insulin (“IF” at 15% market share) 1 Number of patients with Type 2 Diabetes on insulin are approximate and based on 2014 US Roper 2. 221,500 Total Meal Time Insulin TRx’s written by Valeritas Reachable Customers x $6.50 x 360 x 15% = ~$75 million Diabetes Patient Market Study provided by GfK Customer Research LLC and achievement of A1c goal based 3. 2M patients x $6.50 per V-Go x 360 days x 15% share = ~ $700 million on Grabner et al. ClinicoEconomics and Outcomes Research. 2013:5 471–479. 4. 4.5M patients x $6.50 per V-Go x 360 days x 15% share = ~$1.6B ©2018 Valeritas, Inc.. 23

Robust Clinical Data Validated Ability of V-Go® to Deliver Clinically Relevant Reductions in A1c with Less Insulin V-GoAL1 SIMPLE2 VALIDATE 13 EVIDENT4 IMPROVE5 JONES6 KAISER7 UMASS8 MOTIV9 ENABLE10 Baseline 9.9% 8.8% 9.6% 9.6% 9.8% 9.1% 9.8% 10.7% 8.7% 9.2% N=169 N=87 N=204 N=85 N= 103 N=69 N=60 N=14 N=15 N=283 V-Go Duration 3 to 4 months 3 months 7 months 8 months 14 months Up to 1 yr 3 months 3 months 4 months 7 months † -0.7 -0.8 A1c -1.0 -1.0 -1.4 -1.3 -1.7 -1.6 Change in in Change -1.8 -2.4 Insulin 24% 18% 41%† 6% 20% 20% 34% 46% 58% 18% Decrease Baseline Insulin Dose U/day: V-GoAL-71, SIMPLE-62, VALIDATE 1-99, EVIDENT-67, IMPROVE-84, Jones-76, KAISER-72, UMASS-119, MOTIV-144 and ENABLE-76 †Change in A1c based on mean V-Go Duration rounded to the nearest month. Protocol for V-GoAL study specified end of study A1c as 3 months (+30 days) from baseline. Duration for JONES study varied by patient with up to 1 year of V-Go use. *A1c data rounded from -0.95 to -1.0. **A1c change reported using least square means. †Insulin change reported based on comparison to prescribed upper limit at baseline 1. Abbott S, et al. Oral Presentation at the 77th Scientific Sessions of the ADA, June 2017. Pending publication. 2. Grunberger G, et al. Poster presented at 73rd Scientific Sessions of the ADA, June 2013. 3. Lajara R, et al. Diabetes Therapy. 2015;6(4):531-545. 4. Everitt B, et al. Research in Social and Administrative Pharmacy, https://doi.org/10.1016/j.sapharm.2018.09.016. 5. Sutton D, et al. Advances in Therapy. 35(5), 631-643 2018. 6. Sink J, et al Poster Presented at Diabetes Technology Meeting, Nov. 2014. 7. Wu P, et al. Poster presented at AACE 27th Annual Scientific Meeting, May 2018. 8. Omer A, et al. Poster presented at ADA 73rd Scientific Sessions, June 2013. 9. Mehta S, et al. Abstract published in The Journal of the American Osteopathic Association Nov 2017:117 (11) and poster presented at OMED. 10. Hundal R, et al. Poster presented at the Academy of Managed Care Pharmacy, April 2018. 11. Valeritas has additional smaller studies not disclosed in this summary. ©2018 Valeritas, Inc.. 24

Simple Titration Approach Significantly Lowered A1c Use of a weekly physician-driven mealtime dosing titration approach with patients with Type 2 Diabetes uncontrolled on prior regimens A1c (%) Insulin Dose (Units) A1c Goal Achievement 8.7 144 Before V-Go® On V-Go < 7% 13% 47% < 8% 40% 7.1* 87% 60* ≤ 9% 67% 100% Hypoglycemia (very low blood glucose) was reported in 23% of patients at baseline and 7% of Before V-Go On V-Go (4 months) patients at 4 months. Source: Texas Health Resources. MOTIV (Managing Optimization and Titration of Insulin Delivery with V-Go) Retrospective Study TDD=Total daily dose of insulin *Significant compared to baseline N=15 Mehta. S, et al. Presented as a poster at OMED, Philadelphia, PA 2017, DTM, Bethesda, MD 2017 and ATTD, Venice, AT, 2018 ©2018 Valeritas, Inc.. 25
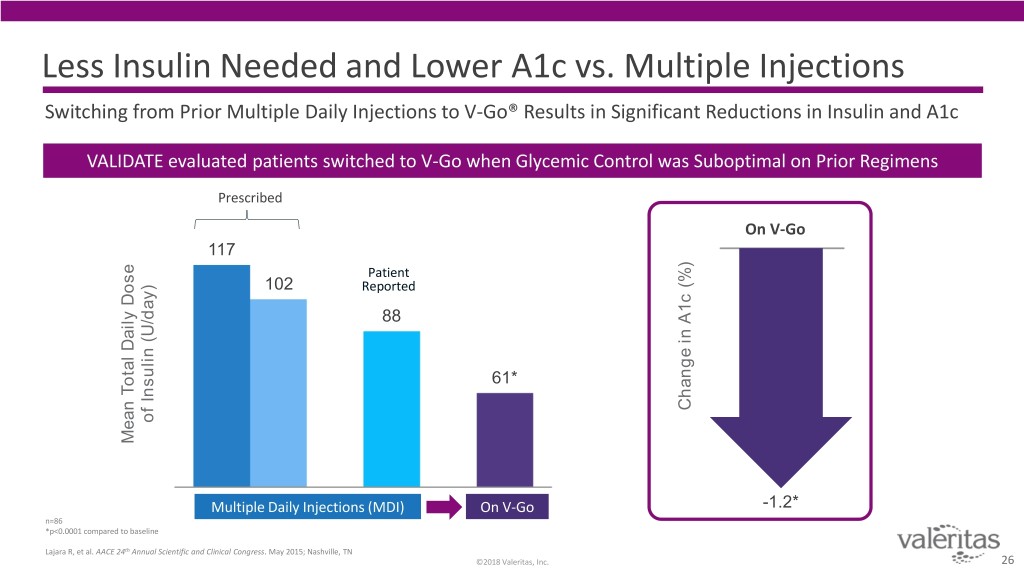
Less Insulin Needed and Lower A1c vs. Multiple Injections Switching from Prior Multiple Daily Injections to V-Go® Results in Significant Reductions in Insulin and A1c VALIDATE evaluated patients switched to V-Go when Glycemic Control was Suboptimal on Prior Regimens Prescribed On V-Go 117 Patient 102 Reported 88 61* Change in A1c A1c (%) in Change of Insulin (U/day) Insulin of Mean Total Daily Dose Daily Total Mean Multiple Daily Injections (MDI) On V-Go -1.2* n=86 *p<0.0001 compared to baseline Lajara R, et al. AACE 24th Annual Scientific and Clinical Congress. May 2015; Nashville, TN ©2018 Valeritas, Inc. 26
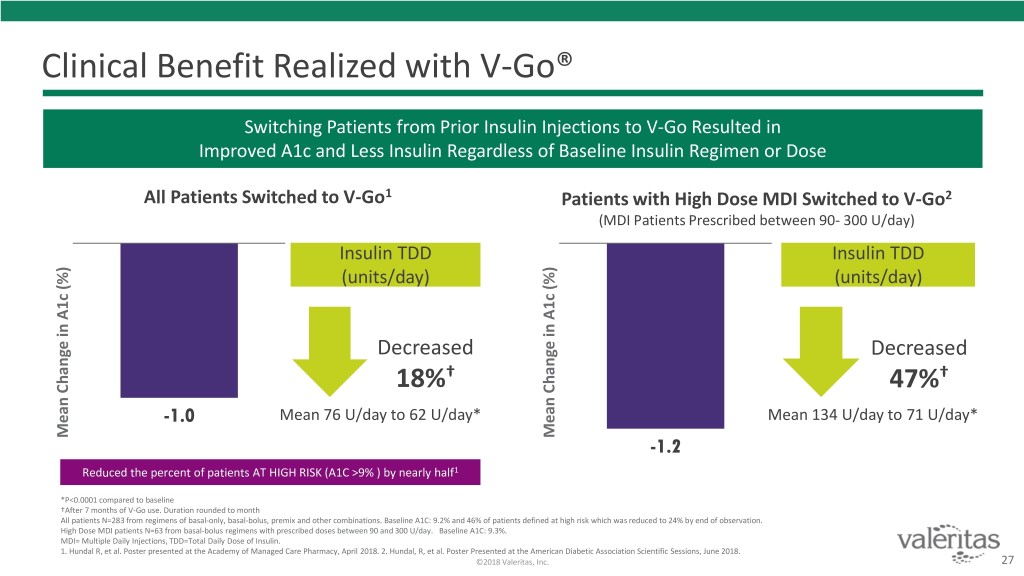
Clinical Benefit Realized with V-Go® Switching Patients from Prior Insulin Injections to V-Go Resulted in Improved A1c and Less Insulin Regardless of Baseline Insulin Regimen or Dose All Patients Switched to V-Go1 Patients with High Dose MDI Switched to V-Go2 (MDI Patients Prescribed between 90- 300 U/day) Insulin TDD Insulin TDD (units/day) (units/day) Decreased Decreased 18%† 47%† -1.0 Mean 76 U/day to 62 U/day* Mean 134 U/day to 71 U/day* Mean Change A1c(%) in Change Mean Mean Change A1c(%) in Change Mean -1.2 Reduced the percent of patients AT HIGH RISK (A1C >9% ) by nearly half1 *P<0.0001 compared to baseline †After 7 months of V-Go use. Duration rounded to month All patients N=283 from regimens of basal-only, basal-bolus, premix and other combinations. Baseline A1C: 9.2% and 46% of patients defined at high risk which was reduced to 24% by end of observation. High Dose MDI patients N=63 from basal-bolus regimens with prescribed doses between 90 and 300 U/day. Baseline A1C: 9.3%. MDI= Multiple Daily Injections, TDD=Total Daily Dose of Insulin. 1. Hundal R, et al. Poster presented at the Academy of Managed Care Pharmacy, April 2018. 2. Hundal, R, et al. Poster Presented at the American Diabetic Association Scientific Sessions, June 2018. ©2018 Valeritas, Inc. 27
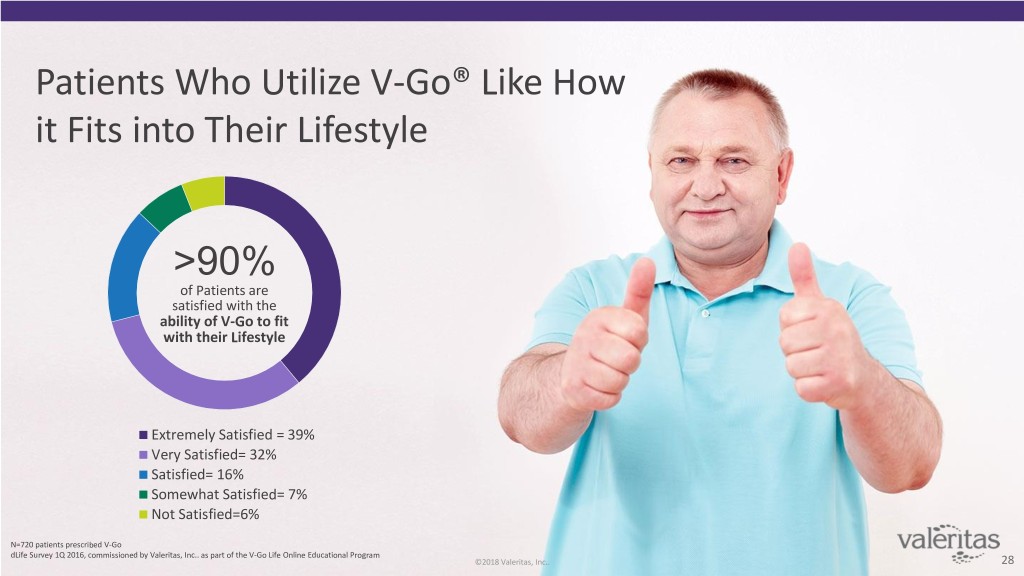
Patients Who Utilize V-Go® Like How it Fits into Their Lifestyle >90% of Patients are satisfied with the ability of V-Go to fit with their Lifestyle Extremely Satisfied = 39% Very Satisfied= 32% Satisfied= 16% Somewhat Satisfied= 7% Not Satisfied=6% N=720 patients prescribed V-Go dLife Survey 1Q 2016, commissioned by Valeritas, Inc.. as part of the V-Go Life Online Educational Program ©2018 Valeritas, Inc.. 28
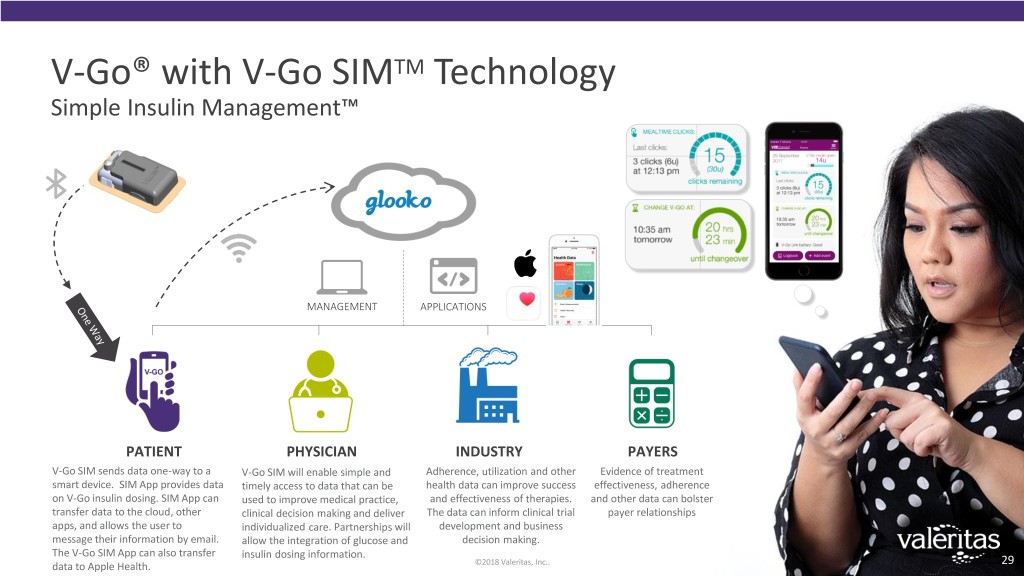
V-Go® with V-Go SIMTM Technology Simple Insulin Management™ MANAGEMENT APPLICATIONS PATIENT PHYSICIAN INDUSTRY PAYERS V-Go SIM sends data one-way to a V-Go SIM will enable simple and Adherence, utilization and other Evidence of treatment smart device. SIM App provides data timely access to data that can be health data can improve success effectiveness, adherence on V-Go insulin dosing. SIM App can used to improve medical practice, and effectiveness of therapies. and other data can bolster transfer data to the cloud, other clinical decision making and deliver The data can inform clinical trial payer relationships apps, and allows the user to individualized care. Partnerships will development and business message their information by email. allow the integration of glucose and decision making. The V-Go SIM App can also transfer insulin dosing information. ©2018 Valeritas, Inc.. 29 data to Apple Health.

V-Go®: Easy to Use & High Quality Commercial Scale Manufacturing V-Go Device Overview V-Go® EZ FILL Basal rate is 24 hour Basal rate begins spring-driven with the push of a button Basal rate flow restrictor Needle • Simple filling does not require calculations, measuring On-demand bolus or needles function is 4.6 mm, 30 gauge manually activated “Floating needle” • Reduces accidental needle sticks in 2-step process Robust IP with > 80 patents issued and > 40 pending ©2018 Valeritas, Inc.. 30
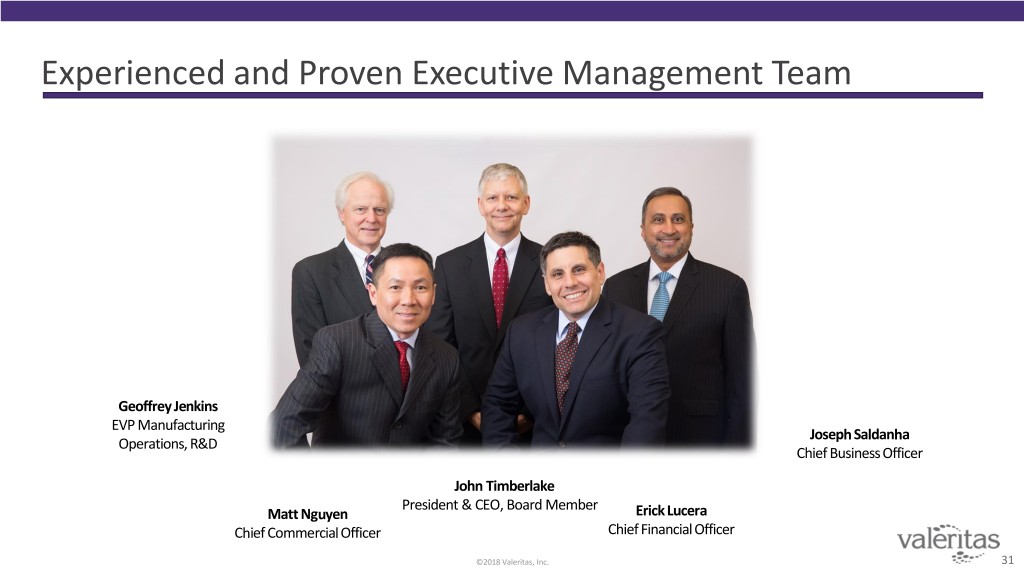
Experienced and Proven Executive Management Team Geoffrey Jenkins EVP Manufacturing Joseph Saldanha Operations, R&D Chief Business Officer John Timberlake President & CEO, Board Member Matt Nguyen ErickLucera Chief Commercial Officer Chief Financial Officer ©2018 Valeritas, Inc. 31
