Attached files
| file | filename |
|---|---|
| 8-K - 8-K - Coeur Mining, Inc. | productionprerelease8x.htm |
NEWS RELEASE 
Coeur Reports Third Quarter 2018 Production and Sales Results
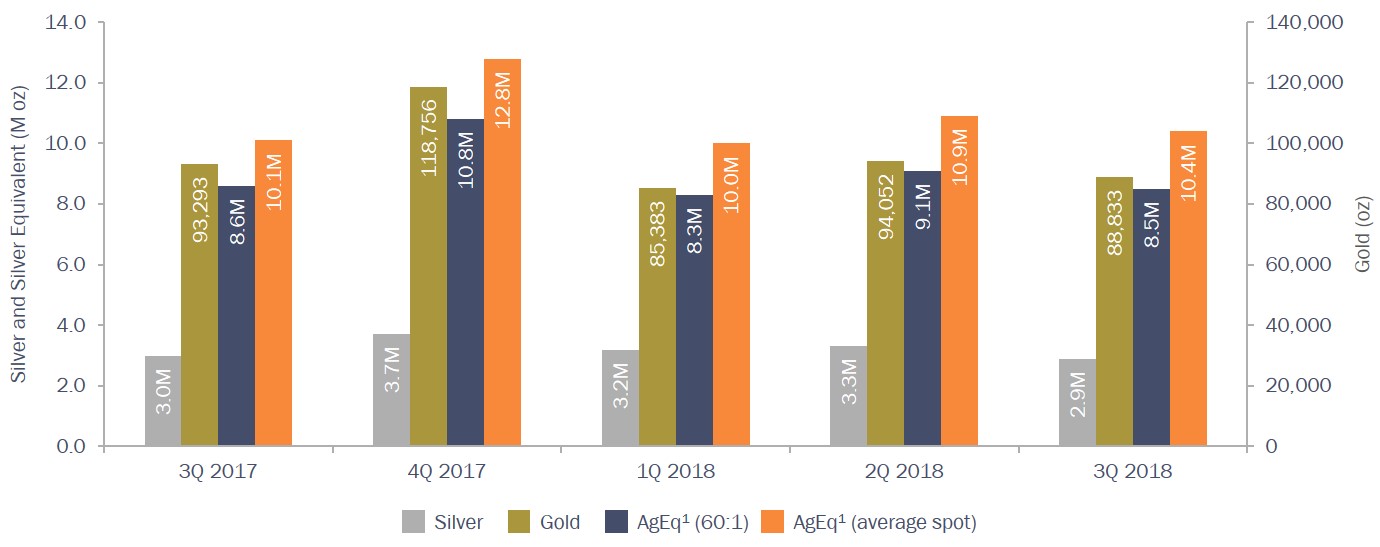
Chicago, Illinois - October 9, 2018 - Coeur Mining, Inc. (the "Company" or "Coeur") (NYSE: CDE) today announced third quarter 2018 production of 2.9 million ounces of silver, 88,833 ounces of gold, 2.2 million pounds of zinc and 1.2 million pounds of lead, or 8.5 million silver equivalent1 ounces (10.4 million ounces based on average spot prices during the third quarter)3. Metal sales for the quarter were 3.0 million ounces of silver, 89,609 ounces of gold, 1.8 million pounds of zinc and 1.6 million pounds of lead, or 8.5 million silver equivalent1 ounces (10.4 million ounces based on average spot prices during the third quarter)3.
As disclosed on September 4, 2018, the Company expects to produce 36.1 - 39.5 million silver equivalent1 ounces (44.0 - 48.0 million ounces based on average spot prices during the third quarter) in 2018, consisting of 13.0 - 14.3 million silver ounces, 363,000 - 382,000 gold ounces, 13.0 - 23.0 million pounds of zinc and 11.0 - 18.0 million pounds of lead.
Quarterly Production Results
1
Operations
Third quarter 2018 production and sales highlights for each of Coeur's operations are provided below.
Palmarejo, Mexico
3Q 2018 | 2Q 2018 | 1Q 2018 | 4Q 2017 | 3Q 2017 | |
Tons milled | 300,116 | 344,073 | 359,893 | 389,524 | 413,086 |
Average silver grade (oz/t) | 6.26 | 6.86 | 6.88 | 6.92 | 5.53 |
Average gold grade (oz/t) | 0.10 | 0.11 | 0.10 | 0.10 | 0.08 |
Average recovery rate – Ag | 82.2% | 87.5% | 81.4% | 87.0% | 83.6% |
Average recovery rate – Au | 88.8% | 89.9% | 80.4% | 92.0% | 83.1% |
Ounces Produced | |||||
Silver (000's) | 1,544 | 2,066 | 2,013 | 2,346 | 1,908 |
Gold | 27,885 | 33,702 | 29,896 | 37,537 | 28,948 |
Silver equivalent1 (000's) | 3,217 | 4,088 | 3,807 | 4,600 | 3,644 |
Silver equivalent1 (average spot) (000's) | 3,796 | 4,728 | 4,382 | 5,209 | 4,104 |
Ounces Sold | |||||
Silver (000's) | 1,572 | 2,092 | 2,031 | 2,343 | 1,794 |
Gold | 29,830 | 31,207 | 30,888 | 38,953 | 26,554 |
Silver equivalent1 (000's) | 3,362 | 3,964 | 3,884 | 4,681 | 3,387 |
Silver equivalent1 (average spot) (000's) | 3,981 | 4,557 | 4,479 | 5,313 | 3,809 |
Average realized price per silver ounce | $14.75 | $16.49 | $16.73 | $16.57 | $16.83 |
Average realized price per gold ounce | $1,082 | $1,162 | $1,168 | $1,139 | $1,148 |
• | Third quarter silver equivalent1 production was 3.2 million ounces (3.8 million ounces based on average spot prices during the third quarter), 21% lower compared to the prior quarter, with silver production 25% lower and gold production 17% lower. Year-over-year, silver and gold production decreased 19% and 4%, respectively |
• | Production was impacted by (i) the temporary suspension of mining activities relating to fatalities that occurred during the quarter, (ii) supply chain disruptions stemming from local road blockades that temporarily interrupted the delivery of certain mining consumables, and (iii) a weather-related interruption that impacted the process plant |
• | The modest decline in silver and gold grades was due to the mining of lower grade stopes, primarily at Independencia East. Gold grades are expected to decline in the fourth quarter; however, mining rates are anticipated to return to steady-state levels, partially offsetting the impact of the lower expected grades |
• | Development towards the La Nación deposit, located between the Independencia and Guadalupe underground mines, remains on-schedule and is expected to commence production in 2019, providing anticipated additional high quality mill feed to supplement existing ore sources |
• | Approximately 38% of gold sales in the third quarter, or 10,610 ounces, were sold under Palmarejo's gold stream agreement at a price of $800 per ounce. The increase was due to mine sequencing; fourth quarter gold sales under the stream agreement are expected to remain at similar levels |
• | The Company is maintaining Palmarejo's full-year 2018 production guidance of 7.5 - 7.9 million ounces of silver and 115,000 - 120,000 ounces of gold, or 14.4 - 15.1 million silver equivalent1 ounces (16.8 - 17.6 million ounces based on average spot prices during the third quarter) |
2
Rochester, Nevada
3Q 2018 | 2Q 2018 | 1Q 2018 | 4Q 2017 | 3Q 2017 | |
Tons placed | 4,061,082 | 4,083,028 | 4,351,131 | 4,171,451 | 4,262,011 |
Average silver grade (oz/t) | 0.52 | 0.53 | 0.54 | 0.50 | 0.53 |
Average gold grade (oz/t) | 0.004 | 0.004 | 0.003 | 0.003 | 0.004 |
Ounces Produced | |||||
Silver (000's) | 1,290 | 1,125 | 1,157 | 1,361 | 1,070 |
Gold | 14,702 | 12,273 | 11,487 | 18,995 | 10,955 |
Silver equivalent1 (000's) | 2,172 | 1,861 | 1,846 | 2,500 | 1,727 |
Silver equivalent1 (average spot) (000's) | 2,477 | 2,095 | 2,067 | 2,808 | 1,901 |
Ounces Sold | |||||
Silver (000's) | 1,248 | 1,097 | 1,119 | 1,457 | 1,050 |
Gold | 14,257 | 12,030 | 11,163 | 20,002 | 10,390 |
Silver equivalent1 (000's) | 2,104 | 1,819 | 1,789 | 2,658 | 1,674 |
Silver equivalent1 (average spot) (000's) | 2,400 | 2,048 | 2,004 | 2,983 | 1,839 |
Average realized price per silver ounce | $14.70 | $16.47 | $16.66 | $16.58 | $16.89 |
Average realized price per gold ounce | $1,204 | $1,297 | $1,331 | $1,279 | $1,291 |
• | Silver equivalent1 production during the period was 17% higher quarter-over-quarter at 2.2 million ounces (2.5 million ounces based on average spot prices during the third quarter). Silver production was 1.3 million ounces and gold production was 14,702 ounces, 15% and 20% higher, respectively, compared to the prior quarter |
• | Production growth was driven primarily by strong pad performance from the Stage III leach pad and continued steady performance of the Stage IV leach pad. Stage III leach pad performance was driven by leaching activities on the periphery of the pad that had not been processed previously. These trends are expected to continue in the fourth quarter |
• | Installation of an initial high-pressure grinding roll ("HPGR") remains on schedule for the first quarter of 2019 with silver recoveries expected to improve beginning as early as the second quarter of next year. Decommissioning of the 15,000 tons per day ("tpd") crusher is currently underway and is expected to result in fewer tons crushed and lower operating expenses in the fourth quarter |
• | The Company is maintaining full-year 2018 production guidance of 4.8 - 5.2 million ounces of silver and 48,000 - 52,000 ounces of gold, or 7.7 - 8.3 million silver equivalent1 ounces (8.7 - 9.4 million ounces based on average spot prices during the third quarter) |
3
Wharf, South Dakota
3Q 2018 | 2Q 2018 | 1Q 2018 | 4Q 2017 | 3Q 2017 | |
Tons placed | 1,127,391 | 1,075,820 | 1,076,395 | 1,124,785 | 1,150,308 |
Average gold grade (oz/t) | 0.023 | 0.023 | 0.022 | 0.029 | 0.029 |
Ounces produced | |||||
Gold | 19,437 | 22,507 | 17,936 | 27,292 | 25,849 |
Silver (000's) | 13 | 13 | 12 | 16 | 15 |
Gold equivalent1 | 19,646 | 22,729 | 18,133 | 27,560 | 26,096 |
Ounces sold | |||||
Gold | 19,874 | 23,053 | 17,339 | 28,975 | 23,855 |
Silver (000's) | 12 | 14 | 11 | 16 | 14 |
Gold equivalent1 | 20,081 | 23,282 | 17,522 | 29,256 | 24,085 |
Average realized price per gold ounce | $1,198 | $1,285 | $1,341 | $1,278 | $1,304 |
• | Gold production declined 14% quarter-over-quarter to 19,646 ounces partially as a result of unplanned weather-related downtime and timing of leach pad recoveries |
• | Mining and crushing rates during the fourth quarter are expected to increase while average gold grade is expected to remain relatively constant |
• | The Company is maintaining full-year 2018 production guidance of 85,000 - 90,000 ounces of gold |
Kensington, Alaska
3Q 2018 | 2Q 2018 | 1Q 2018 | 4Q 2017 | 3Q 2017 | |
Tons milled | 167,964 | 168,751 | 158,706 | 167,631 | 172,038 |
Average gold grade (oz/t) | 0.17 | 0.16 | 0.17 | 0.22 | 0.17 |
Average recovery rate | 91.8% | 92.6% | 94.0% | 92.8% | 94.1% |
Gold ounces produced | 26,809 | 25,570 | 26,064 | 34,932 | 27,541 |
Gold ounces sold | 25,648 | 28,165 | 27,763 | 35,634 | 29,173 |
Average realized price per gold ounce | $1,161 | $1,269 | $1,307 | $1,244 | $1,255 |
• | Third quarter gold production, inclusive of pre-commercial production from Jualin, increased 5% quarter-over-quarter and declined 3% year-over-year to 26,809 ounces |
• | At Jualin, the Company mined approximately 4,400 tons of development ore late in the quarter, which yielded pre-commercial production of nearly 2,100 ounces of gold at a grade of 0.48 ounces per ton ("oz/t"). Mining rates at Jualin are expected to climb throughout the fourth quarter leading to higher overall production levels |
• | The Company is maintaining full-year 2018 production guidance of 115,000 - 120,000 ounces of gold4 |
4
Silvertip, British Columbia
3Q 2018 | 2Q 2018 | 1Q 2018 | 4Q 2017 | 3Q 2017 | |
Tons milled | 28,080 | 14,450 | 4,795 | — | — |
Average silver grade (oz/t) | 7.29 | 14.15 | 10.05 | — | — |
Average zinc grade (%) | 8.0% | 8.2% | 6.60 | — | — |
Average lead grade (%) | 4.6% | 8.1% | 7.3% | —% | —% |
Average recovery rate – Ag | 47.0% | 42.3% | 30.9% | —% | —% |
Average recovery rate – Zn | 49.1% | 57.9% | 18.7% | —% | —% |
Average recovery rate – Pb | 44.4% | 40.5% | 21.1% | —% | —% |
Produced | |||||
Silver (000's ounces) | 96 | 87 | 15 | — | — |
Zinc (000's lbs) | 2,207 | 1,372 | 119 | — | — |
Lead (000's lbs) | 1,159 | 949 | 147 | — | — |
Silver equivalent1 (000's) | 286 | 217 | 29 | — | — |
Silver equivalent1 (average spot) (000's) | 342 | 277 | 36 | — | |
Sold | |||||
Silver (000's ounces) | 131 | 10 | — | — | — |
Zinc (000's lbs) | 1,772 | 469 | — | — | — |
Lead (000's lbs) | 1,645 | — | — | — | — |
Silver equivalent1 (000's) | 320 | 38 | — | — | — |
Silver equivalent1 (average spot) (000's) | 371 | 52 | — | — | — |
Average realized price per silver ounce | $14.95 | $13.01 | — | — | — |
Average realized price per zinc pound | $0.93 | $1.08 | — | — | — |
Average realized price per lead pound | $0.99 | $— | — | — | — |
• | Silvertip achieved commercial production on September 1, 2018. The production figures and average realized prices shown in the above table include pre-commercial production |
• | During the third quarter, mill downtime impacted throughput, which averaged approximately 434 tons (approximately 394 metric tonnes) per day. Mill downtime was required to complete repairs on the paste plant, grinding circuit and associated infrastructure in the process plant |
• | Higher mill availability is expected to improve throughput in the fourth quarter, which is anticipated to reach an average of approximately 830 tons per day (750 metric tonnes per day) by year-end |
• | Operating activities remain focused on improving process plant performance, underground rehabilitation and development, and completing several key surface infrastructure projects, including the water treatment plant and a 220-person camp facility |
• | Coeur expects to file an initial NI 43-101 Technical Report in the fourth quarter and receive approval for the permit amendment application to operate at 1,000 metric tonnes per day on a year-round basis in early 2019 |
• | The Company is maintaining full-year 2018 production guidance of 0.7 - 1.2 million ounces of silver, 13.0 - 23.0 million pounds of zinc and 11.0 - 18.0 million pounds of lead, or 2.0 - 3.5 million silver equivalent1 ounces (2.4 - 4.1 million ounces based on average spot prices during the third quarter)4 |
5
2018 Production Guidance
Coeur's 2018 production guidance was revised on September 4, 2018 to reflect improved visibility of Silvertip's production following the commencement of commercial production as well as stronger than expected performance at Rochester during the first half of the year.
Silver | Gold | Zinc | Lead | Silver Equivalent1 | |
(K oz) | (oz) | (K lbs) | (K lbs) | (K oz) | |
Palmarejo | 7,500 - 7,900 | 115,000 - 120,000 | — | — | 14,400 - 15,100 |
Rochester | 4,800 - 5,200 | 48,000 - 52,000 | — | — | 7,680 - 8,320 |
Kensington | — | 115,000 - 120,000 | — | — | 6,900 - 7,200 |
Wharf | — | 85,000 - 90,000 | — | — | 5,100 - 5,400 |
Silvertip | 700 - 1,200 | — | 13,000 - 23,000 | 11,000 - 18,000 | 2,030 - 3,480 |
Total | 13,000 - 14,300 | 363,000 - 382,000 | 13,000 - 23,000 | 11,000 - 18,000 | 36,110 - 39,500 |
Guidance Based on Third Quarter Average Spot Prices
Silver | Gold | Zinc | Lead | Silver Equivalent1 | |
(K oz) | (oz) | (K lbs) | (K lbs) | (K oz) | |
Palmarejo | 7,500 - 7,900 | 115,000 - 120,000 | — | — | 16,787 - 17,591 |
Rochester | 4,800 - 5,200 | 48,000 - 52,000 | — | — | 8,676 - 9,399 |
Kensington | — | 115,000 - 120,000 | — | — | 9,287 - 9,691 |
Wharf | — | 85,000 - 90,000 | — | — | 6,865 - 7,268 |
Silvertip | 700 - 1,200 | — | 13,000 - 23,000 | 11,000 - 18,000 | 2,391 - 4,099 |
Total | 13,000 - 14,300 | 363,000 - 382,000 | 13,000 - 23,000 | 11,000 - 18,000 | 44,007 - 48,049 |
Financial Results and Conference Call
Coeur will report its third quarter 2018 financial results on October 31, 2018 after the New York Stock Exchange closes for trading. There will be a conference call on November 1, 2018 at 11:00 a.m. Eastern Time.
Dial-In Numbers: (855) 560-2581 (U.S.)
(855) 669-9657 (Canada)
(412) 542-4166 (International)
Conference ID: Coeur Mining
Hosting the call will be Mitchell J. Krebs, President and Chief Executive Officer of Coeur, who will be joined by Peter C. Mitchell, Senior Vice President and Chief Financial Officer, Frank L. Hanagarne, Jr., Senior Vice President and Chief Operating Officer, Terry F. D. Smith, Vice President of North American Operations, Hans Rasmussen, Senior Vice President of Exploration, and other members of management. A replay of the call will be available through November 15, 2018.
Replay numbers: (877) 344-7529 (U.S.)
(855) 669-9658 (Canada)
6
(412) 317-0088 (International)
Conference ID: 101 23 688
The Company anticipates reporting its fourth quarter 2018 financial results on February 13, 2019 after the New York Stock Exchange closes for trading and holding a conference call on February 14, 2019 at 11:00 am Eastern Time.
About Coeur
Coeur Mining, Inc. is a well-diversified, growing precious metals producer with five mines in North America. Coeur produces from its wholly-owned operations: the Palmarejo silver-gold complex in Mexico, the Silvertip silver-zinc-lead mine in British Columbia, the Rochester silver-gold mine in Nevada, the Wharf gold mine in South Dakota, and the Kensington gold mine in Alaska. In addition, the Company has interests in several precious metals exploration projects throughout North America.
Cautionary Statement
This news release contains forward-looking statements within the meaning of securities legislation in the United States and Canada, including statements regarding anticipated production, grades, mining rates, crushing rates, development efforts, operations at Rochester and Silvertip, gold sales under Palmarejo's gold stream agreement and timing of filing a technical report and obtaining permit amendment approval for Silvertip. Such forward-looking statements involve known and unknown risks, uncertainties and other factors which may cause Coeur's actual results, performance or achievements to be materially different from any future results, performance or achievements expressed or implied by the forward-looking statements. Such factors include, among others, the risk that anticipated production levels are not attained, the risks and hazards inherent in the mining business (including risks inherent in developing large-scale mining projects, environmental hazards, industrial accidents, weather or geologically related conditions), changes in the market prices of gold, silver, zinc, and lead and a sustained lower price environment, the uncertainties inherent in Coeur's production, exploratory and developmental activities, including risks relating to permitting and regulatory delays, ground conditions, grade variability, any future labor disputes or work stoppages, the uncertainties inherent in the estimation of gold and silver reserves, changes that could result from Coeur's future acquisition of new mining properties or businesses, the loss of any third-party smelter to which Coeur markets its production, the effects of environmental and other governmental regulations, the risks inherent in the ownership or operation of or investment in mining properties or businesses in foreign countries, Coeur's ability to raise additional financing necessary to conduct its business, make payments or refinance its debt, as well as other uncertainties and risk factors set out in filings made from time to time with the United States Securities and Exchange Commission, and the Canadian securities regulators, including, without limitation, Coeur's most recent reports on Form 10-K and Form 10-Q. Actual results, developments and timetables could vary significantly from the estimates presented. Readers are cautioned not to put undue reliance on forward-looking statements. Coeur disclaims any intent or obligation to update publicly such forward-looking statements, whether as a result of new information, future events or otherwise. Additionally, Coeur undertakes no obligation to comment on analyses, expectations or statements made by third parties in respect of Coeur, its financial or operating results or its securities.
Christopher Pascoe, Coeur's Director, Technical Services and a qualified person under Canadian National Instrument 43-101, approved the scientific and technical information concerning Coeur's mineral projects in this news release. For a description of the key assumptions, parameters and methods used to estimate mineral reserves and resources, as well as data verification procedures and a general discussion of the extent to which the estimates may be affected by any known environmental, permitting, legal, title, taxation, socio-political, marketing or other relevant factors, Canadian investors should refer to the Technical Reports for each of Coeur's properties as filed on SEDAR at sedar.com.
Notes
1. | Silver and gold equivalence assumes a 60:1 silver-to-gold ratio, except where noted as average spot prices. Please see the table below for average applicable spot prices and corresponding ratios. Silver and zinc equivalence assumes a 0.06:1 silver-to-zinc ratio. Silver and lead equivalence assumes a 0.05:1 silver-to-lead ratio. |
2. | On February 28, 2018, Coeur divested the San Bartolomé mine through the sale of its 100%-owned Bolivian subsidiary. As a result, San Bartolomé is excluded from consolidated operating statistics for all periods presented unless otherwise noted. |
3. | Third quarter 2018 production and sales figures include pre-commercial production from Kensington and Silvertip. |
4. | Full-year 2018 production guidance for Kensington and Silvertip include pre-commercial production. |
7
Average Spot Prices
3Q 2018 | 2Q 2018 | 1Q 2018 | 4Q 2017 | 3Q 2017 | |||||||||||
Average Silver Spot Price Per Ounce | $ | 15.02 | $ | 16.53 | $ | 16.77 | $ | 16.73 | $ | 16.84 | |||||
Average Gold Spot Price Per Ounce | $ | 1,213 | $ | 1,306 | $ | 1,329 | $ | 1,275 | $ | 1,278 | |||||
Average Silver to Gold Spot Equivalence | 81:1 | 79:1 | 79:1 | 76:1 | 76:1 | ||||||||||
Average Zinc Spot Price Per Pound | $ | 1.15 | $ | 1.41 | $ | 1.55 | $ | 1.47 | $ | 1.06 | |||||
Average Silver to Zinc Spot Equivalence | 0.08:1 | 0.09:1 | 0.09:1 | 0.09:1 | 0.06:1 | ||||||||||
Average Lead Spot Price Per Pound | $ | 0.95 | $ | 1.08 | $ | 1.14 | $ | 1.13 | $ | 1.06 | |||||
Average Silver to Lead Spot Equivalence | 0.06:1 | 0.07:1 | 0.07:1 | 0.07:1 | 0.06:1 | ||||||||||
For Additional Information
Coeur Mining, Inc.
104 S. Michigan Avenue, Suite 900
Chicago, IL 60603
Attention: Paul DePartout, Director, Investor Relations
Phone: (312) 489-5800
www.coeur.com
8