Attached files
| file | filename |
|---|---|
| 8-K - 8-K - KEY ENERGY SERVICES INC | d632245d8k.htm |
Investor Presentation October 2018 J. Marshall Dodson Senior Vice President and Chief Financial Officer Exhibit 99.1
Safe-Harbor Language This presentation contains forward-looking statements within the meaning of the Private Securities Litigation Reform Act of 1995. Statements that are not historical in nature or that relate to future events and conditions are, or may be deemed to be, forward-looking statements. These statements are only predictions and are subject to substantial risks and uncertainties and are not guarantees of performance. Future actions, events and conditions and future results of operations may differ materially from those expressed in these statements. Often, but not always, “forward-looking statements” are identified by words such as “expects,” “believes,” “anticipates” and similar phrases. Important factors that may affect Key’s expectations, estimates or projections include, but are not limited to, the following: conditions in the oil and natural gas industry, especially oil and natural gas prices and capital expenditures by oil and natural gas companies; volatility in oil and natural gas prices; Key’s ability to implement price increases or maintain pricing on its core services; risks that Key may not be able to reduce, and could even experience increases in, the costs of labor, fuel, equipment and supplies employed in Key’s businesses; industry capacity; asset impairments or other charges; the periodic low demand for Key’s services and resulting operating losses and negative cash flows; Key’s highly competitive industry as well as operating risks, which are primarily self-insured, and the possibility that its insurance may not be adequate to cover all of its losses or liabilities; significant costs and potential liabilities resulting from compliance with applicable laws, including those resulting from environmental, health and safety laws and regulations, specifically those relating to hydraulic fracturing, as well as climate change legislation or initiatives; Key’s historically high employee turnover rate and its ability to replace or add workers, including executive officers and skilled workers; Key’s ability to incur debt or long-term lease obligations; Key’s ability to implement technological developments and enhancements; severe weather impacts on Key’s business, including from hurricane activity; Key’s ability to successfully identify, make and integrate acquisitions and its ability to finance future growth of its operations or future acquisitions; Key’s ability to achieve the benefits expected from disposition transactions; the loss of one or more of Key’s larger customers; Key’s ability to generate sufficient cash flow to meet debt service obligations; the amount of Key’s debt and the limitations imposed by the covenants in the agreements governing its debt, including its ability to comply with covenants under its debt agreements; an increase in Key’s debt service obligations due to variable rate indebtedness; Key’s inability to achieve its financial, capital expenditure and operational projections, including quarterly and annual projections of revenue and/or operating income and its inaccurate assessment of future activity levels, customer demand, and pricing stability which may not materialize (whether for Key as a whole or for geographic regions and/or business segments individually); Key’s ability to respond to changing or declining market conditions, including Key’s ability to reduce the costs of labor, fuel, equipment and supplies employed and used in its businesses; Key’s ability to maintain sufficient liquidity; adverse impact of litigation; and other factors affecting Key’s business described in “Item 1A. Risk Factors” in its most recent Annual Report on Form 10-K, recent Quarterly Reports on Form 10 Q, recent Current Reports on Form K and its other filings with the SEC. Given these risks and uncertainties, readers are cautioned not to place undue reliance on forward-looking statements. Unless otherwise required by law, Key disclaims any obligation to update its forward-looking statements.
Third Quarter 2018 Update While demand for completion driven services continues to be stable from the second quarter of 2018 to the third quarter of 2018, customer scheduling changes and staffing challenges are resulting in lower activity and revenue in the Company’s Coiled Tubing Services and Fluid Management Services segments quarter on quarter. The Company continues to experience increasing demand for production and completion services in its Rig Services Segment, particularly in the Permian Basin, however the lack of qualified personnel has slowed growth in the Permian Basin that had been expected to offset the loss of a large customer in California in the third quarter of 2018. Recently implemented low to mid-single digit price increases in the Rig Services Segment are expected to benefit fourth quarter 2018 revenues, with additional and more significant price increases anticipated for the first quarter of 2019. As a result, consolidated revenues are expected to decline five to seven percent from the second to the third quarter of 2018 with operating income margins declining approximately 500 basis points on the lower activity and cost inefficiencies over the same period.
Company Overview
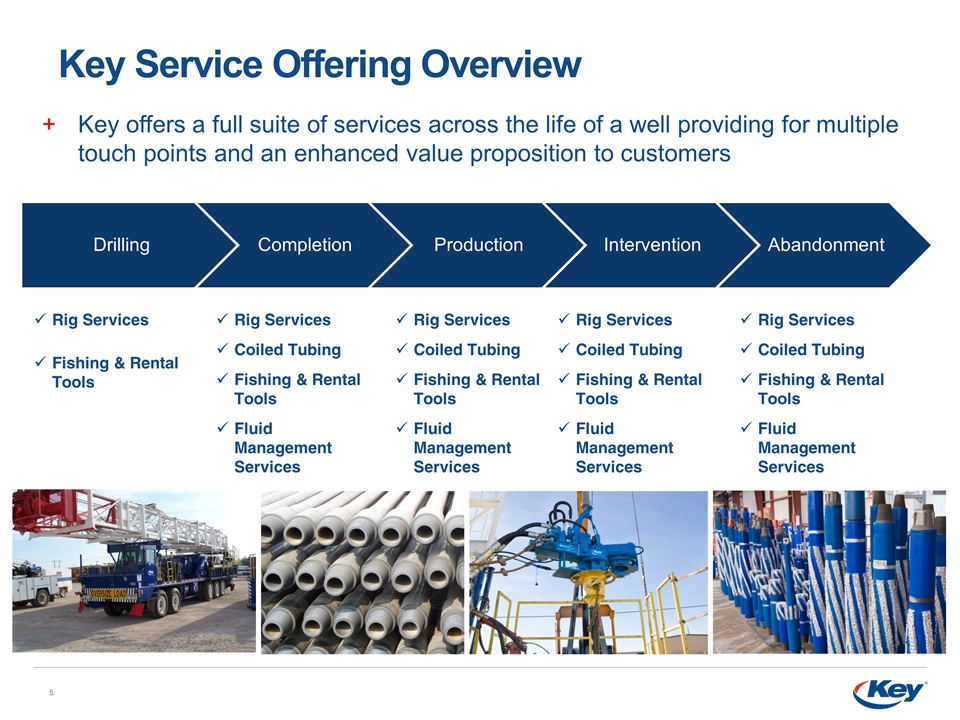
Key Service Offering Overview Rig Services Fishing & Rental Tools Rig Services Coiled Tubing Fishing & Rental Tools Fluid Management Services Rig Services Coiled Tubing Fishing & Rental Tools Fluid Management Services Rig Services Coiled Tubing Fishing & Rental Tools Fluid Management Services Rig Services Coiled Tubing Fishing & Rental Tools Fluid Management Services Key offers a full suite of services across the life of a well providing for multiple touch points and an enhanced value proposition to customers Drilling Completion Production Intervention Abandonment
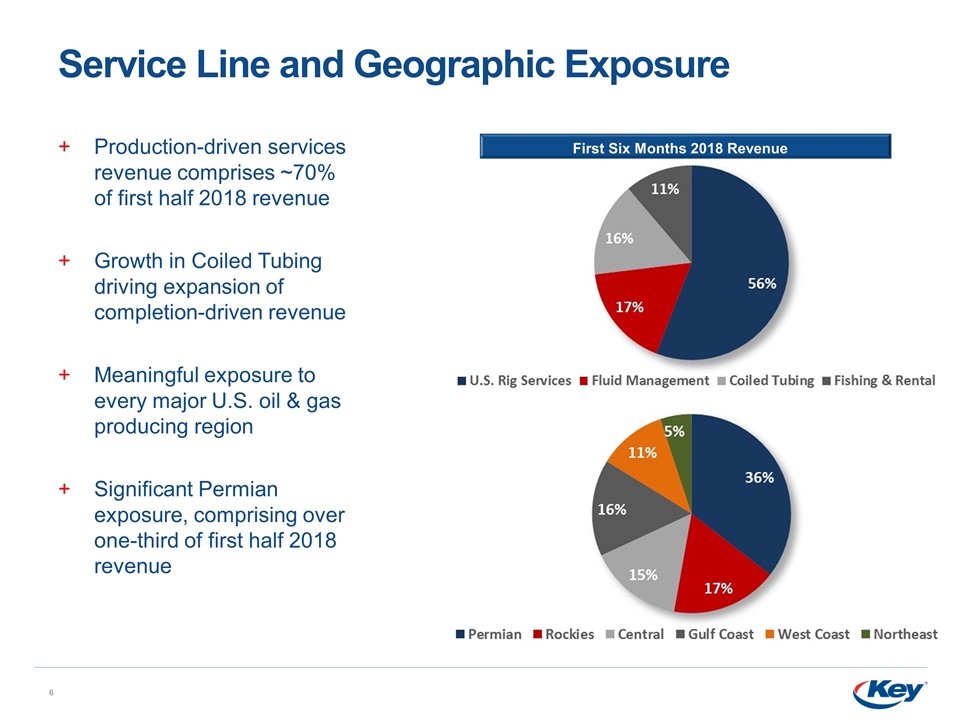
Service Line and Geographic Exposure Production-driven services revenue comprises ~70% of first half 2018 revenue Growth in Coiled Tubing driving expansion of completion-driven revenue Meaningful exposure to every major U.S. oil & gas producing region Significant Permian exposure, comprising over one-third of first half 2018 revenue First Six Months 2018 Revenue
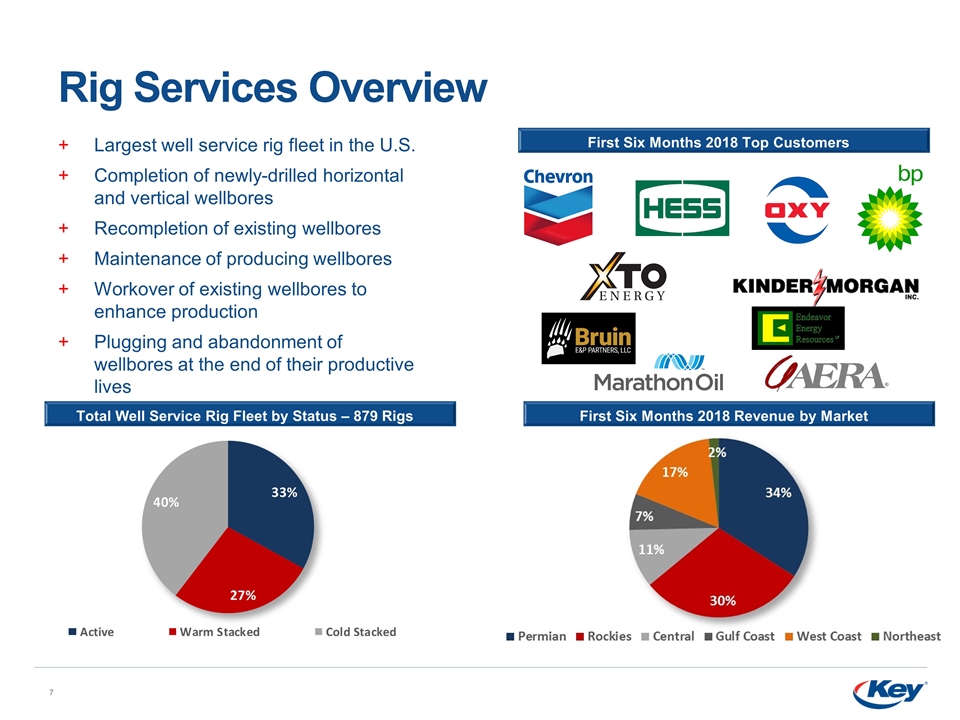
Rig Services Overview Largest well service rig fleet in the U.S. Completion of newly-drilled horizontal and vertical wellbores Recompletion of existing wellbores Maintenance of producing wellbores Workover of existing wellbores to enhance production Plugging and abandonment of wellbores at the end of their productive lives First Six Months 2018 Top Customers First Six Months 2018 Revenue by Market Total Well Service Rig Fleet by Status – 879 Rigs
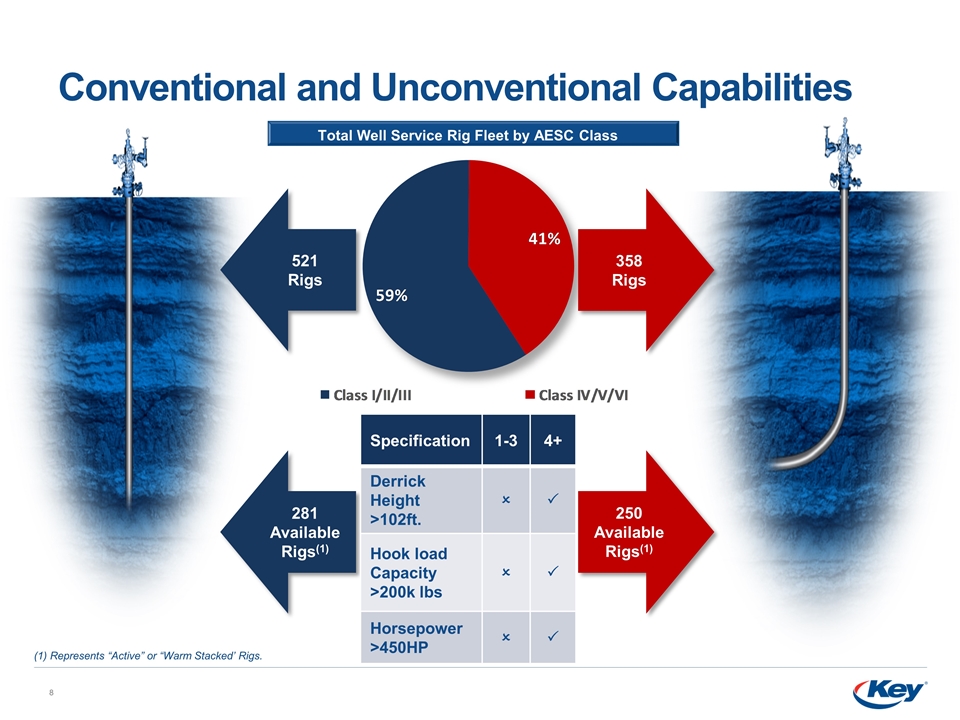
Conventional and Unconventional Capabilities (1) Represents “Active” or “Warm Stacked’ Rigs. 358 Rigs 521 Rigs 250 Available Rigs(1) 281 Available Rigs(1) Specification 1-3 4+ Derrick Height >102ft. O P Hook load Capacity >200k lbs O P Horsepower >450HP O P Total Well Service Rig Fleet by AESC Class
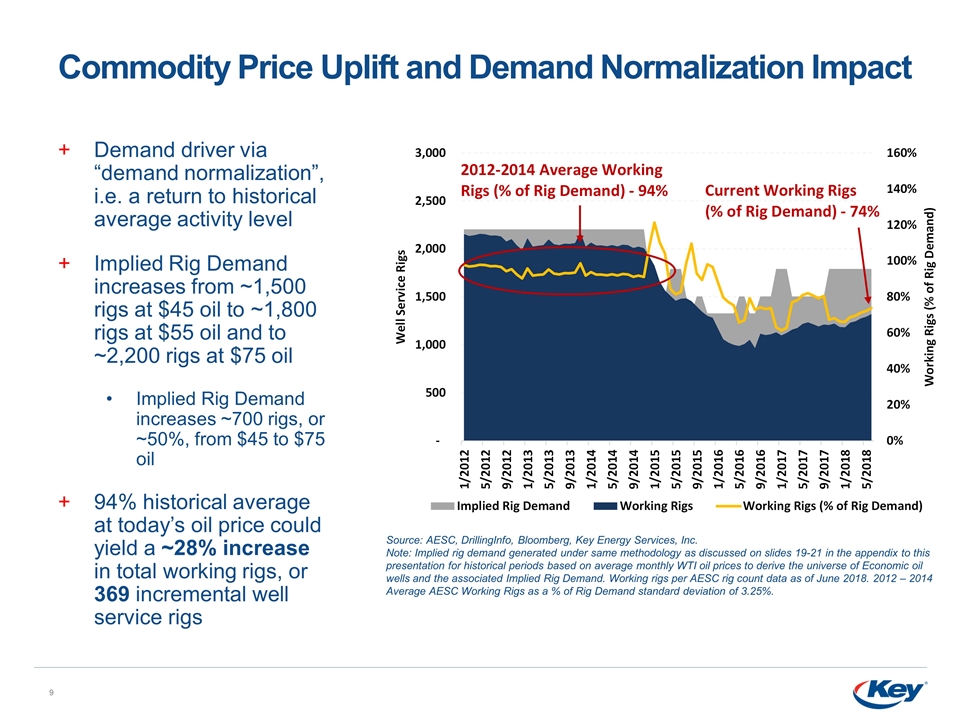
Commodity Price Uplift and Demand Normalization Impact Demand driver via “demand normalization”, i.e. a return to historical average activity level Implied Rig Demand increases from ~1,500 rigs at $45 oil to ~1,800 rigs at $55 oil and to ~2,200 rigs at $75 oil Implied Rig Demand increases ~700 rigs, or ~50%, from $45 to $75 oil 94% historical average at today’s oil price could yield a ~28% increase in total working rigs, or 369 incremental well service rigs Source: AESC, DrillingInfo, Bloomberg, Key Energy Services, Inc. Note: Implied rig demand generated under same methodology as discussed on slides 19-21 in the appendix to this presentation for historical periods based on average monthly WTI oil prices to derive the universe of Economic oil wells and the associated Implied Rig Demand. Working rigs per AESC rig count data as of June 2018. 2012 – 2014 Average AESC Working Rigs as a % of Rig Demand standard deviation of 3.25%.
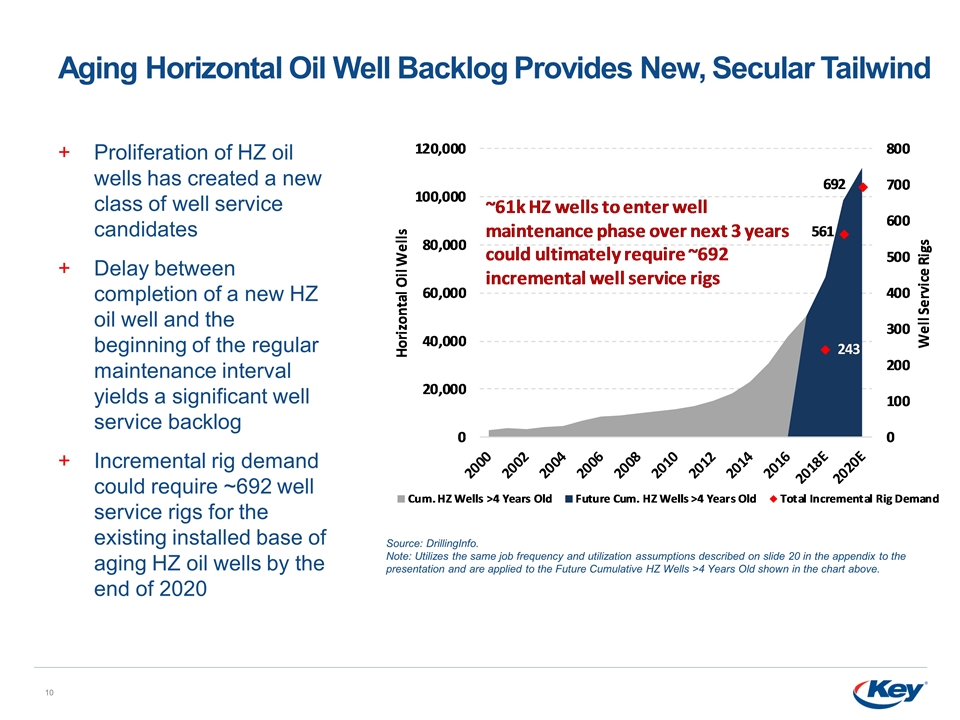
Aging Horizontal Oil Well Backlog Provides New, Secular Tailwind Source: DrillingInfo. Note: Utilizes the same job frequency and utilization assumptions described on slide 20 in the appendix to the presentation and are applied to the Future Cumulative HZ Wells >4 Years Old shown in the chart above. Proliferation of HZ oil wells has created a new class of well service candidates Delay between completion of a new HZ oil well and the beginning of the regular maintenance interval yields a significant well service backlog Incremental rig demand could require ~692 well service rigs for the existing installed base of aging HZ oil wells by the end of 2020
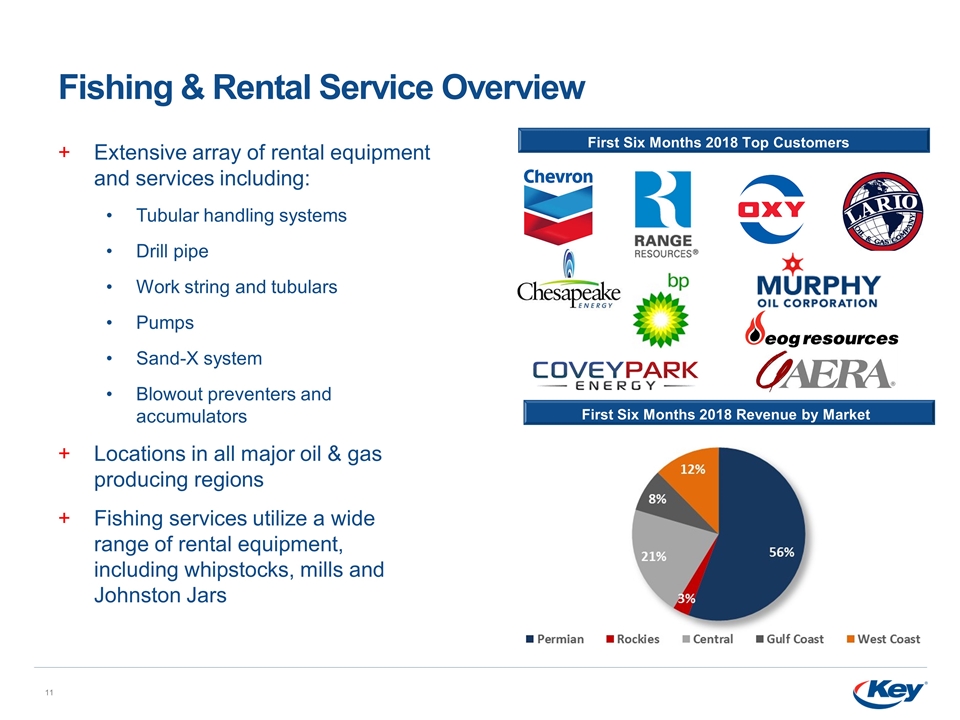
Fishing & Rental Service Overview Extensive array of rental equipment and services including: Tubular handling systems Drill pipe Work string and tubulars Pumps Sand-X system Blowout preventers and accumulators Locations in all major oil & gas producing regions Fishing services utilize a wide range of rental equipment, including whipstocks, mills and Johnston Jars First Six Months 2018 Top Customers First Six Months 2018 Revenue by Market
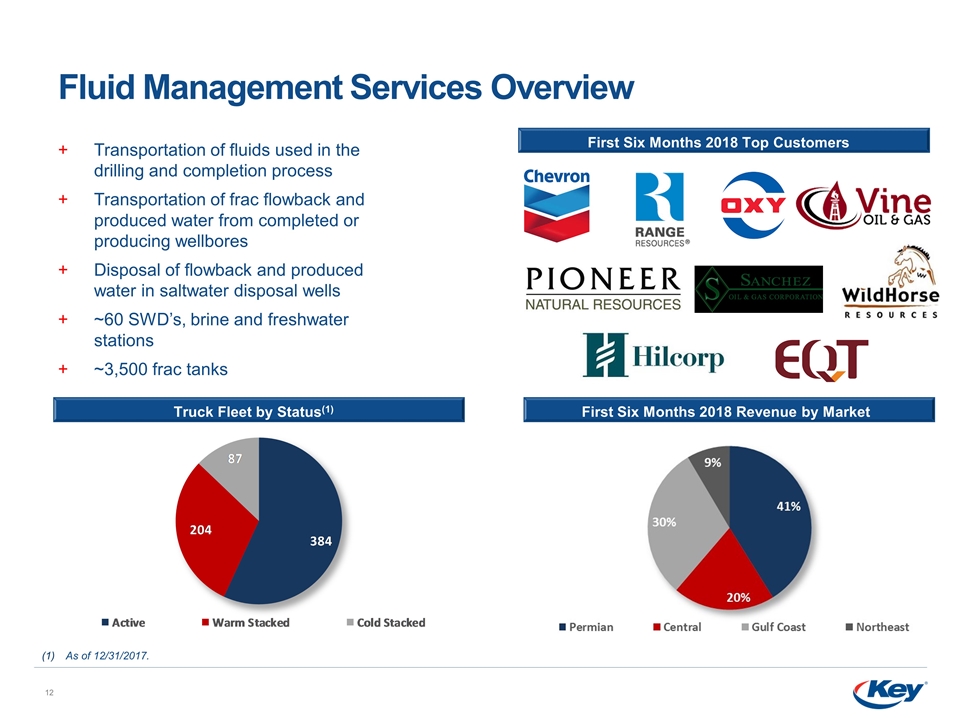
Fluid Management Services Overview Transportation of fluids used in the drilling and completion process Transportation of frac flowback and produced water from completed or producing wellbores Disposal of flowback and produced water in saltwater disposal wells ~60 SWD’s, brine and freshwater stations ~3,500 frac tanks First Six Months 2018 Top Customers First Six Months 2018 Revenue by Market As of 12/31/2017. Truck Fleet by Status(1)
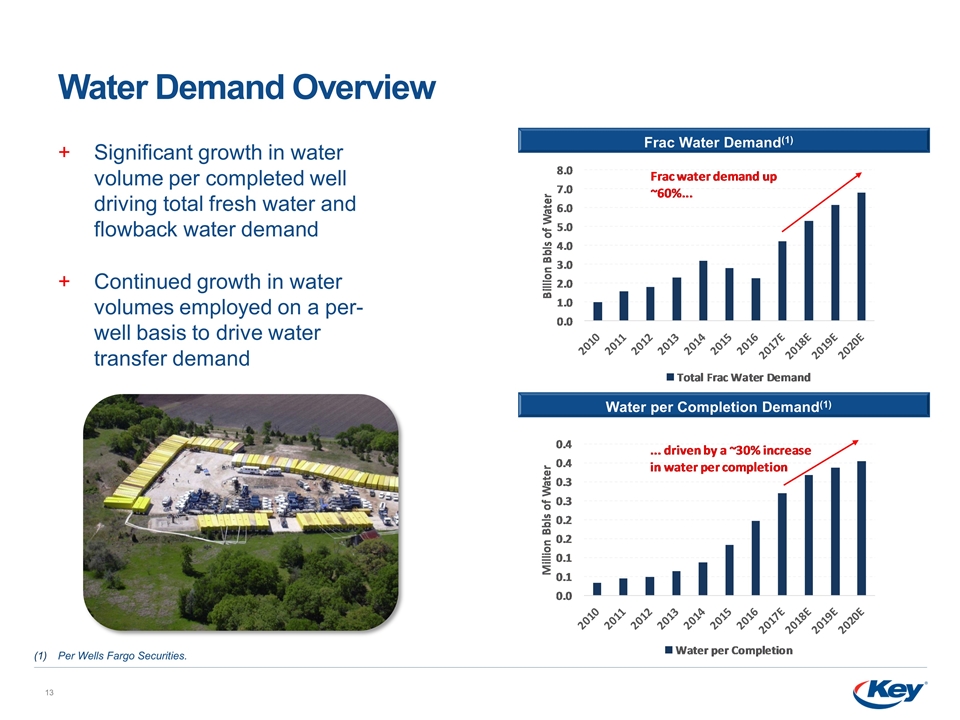
Water Demand Overview Significant growth in water volume per completed well driving total fresh water and flowback water demand Continued growth in water volumes employed on a per-well basis to drive water transfer demand Frac Water Demand(1) Per Wells Fargo Securities. Water per Completion Demand(1)
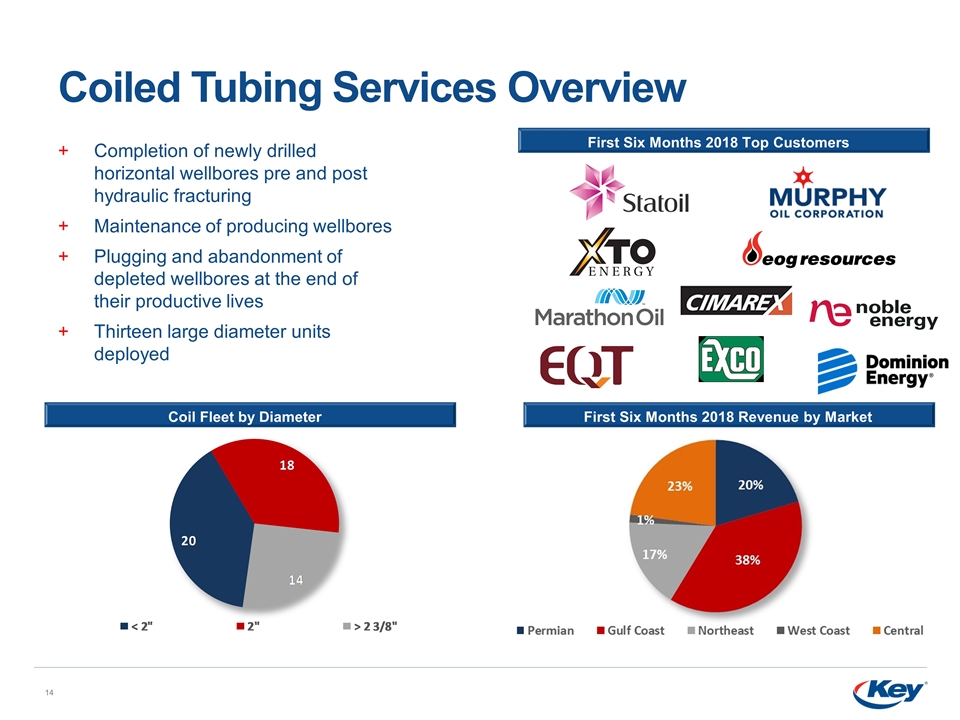
Coiled Tubing Services Overview Completion of newly drilled horizontal wellbores pre and post hydraulic fracturing Maintenance of producing wellbores Plugging and abandonment of depleted wellbores at the end of their productive lives Thirteen large diameter units deployed First Six Months 2018 Top Customers First Six Months 2018 Revenue by Market Coil Fleet by Diameter
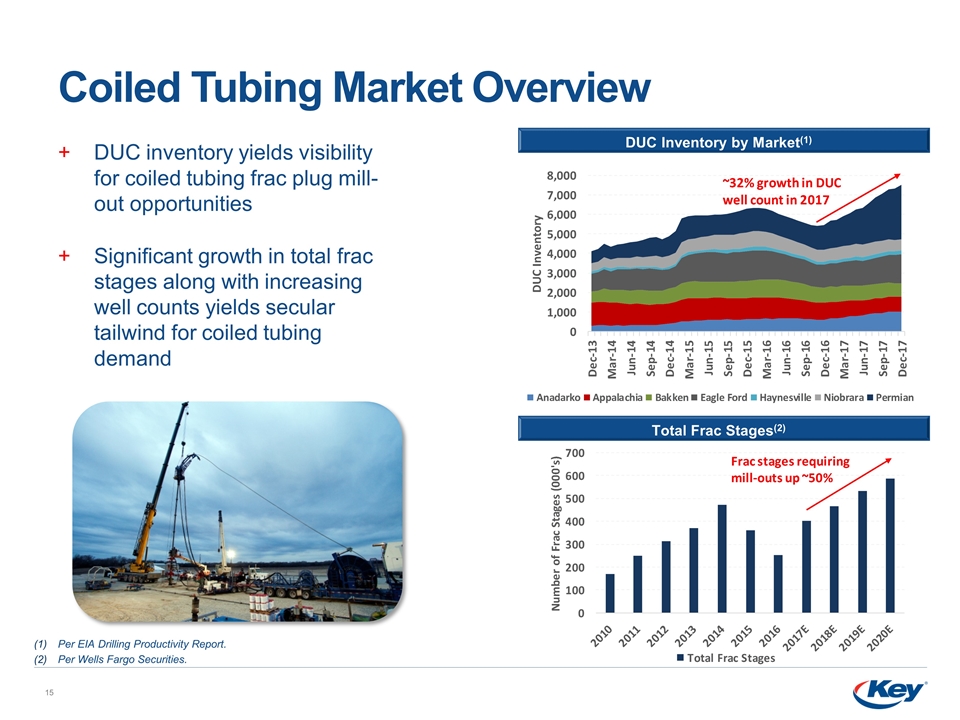
Coiled Tubing Market Overview DUC Inventory by Market(1) Total Frac Stages(2) DUC inventory yields visibility for coiled tubing frac plug mill-out opportunities Significant growth in total frac stages along with increasing well counts yields secular tailwind for coiled tubing demand Per EIA Drilling Productivity Report. Per Wells Fargo Securities.
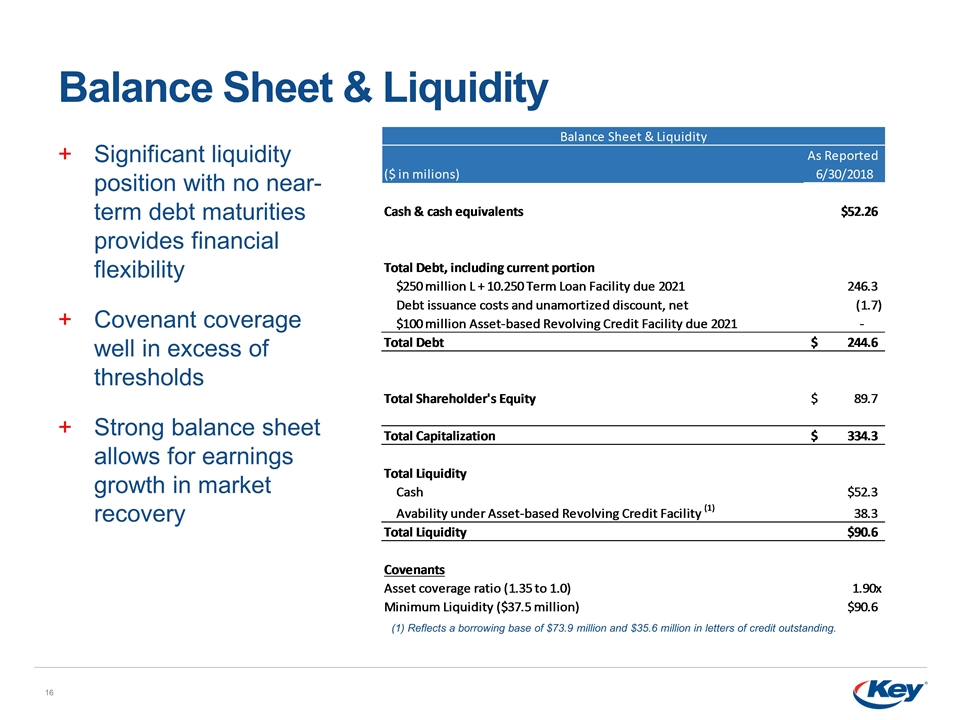
Balance Sheet & Liquidity Significant liquidity position with no near-term debt maturities provides financial flexibility Covenant coverage well in excess of thresholds Strong balance sheet allows for earnings growth in market recovery (1) Reflects a borrowing base of $73.9 million and $35.6 million in letters of credit outstanding.
Final Thoughts Well positioned for future growth through exposure to secular growth and cyclical recovery Completions driving demand for Coiled Tubing, Fluid Management and Rig Services Growing population of aging horizontal wells to provide new, incremental demand for production services Recovery in oil prices to provide for cyclical recovery in production services Strong geographical footprint with significant Permian Basin exposure Meaningful presence in all major U.S. oil & gas producing regions Provides exposure to regional secular and cyclical demand dynamics Poised to benefit from market recovery and growth via significant operating leverage Limited capital needs to reactivate assets to achieve 2014 activity levels Structural changes to cost structure allow for enhanced financial performance Focused on delivering value to shareholders
