Attached files
| file | filename |
|---|---|
| EX-99.3 - EX-99.3 - ENPRO INDUSTRIES, INC | d521011dex993.htm |
| EX-99.2 - EX-99.2 - ENPRO INDUSTRIES, INC | d521011dex992.htm |
| 8-K - 8-K - ENPRO INDUSTRIES, INC | d521011d8k.htm |
Exhibit 99.1
SUMMARY
This summary highlights significant aspects of our business and this offering, but it is not complete and may not contain all of the information that may be important to you. You should read this entire offering memorandum carefully, including the historical financial statements and their related notes included elsewhere or incorporated by reference in this offering memorandum. Investing in the notes involves significant risks, as described in the “Risk Factors” section. In this offering memorandum, unless otherwise indicated or the context otherwise requires, references to the terms “we,” “us,” “our,” the “Issuer,” “EnPro” or the “Company” refer to EnPro Industries, Inc. and its subsidiaries. All financial data presented in this offering memorandum is the financial data of EnPro Industries, Inc. and its consolidated subsidiaries unless otherwise indicated.
Company Overview
We are a leader in the design, development, manufacture and marketing of proprietary engineered industrial products that primarily include: sealing products; heavy-duty truck wheel-end components and systems; self-lubricating non-rolling bearing products; precision engineered components and lubrication systems for reciprocating compressors and engines; and heavy-duty, medium-speed diesel, natural gas and dual fuel reciprocating engines, including parts and services. We serve a diverse set of end markets and customers with leading brands, including Garlock®, STEMCO®, GGB® and Fairbanks Morse®. We believe our products are considered by our customers to be best-in-class due to a history of performance in critical and demanding applications where there is a high cost for failure. At December 31, 2017, we operated 54 primary manufacturing facilities located in 12 countries, including the United States. For the year ended December 31, 2017, we generated $1,309.6 million of consolidated net sales and $187.7 million of Adjusted EBITDA, see “—Summary Historical Consolidated Financial Information and Other Data.”
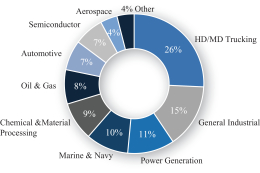
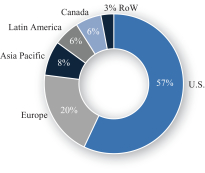
The charts below highlight our diversity of net sales by end market and geography (which is presented on a pro forma basis as if the reconsolidation of GST and OldCo had occurred on January 1, 2017):
| 2017 Pro Forma Sales by End Use Market
|
2017 Pro Forma Sales by Geography
| |
|
|
Consolidated Operations
We manage our business as three segments: Sealing Products, Engineered Products, and Power Systems. Our reportable segments are managed separately based on differences in their products and services and their end-customers. Segment Adjusted EBITDA is segment profit (which is the total segment revenue reduced by operating expenses and other costs identifiable with the segment) before depreciation and amortization expense, restructuring costs, acquisition expenses and fair value adjustment to acquisition date inventory, see “—Summary Historical Consolidated Financial Information and Other Data.”
1
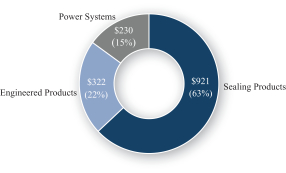
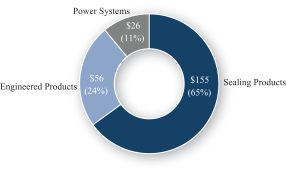
The following charts set forth the sales and Segment Adjusted EBITDA of each of our segments for the last twelve months ended June 30, 2018.
| LTM June 30, 2018 | ||
| (dollars in millions) Segment Sales
|
Segment Adjusted EBITDA
| |
|
|
| |
Segment Overview of EnPro Industries
| Segments |
Sealing Products |
Engineered Products |
Power Systems | |||||||||
| LTM June 30, 2018 |
Sales(1): $921 million Segment Adjusted EBITDA(2): $155 million Segment Adjusted EBITDA Margin(3): 17% |
Sales(1): $322 million Segment Adjusted EBITDA(2): $56 million Segment Adjusted EBITDA Margin(3): 17% |
Sales(1): $230 million Segment Adjusted EBITDA(2): $26 million Segment Adjusted EBITDA Margin(3): 11% | |||||||||
|
|
|
|
|
|
| |||||||
| Products |
• Gaskets & Packing • Oil Seals • Pipeline Insulating Products |
• High Performance Metal Seals • Brush Seals • Bellows • Turbine Hot Gas Path Section Components • Polymer Products |
• Wheel End • Suspension • Brake Products • Innovative Tire and Mileage Systems |
• Plain Bearings • Bushing Blocks • Bearing Assemblies |
• Sealing Components, Valves and Lubrication Systems for Reciprocating Compressors |
• Medium-speed Diesel Engines • Parts & Service • Systems Packager | ||||||
| End Markets |
• General Industry • Oil & Gas • Basic Materials • Chemical Processing • Power Generation • Food & Beverage |
• Electronics & Semiconductors • Aerospace • Power Generation • General Industry • Oil & Gas |
• Heavy-Duty Truck and Trailer • Medium Duty Vocational Truck |
• Auto • Construction & Agriculture • Fluid Power • General Industry |
• Oil & Gas • Compressors • Services • Chemical Processing • Other Industries |
• Commercial • Government | ||||||
| Representative Customers |
• BASF • Chevron • Daewoo E&C • Dow • Duke Power • GE • Nestlé • Saudi Aramco • ThyssenKrupp |
• Applied Materials • Electricite de France • GE • Honeywell • Parker Hannifin • Schlumberger |
• FedEx • H-E-B • Utility • Mack • UPS • Volvo • Wal-Mart |
• Alstom • Bosch • Caterpillar • Casappa • Emerson • United Technologies • John Deere |
• Apache • Air Products • Dow • GE • Graham Packaging • Shell • Tesoro |
• U.S. Navy • U.S. Coast Guard • Naval Shipyards • Northrop Grumman • General Dynamics NASSCO • Lockheed Martin • Electricite de France • EcoPetrol | ||||||


| (1) | Sales for each segment include intersegment sales. Intersegment sales for the twelve months ended June 30, 2018 were $4.3 million. |
| (2) | Segment Adjusted EBITDA is segment profit before depreciation and amortization, restructuring costs, acquisition expenses and fair value adjustment to acquisition date inventory. Segment profit does not include an allocation of corporate expenses. For a presentation of segment profit and the calculation of Segment Adjusted EBITDA, see “—Summary Historical Consolidated Financial Information and Other Data.” |
| (3) | Segment Adjusted EBITDA Margin is Segment Adjusted EBITDA divided by segment sales. |
2
Sealing Products Segment
Our Sealing Products segment includes three operating divisions, Garlock, Technetics and Stemco, that serve a wide variety of industries where performance and durability are vital for safety and environmental protection. Our products are used in many demanding environments such as those characterized by high pressure, high temperature and chemical corrosion, and many of our products support critical applications with a low tolerance for failure.
The Garlock family of companies designs, manufactures and sells sealing products, including: metallic, non-metallic and composite material gaskets; dynamic seals; compression packing; hydraulic components; expansion joints; flange sealing and isolation products; pipeline casing spacers/isolators; casing end seals; and modular sealing systems for sealing pipeline penetrations. These products are used in a variety of industries, including chemical and petrochemical processing, petroleum extraction and refining, pulp and paper processing, power generation, food and pharmaceutical processing, primary metal manufacturing, mining and water. Among the well-known brand names are Garlock®, Gylon®, Klozure®, GuardianTM, Pikotek®, EVSPTM and Gar-Seal®.
Technetics designs, manufactures and sells high performance metal seals, mechanical seals, elastomeric seals, edge-welded bellows, pedestals for semiconductor manufacturing, and a wide range of polytetrafluoroethylene (“PTFE”) products. These products are used in a variety of industries, including semiconductor, aerospace, industrial gas, power generation, oil and gas, life sciences and other industries. Brands include Helicoflex®, Belfab®, Feltmetal®, Bladesafe®, Texolon®, VitaFlex®, Cefil’Air® and Origraf®.
Stemco designs, manufactures and sells heavy-duty truck wheel-end components and systems including: seals; hubcaps; mileage counters; bearings; locking nuts; brake products, such as brake drums, automatic brake adjusters, brake friction and shoes, brake pads, hardware and brake kits; suspension components, such as steering knuckle king-pins and bushings, spring pins and bushings, other polymer bushing components, and air springs for tractor, trailer and cab suspensions; and automatic tire inflation systems, RF-based tire pressure monitoring and inflation systems and automated mileage collection devices, as well as trailer aerodynamic devices designed to increase fuel efficiency. Its products primarily serve the medium and heavy-duty commercial vehicle market. Product brands include STEMCO®, STEMCO Kaiser®, STEMCO Duroline®, STEMCO Crewson®, STEMCO Motor Wheel®, Grit Guard®, Guardian HP®, Voyager®, Discover®, Endeavor®, Pro-Torq®, Zip-Torq®, Sentinel®, Defender®, Data Trac®, QwikKit®, Centrifuse®, AerisTM, Aeris Smart SenseTM, BAT RF®, TrailerTail®, Spring Ride® and Super Cushion®.
Customers
Our Sealing Products segment sells products to industrial agents and distributors, original equipment manufacturers (“OEMs”), engineering and construction firms and end users worldwide. Sealing products are offered to global customers, with approximately 35% of sales delivered to customers outside the United States in 2017. In 2017, the largest customer accounted for approximately 10% of segment revenues.
Raw Materials and Components
Our Sealing Products segment uses PTFE resins, aramid fibers, specialty elastomers, elastomeric compounds, graphite and carbon, common and exotic metals, cold-rolled steel, leather, aluminum die castings, nitrile rubber, powdered metal components, and various fibers and resins. We believe all of these raw materials and components are readily available from various suppliers.
Engineered Products Segment
Our Engineered Products segment includes two high performance industrial products businesses: GGB and Compressor Products International (CPI).
3
GGB designs, manufactures and sells self-lubricating, non-rolling, metal polymer, engineered plastics, and fiber reinforced composite bearing products, as well as aluminum bushing blocks for hydraulic applications. The bearing surfaces are often made of PTFE or a mixture that includes PTFE to provide maintenance-free performance and reduced friction. GGB’s bearing products typically perform as sleeve bearings or thrust washers under conditions of no lubrication, minimal lubrication or pre-lubrication. These products are used in a wide variety of markets such as the automotive, aerospace, pump and compressor, construction, power generation and general industrial markets. GGB has approximately 20,000 bearing part numbers of different designs and physical dimensions. GGB is a leading and well recognized brand name and sells products under the DU®, DP®, DX®, DS®, HI-EX®, EP™, SY™, HPMB™ and GAR-MAX™ names.
CPI designs, manufactures, sells and services components for reciprocating compressors and engines. These components, which include packing and wiper rings, piston and rider rings, compressor valve assemblies, divider block valves, compressor monitoring systems, lubrication systems and related components are utilized primarily in the refining, petrochemical, natural gas gathering, storage and transmission, and general industrial markets. Brand names for our products include Hi-Flo™, Valvealert™, Triple Circle™, CPI Special Polymer Alloys™, Twin Ring™, Liard™, Pro Flo™, Safeguard®, Neomag™, CVP®, XDC®, POPR® and Proven Solutions for the Global Compression Industry™.
Customers
The Engineered Products segment sells its products to a diverse customer base worldwide, with approximately 73% of sales delivered to customers outside the United States in 2017. GGB has customers worldwide in all major industrial sectors, and supplies products directly to customers through GGB’s own local distribution system and indirectly to the market through independent agents and distributors with their own local networks. CPI sells its products and services globally through its internal sales force, independent sales representatives, distributors, and service centers. In 2017, the largest customer accounted for approximately 2% of segment revenues.
Raw Materials
GGB’s major raw material purchases include steel coil, bronze powder, bronze coil, PTFE and aluminum. GGB sources components from a number of external suppliers. CPI’s major raw material purchases include PTFE, polyetheretherketone (PEEK), compound additives, bronze, steel, and stainless steel bar stock. We believe all of these raw materials and components are readily available from various suppliers, though there are limited suppliers for certain other minor, but critical, raw materials.
Power Systems Segment
Our Power Systems segment is composed of our Fairbanks Morse business, which designs, manufactures, sells and services heavy-duty, medium-speed diesel, natural gas and dual fuel reciprocating engines. We market these products and services under the Fairbanks Morse® brand name. Products in this segment include licensed heavy-duty, medium-speed diesel, natural gas and dual fuel reciprocating engines, in addition to our own designs. The reciprocating engines range in size from 700 to 31,970 horsepower and from five to 20 cylinders. These products are used in marine, oil and gas, and power generation markets. We have been building engines for over 115 years under the Fairbanks Morse® brand name and we have a large installed base of engines for which we supply aftermarket parts and service. Fairbanks Morse has been a key supplier to the U.S. Navy for medium-speed diesel engines and has supplied engines to the U.S. Navy for over 70 years.
Customers
Our Power Systems segment sells its products and services to customers worldwide, including major shipyards, municipal utilities, institutional and industrial organizations, sewage treatment plants, nuclear power
4
plants and offshore oil and gas platforms, with approximately 21% of sales delivered to customers outside the United States in 2017. We market our products through a direct sales force of engineers in North America and through independent agents worldwide. Our representative customers include Northrop Grumman, General Dynamics, Lockheed Martin, the U.S. Navy, the U.S. Coast Guard, Electricite de France, Areva, Abbvie, and Exelon. In 2017, the largest customer accounted for approximately 13% of segment revenues.
Raw Materials and Components
Our Power Systems segment purchases multiple ferrous and non-ferrous castings, forgings, plate stock and bar stock for fabrication and machining into engines. In addition, we buy a considerable amount of precision-machined engine components. We believe all of these raw materials and components are readily available from various suppliers, but may be subject to long and variable lead times.
Competition
We compete with a number of competitors in each of our segments. Although it varies by products, competition is based primarily on performance of the product for specific applications, product reliability, availability and price. Our leading brand names, including Garlock® and STEMCO®, have been built upon long-standing reputations for reliability and durability. In addition, we believe the breadth, performance and quality of our product offerings allow us to achieve premium pricing and have made us a preferred supplier among our agents and distributors in many of our businesses. Key competitors for the Sealing Products segment include A.W. Chesterton Company, Klinger Group, Teadit, Lamons, SIEM/Flexitallic, SKF USA Inc. and Federal-Mogul Corporation. Key competitors for the Engineered Products segment include Kolbenschmidt Pierburg AG, Federal-Mogul Corporation, Saint-Gobain’s Norglide division, Cook Compression and Hoerbiger Corporation. Key competitors for the Power Systems segment include MTU, Caterpillar Inc. and Wartsila Corporation.
Competitive Strengths
We believe the following strengths provide us with significant competitive advantages as we execute our business strategy:
Our Brands Set Industry Standards and Drive a Portfolio of Highly Repeatable, Stable Businesses
Our leading brands, including Garlock®, STEMCO®, GGB® and Fairbanks Morse®, have legacies ranging from 60 to over 125 years. We believe that the products sold under these leading brands are well established and highly recognized in their respective markets, and, in our flagship product lines, we hold leading market positions. In many cases, we expect our products are the products of choice for our customers given our long-standing histories of reliable performance in demanding and critical applications. We believe many of our products set industry standards around safety, emissions control, reliability, and performance. And we were among the first to market with a number of products, including opposed piston engines, non-asbestos sealing products, high-performance PTFE gaskets, metal-polymer bearings, and zero-PFOA (perfluorooctanoic acid) bearings. A meaningful percentage of our sales is generated by products that are either sole-sourced or customer-specified. The focus of our brand and business model has been, and continues to be, developing premium quality products that meet demanding performance standards, providing customers with focused service and support, and developing and nurturing enduring customer relationships.
Many of Our Products Perform in Demanding Environments and Serve Critical Applications
Many of our products support critical applications in demanding environments such as those characterized by high pressure, high temperature, chemical corrosion and requirement for zero failure. Notable examples include sealing products for nuclear reactor pressure vessels; seals, bearings and related products for
5
aircraft engines and landing gear; seals and related products used in the pharmaceutical industry; wheel-end and brake products for Class 8 trucks; and engines that provide propulsion or auxiliary power for U.S. Navy vessels. We believe many of our products’ long-standing histories of performance reliability in demanding environments and for critical applications provide significant commercial advantages, leading to value-based pricing opportunities that drive premium margins and capital returns. In addition, some applications in which our products serve are characterized by high customer switching costs, due to both the critical nature of the application and the specification process.
Our Highly Diversified Business Portfolio Leads to Stable Cash Flows
Our sales are generated across a broad range of industries and geographies. We serve more than 30 end markets, and approximately 43% of our 2017 net sales were from sales to customers outside of the United States. A slowdown in a specific industry or economy can be offset by an uptick in other markets, providing confidence in our ability to sustain profitability and stable cash flows over time. We also have a strong mix of aftermarket and OEM customers, with a roughly even split between these types of customers. Much of our OEM business is platform-based and sole-sourced, resulting in very low product displacement. Additionally, our large installed base of products generates a steady recurring aftermarket revenue stream.
We Have Positioned Our Company for Growth and Continuous Improvement
Since our spin-off from Goodrich Corporation (“Goodrich”) in 2002, we have systematically refined our business mix and model, and we are well positioned for future growth and continuous operational improvement. Initiatives undertaken include the following:
| • | We have streamlined our mix of businesses, divesting a large division (Quincy Compressor) and several small, non-strategic business units. We have reinvested fully the proceeds of those divestitures into businesses that fit strategically with our operating divisions and that provide new products, new technologies and new or expanded geographic reach. In the process, we have refined our acquisition processes and developed a formal playbook for a business-unit focused, strategy-driven approach to managing our portfolio. We have expanded globally through both acquisitions and organic initiatives, particularly in Asia, South America and the Middle East. |
| • | We have enhanced our innovation focus and processes, with approximately $33 million in R&D spending during 2017 and a growing pipeline of new products to seed future growth. |
| • | We have developed a comprehensive supply chain management process and currently have 40 category teams managing 85% of our total spending, targeting annual savings of 3% through the business cycle. |
| • | We have developed a world-class safety program and culture and are the only public company to be recognized on three separate occasions by EHS Today as America’s Safest Company. |
| • | We have invested heavily in our infrastructure with major facility upgrades and ERP implementations in all of our operating divisions. And we have developed an EnPro global manufacturing and commercial business model through cross-division collaboration and external benchmarking. |
| • | In 2016, we initiated and completed a comprehensive restructuring program to reduce costs and exit low performing business units and locations, thus establishing a stronger foundation for future growth as industrial markets recover. |
6
The EnPro Senior Executive Team is Composed of Members with Diverse Educational and Functional Backgrounds and Demonstrated Track Records of Success
Our executive management team is led by Steve Macadam, President and Chief Executive Officer, who has served in this capacity for the past ten years. Prior to joining EnPro, Mr. Macadam was CEO of two other industrial companies and a senior operating executive at a third manufacturer, all following an earlier career as Principal with McKinsey & Company. Others on the EnPro senior team bring a diverse mix of educational and functional backgrounds and demonstrated records of success at both EnPro and in their roles prior to joining EnPro. The varied backgrounds include experience with other industrial businesses and with professional consulting and accounting firms such as McKinsey and Ernst & Young. Marvin Riley, Executive Vice President and Chief Operation Officer, previously served as President of Fairbanks Morse (the Power Systems segment) and held a senior manufacturing position prior to that. Susan Sweeney, President of GGB, and Deepak Navnith, President of Fairbanks Morse, similarly held senior manufacturing positions prior to their current roles. Eric Vaillancourt, President of Stemco, Bill Favenesi, President of CPI, Gilles Hudon, President of Technetics and Mike Faulkner, President of Garlock all have strong commercial backgrounds.
Business Strategy
We seek to take advantage of our competitive strengths to execute our growth and cost reduction strategies and, as a result, to maximize our free cash flow. Examples include:
Capitalize on Secular Growth Trends in Core Lines of Business
We serve a diverse group of markets and geographies and seek to invest in, and capture the benefits of, positive secular trends.
In our Sealing Products segment, our Garlock business has benefitted from recent growth in the hydrocarbon processing, metals and mining and general industrial markets, and we expect these core markets to continue to experience favorable conditions in the near to mid-term. In addition, our Garlock business is expanding its presence in less cyclical and higher growth end markets such as food and pharmaceutical. At Technetics Group, we have been benefitting from strength in the semiconductor and aerospace markets. We are also investing in innovation and new product development and expect those investments to enhance our financial performance and competitive position. In response to significant declines and structural changes in the industrial gas turbine market, we are exiting that market to focus on our core strengths in high performance sealing and highly engineered components for the aerospace and semiconductor markets. In our Stemco business, which serves the heavy-duty trucking industry, we are benefitting from robust new truck and trailer builds, a strong aftermarket presence and from increasing penetration of the suspension segment of the market. Stemco is also capitalizing on its products that enhance highway safety and on regulatory trends addressing stopping distance, brake quality and fuel efficiency.
In our Engineered Products segment, our GGB business has benefitted recently from growth in the general industrial market and continued strength in the automotive markets, particularly in Europe where we have a strong automotive presence. GGB will continue to pursue incremental growth through efforts to convert legacy roller bearing applications in the U.S. to high performing and less costly plain bearings. We also seek to gain share in China as premium quality auto production develops to serve a rising middle class. At CPI, we have benefitted from the recovery in the oil and gas markets and favorable conditions in the petrochemical industry. We also recently introduced a new compressor lubrication monitoring product line that has received positive feedback from customers.
In our Power Systems segment, Fairbanks Morse is a significant supplier to the U.S. Navy and has a leading market share in the U.S. nuclear market. Future growth is anticipated to come primarily from U.S. Navy
7
ship building and fleet refurbishment and from initiatives underway to expand in commercial markets. Currently, we are developing a next generation opposed piston engine (Trident OP™) that, if successful, will provide increased opportunities in commercial power generation markets. In addition, Fairbanks Morse has an agreement with MAN Diesel that provides Fairbanks Morse with additional products for sale to the U.S. power generation market.
Drive Growth through Product Innovation
We seek to drive growth by enhancing our product and technology offerings. Within our Sealing Products segment, we are expanding the Garlock family of products to meet the needs of the food and pharmaceutical markets. We are also making distinctive improvements in several of our core product lines to maintain our competitive advantage in product performance. Recent examples include the new Evolution and Epix product lines. At Stemco, we have an established track record of new product development and a number of product innovation initiatives underway in our wheel-end, brake and suspension components groups. At Technetics, we are expanding our product offerings for the aerospace, semiconductor and nuclear markets through close customer collaboration and active partnerships with companies like Airbus, Applied Materials, and the French nuclear agency (CEA). In our Power Systems segment, we are working to commercialize our internally developed, next generation opposed piston engine, the Trident OP™. We plan to continue the development of proprietary products as a means to differentiate ourselves from our competitors and grow our business. These efforts are supported by an enterprise-wide focus on innovation led by one of our division presidents.
Capture Growth via Geographic Expansion
While our primary markets are the developed economies of North America and Europe, we have expanded selectively in Eastern Europe, Asia, South America, the Middle East and Africa since the 2002 spin-off from Goodrich. All of our operating divisions other than Fairbanks Morse and CPI have a presence in Asia where our focus, with the exception of Stemco, is serving the local market. In the case of Stemco, we operate two facilities in China that produce wheel-end bearings and air disc brake friction for export to the U.S. We will continue to expand geographically in areas, and with customers, that value our high-performance products and service capabilities.
Supplement Organic Growth with Strategic Acquisitions
In addition to new product development and geographic expansion, acquisitions provide a means for expanding our addressable market through adding new products and technologies and helping us enter new markets. We maintain a disciplined and conservative acquisition approach that is grounded in business strategy and that incorporates all aspects of the acquisition process, including target identification, valuation and negotiation, due diligence, integration and post-closing business planning and execution. Our acquisition focus has led to a ten-fold increase in Stemco’s addressable market over the past seven years, establishment of the Technetics Group to focus on high-performance sealing and related products, and expansion of Garlock’s pipeline products and hygienic technologies businesses. At Stemco, we have significant room to capture share in our expanded addressable market based on brand strength, channel strategy and sales excellence. Since the spinoff from Goodrich in 2002, we have invested approximately $768 million in acquisitions at an average price to EBITDA multiple of 7.3x before consideration of synergies.
Ongoing Focus on Cost Containment and Continuous Improvement
We continue to seek opportunities to lower manufacturing costs by optimizing our production footprint, implementing new manufacturing practices and processes and investing in capital equipment to increase manufacturing efficiencies and improve product quality. We will continue to manage our total supply spend through the work of our 40 category teams with the goal of realizing annual savings of 3% through the business cycle. In addition, we expect to continue to realize additional benefits from the investments made in new ERP systems over the past five years.
8
Use of Proceeds
We intend to use the net proceeds from this offering, together with borrowings under our Revolving Credit Facility, to fund the redemption of our $450 million aggregate principal amount 5.875% senior notes due 2022 (the “Outstanding Notes”).
Corporate Information
We were incorporated under the laws of the State of North Carolina on January 11, 2002, as a wholly owned subsidiary of Goodrich Corporation. The incorporation was in anticipation of Goodrich’s announced distribution of its Engineered Industrial Products segment to existing Goodrich shareholders. The distribution took place on May 31, 2002. Our principal executive offices are located at 5605 Carnegie Boulevard, Suite 500, Charlotte, North Carolina 28209 and our telephone number is (704) 731-1500. Our common stock is listed on the New York Stock Exchange under the symbol “NPO.” We maintain an Internet website at www.enproindustries.com; however, the information on our website is not part of this offering memorandum, and you should rely only on the information contained in this offering memorandum and in the documents incorporated by reference into this offering memorandum when making a decision whether to invest in the notes.
9
Summary Historical Consolidated Financial Information and Other Data
The following table summarizes historical consolidated financial information and other data. The consolidated balance sheet data as of December 31, 2017 and 2016 have been derived from our audited consolidated financial statements and related notes in our Annual Report on Form 10-K for the year ended December 31, 2017 which is incorporated by reference in this offering memorandum. The consolidated statement of income data for the years ended December 31, 2017 and 2016 have been derived from our unaudited consolidated financial statements and related notes for those years (which are unaudited as they have been revised from previously issued audited financials to reflect the adoption of the new accounting standard as detailed below and further described in Note 1 to our unaudited condensed consolidated financial statements as of and for the three and six months ended June 30, 2018 included in our Quarterly Report on Form 10-Q for the period ended June 30, 2018, which is incorporated by reference herein. The following summary historical consolidated financial information and other data as of December 31, 2015 have been derived from our unaudited consolidated financial statements (which are unaudited as they have been revised from previously issued audited financial statements to reflect the adoption of the new accounting standard as detailed below) which are not included or incorporated by reference in this offering memorandum. The following summary historical consolidated financial information and other data for the six months ended June 30, 2018 and 2017 and as of June 30, 2018 have been derived from and should be read together with the unaudited consolidated financial statements and related notes included in our Quarterly Report on Form 10-Q for the period ended June 30, 2018 which is incorporated by reference into this offering memorandum. The following summary historical consolidated financial information and other data as of June 30, 2017 have been derived from our unaudited consolidated financial statements as of June 30, 2017 which are not included or incorporated by reference in this offering memorandum. The following summary historical consolidated financial information and other data presented for the twelve months ended June 30, 2018 have been derived by taking the amounts from the historical audited consolidated financial statements for the year ended December 31, 2017, less the amounts from the historical unaudited consolidated financial statements for the six months ended June 30, 2017, plus the amounts from the historical unaudited consolidated financial statements for the six months ended June 30, 2018. The unaudited consolidated financial statements have been prepared on a basis consistent with our audited consolidated financial statements and, in the opinion of our management, include all adjustments, consisting only of normal, recurring adjustments, necessary for the fair presentation of the information set forth therein.
In the first quarter of 2018, we adopted an accounting standard that requires an employer to report the service cost component of pension and other postretirement benefits expense in the same line item or items as other compensation costs arising from services rendered by the pertinent employees during the period. The other components of net benefit cost are required to be presented in the statement of operations separately from the service cost component and outside a subtotal of income from operations. For periods ending prior to March 31, 2018, we have recast our Statement of Operations Data presented below to reflect the retrospective application of this guidance, which resulted in a decrease in operating expenses of approximately $1.0 million, $2.2 million and $0.5 million, respectively, for the years ended December 31, 2015, 2016 and 2017 and $0.5 million for the six months ended June 30, 2017, with a corresponding increase in each respective period in other (non-operating) expense.
Our summary historical consolidated financial information and other data are not necessarily indicative of our future performance. The financial information and data provided in this table are only summary, do not provide all of the information or data contained in our financial statements, and should also be read in conjunction with the sections of this offering memorandum entitled “Use of Proceeds” and “Capitalization” and with Item 7, “Management’s Discussion and Analysis of Financial Condition and Results of Operations” included in our Annual Report on Form 10-K for the year ended December 31, 2017 and Part I, Item 2, “Management’s Discussion and Analysis of Financial Condition and Results of Operations” included in our Quarterly Report on Form 10-Q for the period ended June 30, 2018.
10
| Year Ended December 31, |
Six Months Ended June 30, (unaudited) |
Twelve Months June 30, |
||||||||||||||||||||||
| 2015(1) |
2016(2) |
2017(3) |
2017(3) |
2018 |
2018 |
|||||||||||||||||||
| (dollars in millions) | ||||||||||||||||||||||||
| Statement of Operations Data: |
||||||||||||||||||||||||
| Net Sales |
$ | 1,204.4 | $ | 1,187.7 | $ | 1,309.6 | $ | 603.4 | $ | 762.4 | $ | 1,468.6 | ||||||||||||
| Cost of sales |
808.4 | 791.9 | 865.3 | 397.1 | 521.5 | 989.7 | ||||||||||||||||||
|
|
|
|
|
|
|
|
|
|
|
|
|
|||||||||||||
| Gross profit |
396.0 | 395.8 | 444.3 | 206.3 | 240.9 | 478.9 | ||||||||||||||||||
|
|
|
|
|
|
|
|
|
|
|
|
|
|||||||||||||
| Operating expenses: |
||||||||||||||||||||||||
| Selling, general and administrative |
302.3 | 302.7 | 325.7 | 146.7 | 181.5 | 360.5 | ||||||||||||||||||
| Goodwill and other intangible asset impairment |
47.0 | — | 10.1 | — | — | 10.1 | ||||||||||||||||||
| Asbestos settlement |
— | 80.0 | — | — | — | — | ||||||||||||||||||
| Other |
8.1 | 15.6 | 6.8 | 4.4 | 5.3 | 7.7 | ||||||||||||||||||
|
|
|
|
|
|
|
|
|
|
|
|
|
|||||||||||||
| Total operating expenses |
357.4 | 398.3 | 342.6 | 151.1 | 186.8 | 378.3 | ||||||||||||||||||
|
|
|
|
|
|
|
|
|
|
|
|
|
|||||||||||||
| Operating income (loss) |
38.6 | (2.5 | ) | 101.7 | 55.2 | 54.1 | 100.6 | |||||||||||||||||
| Interest expense |
(52.8 | ) | (55.9 | ) | (50.9 | ) | (31.0 | ) | (15.5 | ) | (35.4 | ) | ||||||||||||
| Interest income |
0.7 | 0.8 | 1.5 | 0.1 | 0.6 | 2.0 | ||||||||||||||||||
| Gain on reconsolidation of GST and OldCo |
— | — | 534.4 | — | — | 534.4 | ||||||||||||||||||
| Other income (expense), net |
(5.1 | ) | (11.1 | ) | (9.2 | ) | (3.7 | ) | (0.6 | ) | (6.1 | ) | ||||||||||||
|
|
|
|
|
|
|
|
|
|
|
|
|
|||||||||||||
| Income (loss) before income taxes |
(18.6 | ) | (68.7 | ) | 577.5 | 20.6 | 38.6 | 595.5 | ||||||||||||||||
| Income tax benefit (expense) |
(2.3 | ) | 28.6 | (37.7 | ) | (5.2 | ) | (16.1 | ) | (48.6 | ) | |||||||||||||
|
|
|
|
|
|
|
|
|
|
|
|
|
|||||||||||||
| Net income(loss) |
$ | (20.9 | ) | $ | (40.1 | ) | $ | 539.8 | $ | 15.4 | $ | 22.4 | $ | 546.8 | ||||||||||
|
|
|
|
|
|
|
|
|
|
|
|
|
|||||||||||||
| Balance Sheet Data: |
||||||||||||||||||||||||
| Cash and cash equivalents |
$ | 103.4 | $ | 111.5 | $ | 189.3 | $ | 132.1 | $ | 93.4 | $ | 93.4 | ||||||||||||
| Total current assets |
$ | 517.9 | $ | 524.9 | $ | 819.6 | $ | 589.8 | $ | 678.4 | $ | 678.4 | ||||||||||||
| Property, plant and equipment, net |
$ | 211.5 | $ | 215.4 | $ | 296.9 | $ | 219.0 | $ | 293.5 | $ | 293.5 | ||||||||||||
| Total assets |
$ | 1,498.8 | $ | 1,546.4 | $ | 1,886.1 | $ | 1,600.1 | $ | 1,719.2 | $ | 1,719.2 | ||||||||||||
| Total current liabilities |
$ | 278.7 | $ | 303.0 | $ | 268.1 | $ | 644.1 | $ | 256.8 | $ | 256.8 | ||||||||||||
| Long-term debt (including current portion) |
$ | 356.3 | $ | 425.0 | $ | 618.5 | $ | 492.6 | $ | 488.0 | $ | 488.0 | ||||||||||||
| Notes payable to GST (including current portion) |
$ | 283.2 | $ | 295.9 | $ | — | $ | 309.3 | $ | — | $ | — | ||||||||||||
| Total shareholders’ equity |
$ | 459.8 | $ | 358.5 | $ | 902.8 | $ | 373.4 | $ | 864.7 | $ | 864.7 | ||||||||||||
| Other Financial Data: |
||||||||||||||||||||||||
| EBITDA, net of reconsolidation gain(4) |
$ | 91.6 | $ | 43.5 | $ | 156.3 | $ | 79.5 | $ | 90.2 | $ | 167.0 | ||||||||||||
| Adjusted EBITDA(4) |
$ | 156.4 | $ | 150.0 | $ | 187.7 | $ | 87.9 | $ | 99.7 | $ | 199.5 | ||||||||||||
| Net cash provided by operating activities |
$ | 86.5 | $ | 64.5 | $ | 46.6 | $ | 28.0 | $ | 109.6 | $ | 128.2 | ||||||||||||
| Net cash used in investing activities |
$ | (86.5 | ) | $ | (61.4 | ) | $ | (97.7 | ) | $ | (61.3 | ) | $ | (3.8 | ) | $ | (40.2 | ) | ||||||
| Net cash provided by (used in) financing activities |
$ | (85.2 | ) | $ | 22.0 | $ | 118.5 | $ | 49.3 | $ | (197.5 | ) | $ | (128.3 | ) | |||||||||
| Capital expenditures |
$ | 41.4 | $ | 39.9 | $ | 44.7 | $ | 17.1 | $ | 30.1 | $ | 57.7 | ||||||||||||
| Segment Data: |
||||||||||||||||||||||||
| Sales |
||||||||||||||||||||||||
| Sealing Products |
$ | 705.6 | $ | 705.6 | $ | 804.3 | $ | 370.6 | $ | 487.6 | $ | 921.3 | ||||||||||||
| Engineered Products |
297.8 | 277.1 | 301.1 | 150.8 | 171.3 | 321.6 | ||||||||||||||||||
| Power Systems |
204.6 | 208.3 | 208.2 | 84.0 | 105.8 | 230.0 | ||||||||||||||||||
| Segment Profit |
||||||||||||||||||||||||
| Sealing Products |
84.3 | 81.8 | 90.9 | 41.6 | 43.0 | 92.3 | ||||||||||||||||||
| Engineered Products |
6.4 | 12.4 | 29.8 | 17.8 | 26.5 | 38.5 | ||||||||||||||||||
| Power Systems |
27.1 | 17.0 | 29.0 | 12.6 | 3.8 | 20.2 | ||||||||||||||||||
| Segment Adjusted EBITDA(4) |
||||||||||||||||||||||||
| Sealing Products |
122.8 | 121.2 | 141.6 | 61.9 | 75.3 | 155.0 | ||||||||||||||||||
| Engineered Products |
32.0 | 36.8 | 48.2 | 27.4 | 34.9 | 55.7 | ||||||||||||||||||
| Power Systems |
31.2 | 21.8 | 34.2 | 14.8 | 6.6 | 26.0 | ||||||||||||||||||
11
| (1) | In July 2015, we purchased the Veyance North American air spring business (the “Air Spring Business”) through the purchase of 100% of the stock of Veyance’s Mexico business and of all of the assets of its U.S. business. The Air Spring Business is a manufacturer of air springs that are used in the suspension systems of commercial vehicles. Following the acquisition, it became part of our Stemco division within the Sealing Products segment. The Air Spring Business manufactures products in its facility in San Luis Potosi, Mexico with a commercial organization in the U.S., Canada and Mexico, and engineering, testing and administrative resources in Fairlawn, Ohio. The addition of the Air Spring Business significantly expands Stemco’s presence and scale in the commercial vehicle suspension market. In the second quarter of 2016, we finalized and agreed upon the acquisition date balance sheet of the Air Spring Business with the seller and made an additional cash payment of $5.9 million for the agreed-upon acquisition date working capital balance. In February 2015, we acquired 100% of the stock of ATDynamics, Inc. (“ATDynamics”), a privately-held company offering innovative aerodynamic products to the commercial trucking industry. ATDynamics is managed as part of our Stemco division within the Sealing Products segment. ATDynamics, with operations in Texas, is a leading designer and manufacturer of a suite of aerodynamic products engineered to reduce fuel consumption in the global freight transportation industry. We paid $45.5 million, net of cash acquired, in 2015 for the businesses acquired during that year. |
| (2) | On April 29, 2016, we acquired certain assets and assumed certain liabilities of Rubber Fab Gasket & Molding, Inc. (“Rubber Fab”), a privately-held company offering a full range of high performance sanitary gaskets, hoses and fittings for the hygienic process industries. Rubber Fab is managed as part of EnPro’s Garlock division within the Sealing Products segment. We paid $22.6 million, net of cash acquired, for the acquisition of Rubber Fab. |
| (3) | In October 2017, we acquired 100% of the stock of Commercial Vehicle Components Co., Ltd. (“CVC”), a manufacturer of air disc brake and medium duty hydraulic disc brake pads for the heavy-duty and medium-duty commercial vehicle aftermarket. CVC is managed as part of our Stemco division within the Sealing Products segment. In June 2017, we acquired certain assets and assumed certain liabilities of Qualiseal Technology (“Qualiseal”), a privately-held company offering custom-engineered mechanical face and circumferential seals for demanding aerospace and industrial applications. Qualiseal is managed as part of our Technetics division within the Sealing Products segment. We paid $44.6 million, net of cash acquired, in 2017 for businesses acquired during the year. |
| As discussed above in “Basis of Financial Information,” our formerly deconsolidated subsidiaries, GST and OldCo, were reconsolidated effective July 31, 2017 (the “Reconsolidation Date”) upon the consummation of the Joint Plan. The reconsolidation of GST and OldCo on the Reconsolidation Date was accounted for as a business acquisition. In accordance with GAAP, the purchase price for the acquisition was equal to the fair value of our investment in GST and OldCo on the Reconsolidation Date. In the reconsolidation, the investment in GST and OldCo is deemed to be exchanged for our exclusive control of these businesses. No cash is transferred in the reconsolidation transaction, other than the reconsolidation of GST’s and OldCo’s cash and cash equivalents at that date. For further information, see Note 2, “Garlock Sealing Technologies LLC, Garrison Litigation Management Group, Ltd., and OldCo, LLC” to the audited consolidated financial statements included in our Annual Report on Form 10-K for the year ended December 31, 2017 which is incorporated by reference into this offering memorandum. |
| (4) | We define “EBITDA” for the periods presented above as net income before interest expense (net of interest income), income tax expense, and depreciation and amortization expense and “EBITDA, net of reconsolidation gain” as net income before interest expense (net of interest income), income tax expense, depreciation and amortization expense, and gain on reconsolidation of GST and OldCo. EBITDA and EBITDA, net of reconsolidation gain do not represent, and should not be considered as, alternatives to net income or cash flows from operating activities, each as determined in accordance with GAAP. We define “Adjusted EBITDA” for the periods presented above as net income before interest expense (net of interest income), income tax expense, depreciation and amortization expense, gain on reconsolidation of GST and OldCo, asbestos settlement, goodwill and other intangible asset impairment, restructuring costs, loss on exchange and repurchase of convertible debentures, acquisition expenses, fair value adjustment to acquisition date inventory, environmental reserve adjustment and other costs associated with previously disposed businesses, and other selected items. We define Segment Adjusted EBITDA as segment profit before depreciation and amortization expense, restructuring costs, acquisition expenses and fair value adjustment to acquisition date inventory. We have presented EBITDA, EBITDA, net of reconsolidation gain, Adjusted EBITDA and Segment Adjusted EBITDA in this offering memorandum because we believe they are useful financial measurements for assessing operating performance as they provide investors with additional bases to evaluate our performance. In addition, we use these metrics to further our |
12
| understanding of our historical and prospective consolidated operating performance and, with respect to Segment Adjusted EBITDA, the operating performance of our segments before expenses incurred by our corporate activities. In addition, we use Adjusted EBITDA and Segment Adjusted EBITDA to evaluate the ordinary course of our operations, before certain selected items, even though those items may be recurring, because we believe to effectively compare our core operating performance from period to period on a historical and prospective basis, these metrics should exclude items relating to restructuring costs and acquisition costs, and Adjusted EBITDA should also exclude gain on reconsolidation of GST and OldCo, asbestos settlement, goodwill and other intangible asset impairment, loss on exchange and repurchase of convertible debentures, fair value adjustment to acquisition date inventory, environmental reserve adjustment and other costs associated with previously disposed businesses, and other selected items, incurred outside the ordinary course of our operations. Other companies may calculate EBITDA, EBITDA, net of reconsolidation gain, Adjusted EBITDA and Segment Adjusted EBITDA differently than we do. EBITDA, EBITDA, net of reconsolidation gain, Adjusted EBITDA and Segment Adjusted EBITDA are not measures of performance under GAAP and should not be considered as a substitute for our net income, or the segment profit of our reporting segments, respectively, prepared in accordance with GAAP. Each of EBITDA, EBITDA, net of reconsolidation gain, Adjusted EBITDA and Segment Adjusted EBITDA has limitations as an analytical tool, and you should not consider it in isolation or as a substitute for analysis of our results as reported under GAAP. Some of these limitations are: EBITDA, EBITDA, net of reconsolidation gain, Adjusted EBITDA and Segment Adjusted EBITDA do not reflect our cash expenditures, or future requirements, for capital expenditures or contractual commitments; EBITDA, EBITDA, net or reconsolidation gain, Adjusted EBITDA and Segment Adjusted EBITDA do not reflect interest expense or the cash requirements necessary to service interest or principal payments on our debt; EBITDA, EBITDA, net of reconsolidation gain, Adjusted EBITDA and Segment Adjusted EBITDA do not reflect income tax expense or the cash requirements necessary to pay for income tax obligations; and although depreciation and amortization are non-cash charges, the assets being depreciated and amortized will often have to be replaced in the future, and EBITDA, EBITDA, net of reconsolidation gain, Adjusted EBITDA and Segment Adjusted EBITDA do not reflect any cash requirements for such replacements. In addition, in evaluating EBITDA, net of reconsolidation gain, Adjusted EBITDA and Segment Adjusted EBITDA you should be aware that in the future we may incur expenses that are the same as or similar to some of the adjustments in this presentation. Our presentation of EBITDA, net of reconsolidation gain, Adjusted EBITDA and Segment Adjusted EBITDA should not be construed as an inference that our future results will not be unaffected by unusual or non-recurring items. |
The following table sets forth the reconciliation of net income to EBITDA, EBITDA, net of reconsolidation gain and Adjusted EBITDA for the periods indicated:
|
Year Ended December 31, |
Six Months Ended June 30, (unaudited) |
Twelve June 30, (unaudited) |
||||||||||||||||||||||
| 2015 |
2016 |
2017 |
2017 |
2018 |
2018 |
|||||||||||||||||||
| (in millions) | ||||||||||||||||||||||||
| Net income (loss) |
$ | (20.9 | ) | $ | (40.1 | ) | $ | 539.8 | $ | 15.4 | $ | 22.5 | $ | 546.9 | ||||||||||
| Interest expense, net |
52.1 | 55.1 | 49.4 | 30.9 | 14.9 | 33.4 | ||||||||||||||||||
| Income tax expense (benefit) |
2.3 | (28.6 | ) | 37.7 | 5.2 | 16.1 | 48.6 | |||||||||||||||||
| Depreciation and amortization expense |
58.1 | 57.1 | 63.8 | 28.0 | 36.7 | 72.5 | ||||||||||||||||||
|
|
|
|
|
|
|
|
|
|
|
|
|
|||||||||||||
| EBITDA |
91.6 | 43.5 | 690.7 | 79.5 | 90.2 | 701.4 | ||||||||||||||||||
| Gain on reconsolidation of GST and OldCo |
— | — | (534.4 | ) | — | — | (534.4 | ) | ||||||||||||||||
|
|
|
|
|
|
|
|
|
|
|
|
|
|||||||||||||
| EBITDA, net of reconsolidation gain |
91.6 | 43.5 | 156.3 | 79.5 | 90.2 | 167.0 | ||||||||||||||||||
| Asbestos settlement |
— | 80.0 | — | — | — | — | ||||||||||||||||||
| Goodwill and other intangible asset impairment |
47.0 | — | 10.1 | — | — | 10.1 | ||||||||||||||||||
| Restructuring costs |
6.6 | 13.4 | 5.1 | 3.4 | 6.8 | 8.5 | ||||||||||||||||||
| Loss on exchange and repurchase of convertible debentures |
2.8 | — | — | — | — | — | ||||||||||||||||||
| Acquisition expenses |
2.6 | 1.0 | 0.8 | 0.6 | 0.1 | 0.3 | ||||||||||||||||||
| Fair value adjustment to acquisition date inventory |
1.3 | 0.1 | 4.7 | — | — | 4.7 | ||||||||||||||||||
| Environmental reserve adjustment and other costs associated with previously disposed businesses(a) |
1.4 | 8.6 | 8.7 | 3.3 | 1.7 | 7.1 | ||||||||||||||||||
| Other(b) |
3.1 | 3.4 | 2.0 | 1.1 | 0.9 | 1.8 | ||||||||||||||||||
|
|
|
|
|
|
|
|
|
|
|
|
|
|||||||||||||
| Adjusted EBITDA |
$ | 156.4 | $ | 150.0 | $ | 187.7 | $ | 87.9 | $ | 99.7 | $ | 199.5 | ||||||||||||
|
|
|
|
|
|
|
|
|
|
|
|
|
|||||||||||||
13
| (a) | For periods other than the six months ended June 30, 2018, does not include other costs associated with previously disposed businesses, which costs were immaterial. |
| (b) | “Other” includes intercompany managements fees and legal fees related to the GST bankruptcy aggregating $3.0 million, $2.9 million and $2.0 million for the years ended December 31, 2015, 2016 and 2017, respectively, $1.1 million and $0.6 million for the six months ended June 30, 2017 and 2018, respectively, and $1.6 million for the twelve months ended June 30, 2018. It also includes losses on the sale of assets and businesses of $1.3 million and $0.7 million for the years ended December 31, 2015 and 2016, respectively, and $0.3 million for the six months ended June 30, 2018 and $0.3 million for the twelve months ended June 30, 2018. For the year ended December 31, 2015, it is reduced by a $1.4 million favorable adjustment for medical and workers’ compensation reserves associated with a previously disposed business. |
The following table sets forth the reconciliation of segment profit of each of our reporting segments to Segment EBITDA for the periods indicated:
|
Year Ended December 31, |
Six Months Ended June 30, (unaudited) |
Twelve June 30, |
||||||||||||||||||||||
| 2015 |
2016 |
2017 |
2017 |
2018 |
2018 |
|||||||||||||||||||
| (in millions) | ||||||||||||||||||||||||
| Sealing Products |
||||||||||||||||||||||||
| Segment profit |
$ | 84.3 | $ | 81.8 | $ | 90.9 | $ | 41.6 | $ | 43.0 | $ | 92.3 | ||||||||||||
| Depreciation and amortization expense |
34.3 | 35.1 | 41.8 | 17.5 | 26.1 | 50.4 | ||||||||||||||||||
| Restructuring costs |
0.4 | 3.3 | 3.6 | 2.2 | 6.2 | 7.6 | ||||||||||||||||||
| Acquisition expenses and fair value adjustment to acquisition date inventory |
3.8 | 1.0 | 5.3 | 0.6 | — | 4.7 | ||||||||||||||||||
|
|
|
|
|
|
|
|
|
|
|
|
|
|||||||||||||
| Segment Adjusted EBITDA |
$ | 122.8 | $ | 121.2 | $ | 141.6 | $ | 61.9 | $ | 75.3 | $ | 155.0 | ||||||||||||
|
|
|
|
|
|
|
|
|
|
|
|
|
|||||||||||||
| Engineered Products |
||||||||||||||||||||||||
| Segment profit |
$ | 6.4 | $ | 12.4 | $ | 29.8 | $ | 17.8 | $ | 26.5 | $ | 38.5 | ||||||||||||
| Depreciation and amortization expense |
19.4 | 17.5 | 16.8 | 8.3 | 8.0 | 16.5 | ||||||||||||||||||
| Restructuring costs |
6.2 | 6.8 | 1.5 | 1.2 | 0.4 | 0.7 | ||||||||||||||||||
| Acquisition expenses and fair value adjustment to acquisition date inventory |
— | 0.1 | 0.1 | 0.1 | — | — | ||||||||||||||||||
|
|
|
|
|
|
|
|
|
|
|
|
|
|||||||||||||
| Segment Adjusted EBITDA |
$ | 32.0 | $ | 36.8 | $ | 48.2 | $ | 27.4 | $ | 34.9 | $ | 55.7 | ||||||||||||
|
|
|
|
|
|
|
|
|
|
|
|
|
|||||||||||||
| Power Systems |
||||||||||||||||||||||||
| Segment profit |
$ | 27.1 | $ | 17.0 | $ | 29.0 | $ | 12.6 | $ | 3.8 | $ | 20.2 | ||||||||||||
| Depreciation and amortization expense |
4.1 | 4.4 | 5.2 | 2.2 | 2.6 | 5.6 | ||||||||||||||||||
| Restructuring costs |
— | 0.4 | — | — | 0.2 | 0.2 | ||||||||||||||||||
| Acquisition expenses and fair value adjustment to acquisition date inventory |
— | — | — | — | — | — | ||||||||||||||||||
|
|
|
|
|
|
|
|
|
|
|
|
|
|||||||||||||
| Segment Adjusted EBITDA |
$ | 31.2 | $ | 21.8 | $ | 34.2 | $ | 14.8 | $ | 6.6 | $ | 26.0 | ||||||||||||
|
|
|
|
|
|
|
|
|
|
|
|
|
|||||||||||||
14
CAPITALIZATION
The table below sets forth, as of June 30, 2018, (i) our actual historical cash and capitalization and (ii) our cash and capitalization as adjusted to give effect to the offering of the notes, the use of the proceeds therefrom, as well as borrowings under the Revolving Credit Facility and the use of proceeds therefrom to fund the remaining redemption price of the Outstanding Notes, as contemplated hereby, as if such events occurred on June 30, 2018. See “Use of Proceeds” for additional detail on the use of net proceeds from the issuance of the notes.
You should read this table along with our unaudited consolidated financial statements and related notes and other financial information included in our Quarterly Report on Form 10-Q for the period ended June 30, 2018 and our audited consolidated financial statements and related notes and other financial information included in our Annual Report on Form 10-K for year ended December 31, 2017, each of which is incorporated by reference into this offering memorandum.
| As of June 30, 2018 | ||||||||
| Actual | As Adjusted(1) |
|||||||
| (unaudited) | ||||||||
| (in millions) | ||||||||
| Cash and cash equivalents |
$ | 93.4 | $ | 93.4 | ||||
|
|
|
|
|
|||||
| Short-term debt: |
||||||||
| Current maturities of long-term debt |
$ | 0.2 | $ | 0.2 | ||||
| Long-term debt: |
||||||||
| Senior secured revolving credit facility |
$ | 42.5 | 164.0 | (2) | ||||
| Outstanding Notes |
450.0 | (3) | — | |||||
| Senior Notes due 2026 offered hereby |
— | 350.0 | ||||||
| Other long-term debt |
0.5 | 0.5 | ||||||
|
|
|
|
|
|||||
| Total debt |
493.2 | 514.7 | ||||||
| Total shareholders’ equity |
864.7 | 846.2 | (4) | |||||
|
|
|
|
|
|||||
| Total capitalization |
$ | 1,357.9 | $ | 1,360.9 | ||||
|
|
|
|
|
|||||
| (1) | The “As Adjusted” column gives effect to the offering of the notes to use the net proceeds from this offering, as well as borrowings under the Revolving Credit Facility and the use of proceeds therefrom to fund the remaining redemption price of the Outstanding Notes, as if such events occurred on June 30, 2018. See “Use of Proceeds” for additional detail on the use of net proceeds from the issuance of the notes. |
| (2) | As of June 30, 2018, after giving effect to this offering, the use of proceeds therefrom, as well as borrowings under the Revolving Credit Facility and the use of proceeds therefrom to fund the remaining redemption price of the Outstanding Notes, including estimated fees and expenses and accrued interest on the Outstanding Notes, all as described under the heading “Use of Proceeds,” an additional $169.9 million, representing the full amount of the Revolving Credit Facility, less $164.0 million in outstanding borrowings and $16.1 million reserved for outstanding letters of credit, would have been available for borrowing under the Revolving Credit Facility. For a description of the material terms of the Revolving Credit Facility, see “Description of Other Indebtedness—Revolving Credit Facility.” |
| (3) | Amount shown is equal to $444.8 million outstanding principal amount included in our unaudited consolidated financial statements included in our Quarterly Report on Form 10-Q for the period ended June 30, 2018 plus $5.0 million of unamortized debt issuance costs and $1.4 million of unamortized original issue discount, less $1.2 million of original issue premium. |
| (4) | The redemption premium on the Outstanding Notes of approximately $18.5 million and the unamortized debt issuance costs related to the Outstanding Notes of approximately $5.0 million would be charged to expense upon the redemption of the Outstanding Notes. |
15