Attached files
| file | filename |
|---|---|
| 8-K - FORM 8-K - American Finance Trust, Inc | tv503919_8-k.htm |
Exhibit 99.1
American Finance Trust (Nasdaq:AFIN) October 2018 ▪ Portfolio Update ▪ Discussion of October 10, 2018 Conversion of Class B - 1 Shares into Class A Shares
American Finance Trust, Inc. 2 American Finance Trust, Inc . (“AFIN”) announced on September 20 , 2018 that all issued and outstanding shares of its Class B - 1 common stock (“Class B - 1 Shares”) will automatically convert into shares of its Class A common stock (“Class A Shares”) on October 10 , 2018 (the “Conversion Date”) . AFIN’s Class A Shares trade on the Nasdaq under the ticker symbol AFIN . The Class B - 1 Shares represent approximately 25 % of AFIN’s total outstanding shares, with the remaining 25 % represented by shares of AFIN’s Class B - 2 common stock (“Class B - 2 Shares”) . The Class B - 2 Shares will automatically convert into Class A Shares no later than January 15 , 2019 . AFIN ANNOUNCES CONVERSION OF B - 1 SHARES INTO CLASS A TRADABLE SHARES Important Announcement
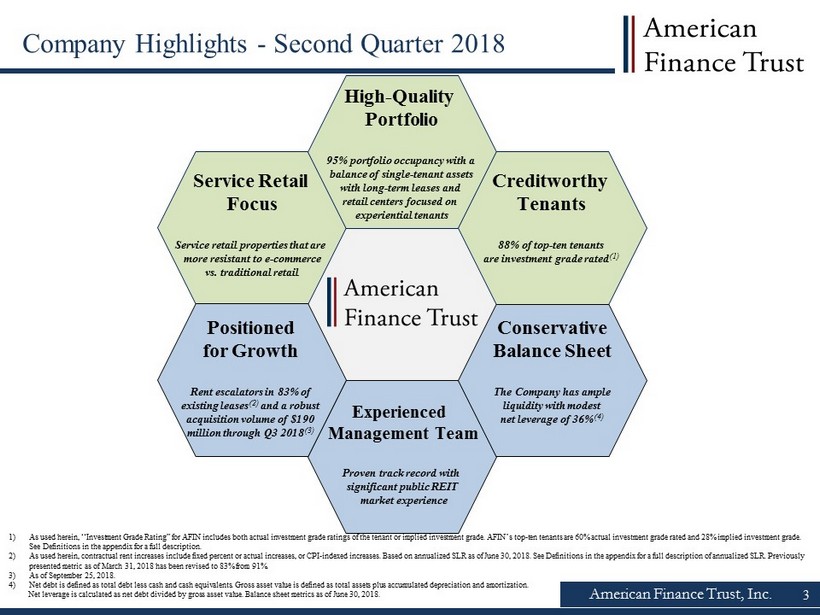
American Finance Trust, Inc. Company Highlights - Second Quarter 2018 Service Retail Focus Service retail properties that are more resistant to e - commerce vs. traditional retail High - Quality Portfolio 95% portfolio occupancy with a balance of single - tenant assets with long - term leases and retail centers focused on experiential tenants Creditworthy Tenants 88% of top - ten tenants are investment grade rated (1) Conservative Balance Sheet The Company has ample liquidity with modest net leverage of 36% (4) Positioned for Growth Rent escalators in 83% of existing leases (2) and a robust acquisition volume of $190 million through Q3 2018 (3) Experienced Management Team Proven track record with significant public REIT market experience 1) As used herein, “Investment Grade Rating” for AFIN includes both actual investment grade ratings of the tenant or implied inv est ment grade. AFIN’s top - ten tenants are 60% actual investment grade rated and 28% implied investment grade. See Definitions in the appendix for a full description. 2) As used herein, contractual rent increases include fixed percent or actual increases, or CPI - indexed increases. Based on annualized SLR as of June 30, 2018 . See Definitions in the appendix for a full description of annualized SLR. Previously presented metric as of March 31, 2018 has been revised to 83% from 91%. 3) As of September 25, 2018. 4) Net debt is defined as total debt less cash and cash equivalents. Gross asset value is defined as total assets plus accumulat ed depreciation and amortization. Net leverage is calculated as net debt divided by gross asset value. Balance sheet metrics as of June 30, 2018. 3
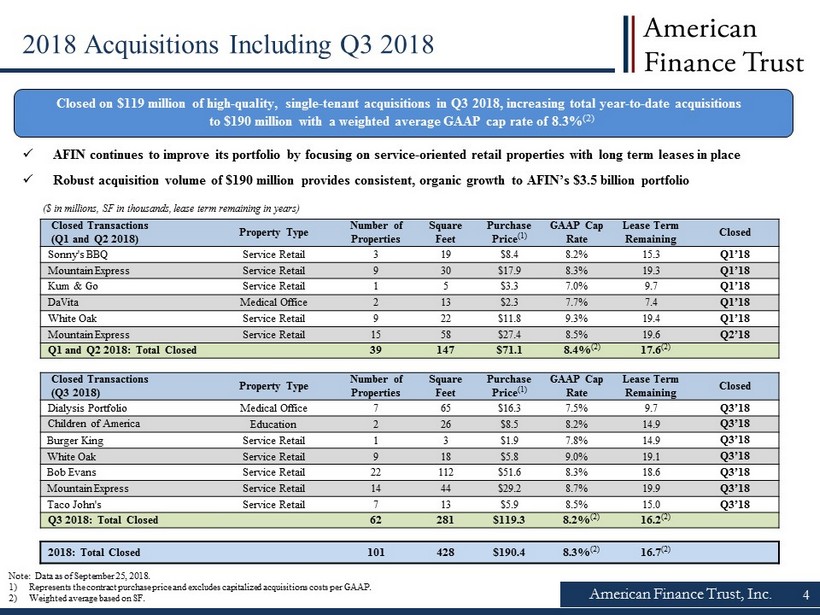
American Finance Trust, Inc. Closed on $119 million of high - quality, single - tenant acquisitions in Q3 2018, increasing total year - to - date acquisitions to $190 million with a weighted average GAAP cap rate of 8.3% (2) ($ in millions, SF in thousands, lease term remaining in years) Note: Data as of September 25, 2018. 1) Represents the contract purchase price and excludes capitalized acquisitions costs per GAAP. 2) Weighted average based on SF. Closed Transactions (Q1 and Q2 2018) Property Type Number of Properties Square Feet Purchase Price (1) GAAP Cap Rate Lease Term Remaining Closed Sonny's BBQ Service Retail 3 19 $8.4 8.2% 15.3 Q1’18 Mountain Express Service Retail 9 30 $17.9 8.3% 19.3 Q1’18 Kum & Go Service Retail 1 5 $3.3 7.0% 9.7 Q1’18 DaVita Medical Office 2 13 $2.3 7.7% 7.4 Q1’18 White Oak Service Retail 9 22 $11.8 9.3% 19.4 Q1’18 Mountain Express Service Retail 15 58 $27.4 8.5% 19.6 Q2’18 Q1 and Q2 2018: Total Closed 39 147 $71.1 8.4% (2) 17.6 (2) Closed Transactions (Q3 2018 ) Property Type Number of Properties Square Feet Purchase Price (1) GAAP Cap Rate Lease Term Remaining Closed Dialysis Portfolio Medical Office 7 65 $16.3 7.5% 9.7 Q3’18 Children of America Education 2 26 $8.5 8.2% 14.9 Q3’18 Burger King Service Retail 1 3 $1.9 7.8% 14.9 Q3’18 White Oak Service Retail 9 18 $5.8 9.0% 19.1 Q3’18 Bob Evans Service Retail 22 112 $51.6 8.3% 18.6 Q3’18 Mountain Express Service Retail 14 44 $29.2 8.7% 19.9 Q3’18 Taco John's Service Retail 7 13 $5.9 8.5% 15.0 Q3’18 Q3 2018: Total Closed 62 281 $119.3 8.2% (2) 16.2 (2) 2018: Total Closed 101 428 $190.4 8.3% (2) 16.7 (2) x AFIN continues to improve its portfolio by focusing on service - oriented retail properties with long term leases in place x Robust acquisition volume of $190 million provides consistent, organic growth to AFIN’s $3.5 billion portfolio 4 2018 Acquisitions Including Q3 2018
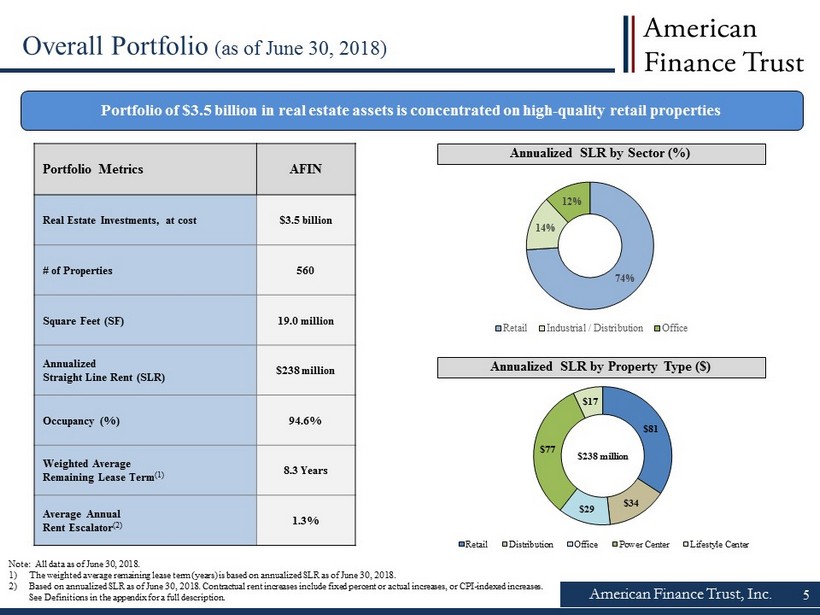
American Finance Trust, Inc. 5 Portfolio of $3.5 billion in real estate assets is concentrated on high - quality retail properties Note: All data as of June 30, 2018. 1) The weighted average remaining lease term (years) is based on annualized SLR as of June 30, 2018. 2) Based on annualized SLR as of June 30, 2018. Contractual rent increases include fixed percent or actual increases, or CPI - indexe d increases. See Definitions in the appendix for a full description. Portfolio Metrics AFIN Real Estate Investments, at cost $3.5 billion # of Properties 560 Square Feet (SF) 19.0 million Annualized Straight Line Rent (SLR) $238 million Occupancy (%) 94.6% Weighted Average Remaining Lease Term (1) 8.3 Years Average Annual Rent Escalator (2) 1.3% Annualized SLR by Property Type ($) $81 $34 $29 $77 $17 Retail Distribution Office Power Center Lifestyle Center $238 million Annualized SLR by Sector (%) 74% 14% 12% Retail Industrial / Distribution Office Overall Portfolio (as of June 30, 2018)
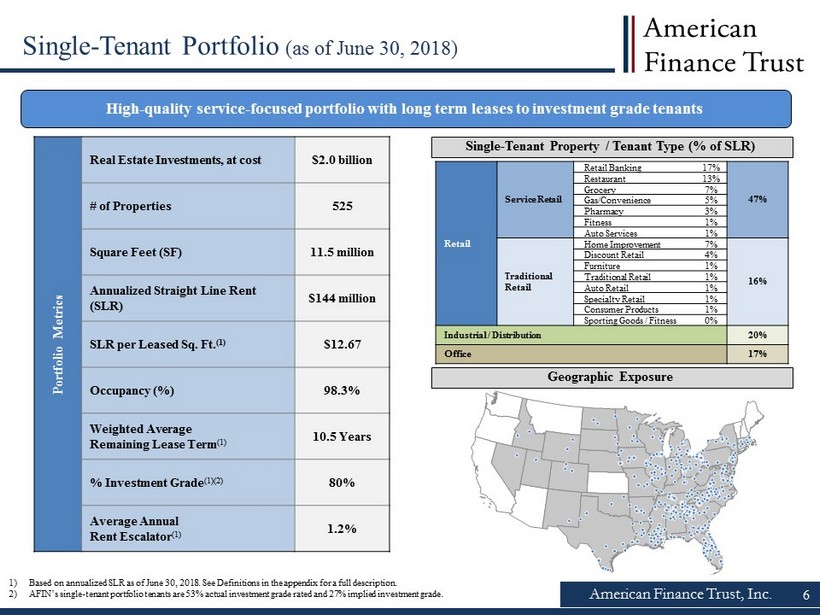
High - quality service - focused portfolio with long term leases to investment grade tenants Portfolio Metrics Real Estate Investments, at cost $2.0 billion # of Properties 525 Square Feet (SF) 11.5 million Annualized Straight Line Rent (SLR) $144 million SLR per Leased Sq. Ft. (1) $12.67 Occupancy (%) 98.3% Weighted Average Remaining Lease Term (1) 10.5 Years % Investment Grade (1)(2) 80% Average Annual Rent Escalator (1) 1.2% American Finance Trust, Inc. 6 Single - Tenant Portfolio (as of June 30, 2018) 1) Based on annualized SLR as of June 30, 2018. See Definitions in the appendix for a full description. 2) AFIN’s single - tenant portfolio tenants are 53% actual investment grade rated and 27% implied investment grade. Single - Tenant Property / Tenant Type (% of SLR) Retail Service Retail Retail Banking 17% 47% Restaurant 13% Grocery 7% Gas/Convenience 5% Pharmacy 3% Fitness 1% Auto Services 1% Traditional Retail Home Improvement 7% 16% Discount Retail 4% Furniture 1% Traditional Retail 1% Auto Retail 1% Specialty Retail 1% Consumer Products 1% Sporting Goods / Fitness 0% Industrial / Distribution 20% Office 17% Geographic Exposure
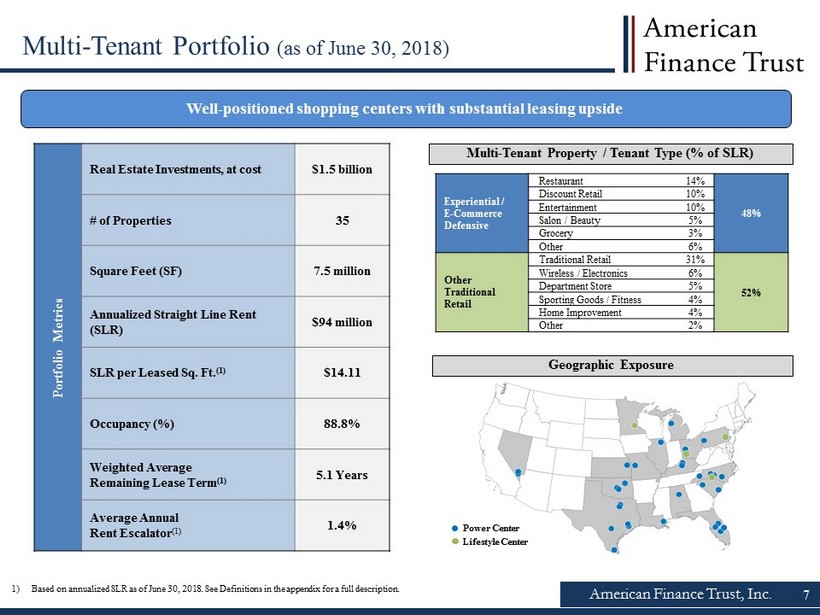
American Finance Trust, Inc. 7 Multi - Tenant Portfolio (as of June 30, 2018) Well - positioned shopping centers with substantial leasing upside Portfolio Metrics Real Estate Investments, at cost $1.5 billion # of Properties 35 Square Feet (SF) 7.5 million Annualized Straight Line Rent (SLR) $94 million SLR per Leased Sq. Ft. (1) $14.11 Occupancy (%) 88.8% Weighted Average Remaining Lease Term (1) 5.1 Years Average Annual Rent Escalator (1) 1.4% Multi - Tenant Property / Tenant Type (% of SLR) Geographic Exposure Power Center Lifestyle Center 1) Based on annualized SLR as of June 30, 2018. See Definitions in the appendix for a full description. Experiential / E - Commerce Defensive Restaurant 14% 48% Discount Retail 10% Entertainment 10% Salon / Beauty 5% Grocery 3% Other 6% Other Traditional Retail Traditional Retail 31% 52% Wireless / Electronics 6% Department Store 5% Sporting Goods / Fitness 4% Home Improvement 4% Other 2%
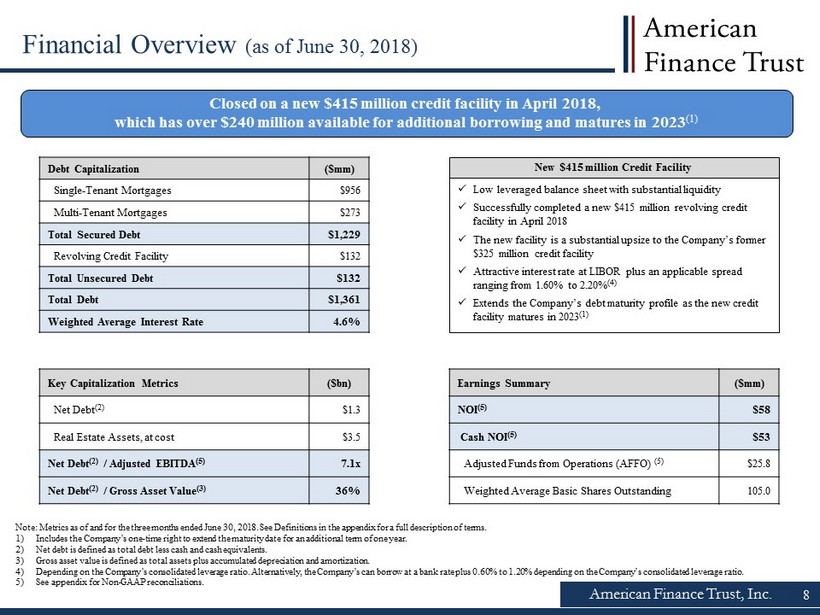
American Finance Trust, Inc. 8 Financial Overview (as of June 30, 2018) Debt Capitalization ($mm) Single - Tenant Mortgages $956 Multi - Tenant Mortgages $273 Total Secured Debt $1,229 Revolving Credit Facility $132 Total Unsecured Debt $132 Total Debt $1,361 Weighted Average Interest Rate 4.6% Key Capitalization Metrics ($bn) Net Debt (2) $1.3 Real Estate Assets, at cost $3.5 Net Debt (2) / Adjusted EBITDA (5) 7.1x Net Debt (2) / Gross Asset Value (3) 36% Note: Metrics as of and for the three months ended June 30, 2018. See Definitions in the appendix for a full description of terms. 1) Includes the Company’s one - time right to extend the maturity date for an additional term of one year. 2) Net debt is defined as total debt less cash and cash equivalents. 3) Gross asset value is defined as total assets plus accumulated depreciation and amortization. 4) Depending on the Company’s consolidated leverage ratio. Alternatively, the Company’s can borrow at a bank rate plus 0.60% to 1.2 0% depending on the Company’s consolidated leverage ratio. 5) See appendix for Non - GAAP reconciliations. New $415 million Credit Facility Closed on a new $415 million credit facility in April 2018, which has over $240 million available for additional borrowing and matures in 2023 (1) Earnings Summary ($mm) NOI (5) $58 Cash NOI (5) $53 Adjusted Funds from Operations (AFFO) (5) $25.8 Weighted Average Basic Shares Outstanding 105.0 x Low leveraged balance sheet with substantial liquidity x Successfully completed a new $415 million revolving credit facility in April 2018 x The new facility is a substantial upsize to the Company’s former $325 million credit facility x Attractive interest rate at LIBOR plus an applicable spread ranging from 1.60% to 2.20% (4) x Extends the Company’s debt maturity profile as the new credit facility matures in 2023 (1)
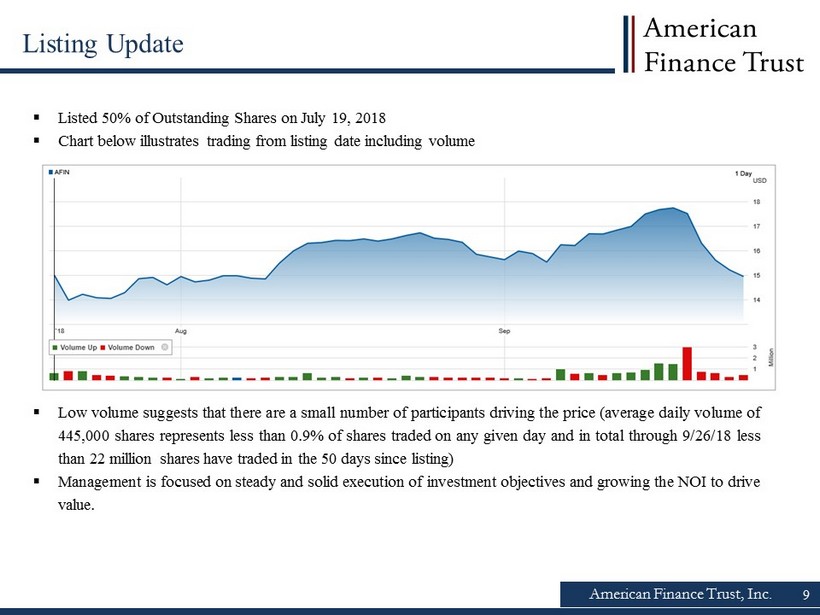
American Finance Trust, Inc. 9 ▪ Listed 50 % of Outstanding Shares on July 19 , 2018 ▪ Chart below illustrates trading from listing date including volume ▪ Low volume suggests that there are a small number of participants driving the price (average daily volume of 445 , 000 shares represents less than 0 . 9 % of shares traded on any given day and in total through 9 / 26 / 18 less than 22 million shares have traded in the 50 days since listing) ▪ Management is focused on steady and solid execution of investment objectives and growing the NOI to drive value . Listing Update
American Finance Trust, Inc. ▪ Index inclusions can provide significant inflows from institutional funds − Inflows can provide additional demand for shares − Key index investors have included Vanguard, Blackrock, Charles Schwab, and State Street − Institutional investors often become some of the largest stockholders following index inclusion ▪ The Russell U.S. Indices have over $9 billion in institutional capital benchmarked against them − Stocks that are added or removed from the indices typically see trading volume increase 45 times higher than average on the rebalancing date (annually in June) − Current Russell 2000 Index inclusion criteria is market cap between $159 million and $3.7 billion ▪ The MSCI US REIT Index (“RMZ”) includes 99% of the public U.S. REIT market cap − Next semi - annual rebalancing in November 2018 − No guarantee of inclusion at a given time, but precedent listings of comparable size suggest AFIN could be eligible. Recent Non - Traded REIT Listings ▪ In three previous non - traded REIT listings (1) , the REITs witnessed substantial inflows in the quarter after the RMZ inclusion took effect − Top institutional buyers increased their positions on average by over $200 million, or ~9% of total shares outstanding in the quarter of the index inclusion 1) Global Net Lease Inc., Healthcare Trust of America and Columbia Property Trust. Index inclusions may provide increased demand for shares 10 Looking Ahead - Impact of Potential Index Inclusions
American Finance Trust, Inc. 11 Frequently Asked Questions What should be done before the October 10 th Conversion Date? ▪ Financial advisors should confirm access to DST Vision and accuracy of information on client accounts, especially Tax IDs . ▪ Financial advisors or shareholders should confirm DRS instructions and necessary forms with your broker dealer or preferred brokerage (for more information on DRS, please see below) . ▪ Submit any account maintenance or transfer requests as soon as possible . Maintenance and transfers will be frozen from October 5 , 2018 until after the Conversion Date . W hat is DRS ? ▪ DRS is an electronic transfer of shares from the transfer agent . ▪ All non - custodial accounts must be sent to brokerage accounts via DRS system . ▪ DRS takes three business days to complete . ▪ DRS is a “pull” process, AFIN cannot “push” shares out to your brokerage account . ▪ Information needed to initiate a DRS request includes : ▪ An account confirmation showing the shares you own (we will mail you a confirmation shortly after the conversion of your Class B - 1 Shares into Class A Shares, this is also available online at www . ar - global . com for shareholders or www . dstvision . com for financial advisors) . ▪ AFIN’s Class A CUSIP : 02607 T 109 ▪ Our Transfer Agent’s DTC Identifier : 07889 ▪ Any other documents your broker may require . YOU MUST CONTACT YOUR BROKER TO DETERMINE THEIR REQUIREMENTS . ▪ Should shareholders wish to sell shares, we recommend that you first move eligible shares to a brokerage account . ▪ Most custodial held accounts will automatically move shares to the custodian . Conversion of Class B - 1 Shares into Class A Tradable Shares
American Finance Trust, Inc. 12 Frequently Asked Questions How do I buy or sell AFIN shares? ▪ AFIN is traded on the Nasdaq under the symbol AFIN and you may buy or sell shares through a brokerage account ▪ A shareholder who wishes to sell shares once converted from Class B - 1 Shares to Class A Shares may do so in one of two ways : ▪ For maximum flexibility, we suggest moving converted Class A Shares into a brokerage account with a firm of your choice . ▪ Alternatively, DST Systems, AFIN’s transfer agent can facilitate a trade for you. Shares sold through this method will be sol d only at current market price and could take up to 24 hours to be executed. Please call 866 - 902 - 0063 for more information. There is a cost to you to sell your shares through the transfer agent. What tax considerations apply? How will cost basis be determined and transmitted? ▪ The conversion of Class B - 1 Shares into Class A Shares is not expected to have any tax impact to current AFIN shareholders or affect their cost basis or original purchase date for purposes of determining long - term capital gains or losses . ▪ Cost basis will be transmitted to brokerage accounts if and when shares are moved out of our transfer agent’s records . ▪ Shareholders should consult a qualified tax professional with any questions about the tax effects of selling Class A Shares received in the conversion and the purchase of fractional Class B - 1 Shares for cash discussed below . Fractional Share Repurchase Many holders of Class B - 1 Shares own fractional shares . The DRS system allows only for whole shares to be moved through its system and does not allow for fractional shares to be transmitted to brokerage accounts . As a result, in connection with the Conversion, AFIN will run a process to purchase any fractional Class B - 1 shares you might have and issue a cash payment to you in a taxable transaction . The price for the fractional Class B - 1 share repurchase will be based on the closing price of Class A Shares on the Nasdaq the day before the Conversion Date . Conversion of Class B - 1 Shares into Class A Tradable Shares

Confidential – Not for Distribution 13 13 Legal Notices
American Finance Trust, Inc. 14 Investment Grade Rating : Includes both actual investment grade ratings of the tenant or implied investment grade. Implied investment grade includes ra tings of tenant parent (regardless of whether or not the parent has guaranteed the tenant’s obligation under the lease) or lease guarantor. Implied investment grad e r atings are determined using a proprietary Moody’s analytical tool, which compares the risk metrics of the non - rated company to those of a company with an actual rating. Ratings information is as of June 15, 2018. Gross Asset Value: Total assets plus accumulated depreciation and amortization. Net Debt: Total debt less cash and cash equivalents. Annualized SLR: Straight line rent which is annualized and calculated using most recent available lease terms as of June 30, 2018. Rent Escalators: Contractual rent increases include fixed percent or actual increases, or CPI - indexed increases. Based on annualized SLR as of J une 30, 2018. Service Retail: AFIN definition of Service Retail includes single - tenant retail properties leased to tenants in the retail banking, restaurant, grocery, pharmacy, gas/convenience, fitness, and auto services sectors. Public REIT comparable service retail exposure is shown as calculated by Green Street Advisors. Traditional Retail: AFIN definition of Traditional Retail includes single - tenant retail properties leased to tenants in the discount retail, home im provement, furniture, specialty retail, auto retail, and sporting goods sectors. Public REIT comparable traditional retail exposure is shown as calculated by Green Street Ad visors. GAAP Cap Rate: GAAP capitalization rate is a rate of return on a real estate investment property based on the expected, annualized straight - lin ed rental income that the property will generate under its existing lease. GAAP capitalization rate is calculated by dividing the annualized straight - lined rental incom e the property will generate (before debt service and depreciation and after fixed costs and variable costs) and the purchase price of the property. The weighted - average GAAP capitalization rate is based upon square feet. FFO: We define FFO, a non - GAAP measure, consistent with the standards set forth in the White Paper on FFO approved by the Board of Go vernors of NAREIT, as revised in February 2004 (the “White Paper”). The White Paper defines FFO as net income or loss computed in accordance with GAAP, but excluding gains or losses from sales of property and real estate related impairments, plus real estate related depreciation and amortization, and after adjustments for unconsolidated partnerships an d j oint ventures. AFFO: In calculating AFFO, we start with FFO, then we exclude certain income or expense items from AFFO that we consider more refle cti ve of investing activities, other non - cash income and expense items and the income and expense effects of other activities that are not a fundamental attribute of our business pl an. These items include early extinguishment of debt and unrealized gains and losses, which may not ultimately be realized, such as gains or losses on derivative instruments and gain s a nd losses on investments. In addition, by excluding non - cash income and expense items such as amortization of above - market and below - market leases intangibles, amortization of deferred fina ncing costs, straight - line rent and equity - based compensation from AFFO, we believe we provide useful information regarding income and expense items which have a direct impac t o n our ongoing operating performance. By providing AFFO, we believe we are presenting useful information that can be used to better assess the sustainability of our ongoing ope rat ing performance without the impacts of transactions that are not related to the ongoing profitability of our portfolio of properties. AFFO presented by us may not be comparable to AFFO r epo rted by other REITs that define AFFO differently. Net Debt / Adjusted EBITDA: Represents ratio of net debt as of June 30, 2018 of $1.3 billion to adjusted EBITDA. Adjusted EBITDA represents an annualizat ion of the Company’s calculation of its adjusted earnings before interest, tax, depreciation and amortization (“Adjusted EBITDA”) for the three mo nth s ended June 30, 2018. The Company believes this amount is a reasonable estimate of the Company’s Adjusted EBITDA for the year ending December 31, 2018. NOI: Defined as a non - GAAP financial measure equal to net income (loss), the most directly comparable GAAP financial measure, less di scontinued operations, interest, other income and income from preferred equity investments and investment securities, plus corporate general and administrative expense, acquis iti on and transaction - related expenses, depreciation and amortization, other non - cash expenses and interest expense. NOI is adjusted to include our pro rata share of NOI from unconsolid ated joint ventures. Cash NOI: We define Cash NOI as net operating income excluding amortization of above/below market lease intangibles and straight - line adju stments that are included in GAAP lease revenues. Definitions
American Finance Trust, Inc. 15 This presentation includes estimated projections of future operating results. These projections were not prepared in accordan ce with published guidelines of the SEC or the guidelines established by the American Institute of Certified Public Accountants for p rep aration and presentation of financial projections. This information is not fact and should not be relied upon as being necessarily in dic ative of future results; the projections were prepared in good faith by management and are based on numerous assumptions that may prov e t o be wrong. Important factors that may affect actual results and cause the projections to not be achieved include, but are not lim ite d to, risks and uncertainties relating to the company and other factors described in the “Risk Factors” section of the Company's Annual R epo rt on Form 10 - K for the year ended December 31, 2017, the Company's Quarterly Reports on Form 10 - Q and in future filings with the SEC. The projections also reflect assumptions as to certain business decisions that are subject to change. As a result, actual res ult s may differ materially from those contained in the estimates. Accordingly, there can be no assurance that the estimates will be realized. Th is presentation also contains estimates and information concerning our industry, including market position, market size, and gro wth rates of the markets in which we participate, that are based on industry publications and reports. This information involves a number of assumptions and limitations, and you are cautioned not to give undue weight to these estimates. We have not independently ver ifi ed the accuracy or completeness of the data contained in these industry publications and reports. The industry in which we operate i s s ubject to a high degree of uncertainty and risk due to variety of factors, including those described in the “Risk Factors” section of t he Company's Annual Report on Form 10 - K for the year ended December 31, 2017, the Company's Quarterly Reports on Form 10 - Q and in future filings with the SEC. These and other factors could cause results to differ materially from those expressed in these publicat ion s and reports. Projections
American Finance Trust, Inc. 16 Certain statements made in this presentation are “forward - looking statements” (as defined in Section 21E of the Exchange Act), w hich reflect the expectations of the Company regarding future events. The forward - looking statements involve a number of risks, uncertainties and other factors that could ca use actual results to differ materially from those contained in the forward - looking statements. Such forward - looking statements include, but are not limited to, market and other e xpectations, objectives, and intentions, as well as any other statements that are not historical facts. Our potential risks and uncertainties are presented in the section titled “Item 1A - Risk Factors” disclosed in our Annual Report on Form 10 - K for the year ended December 31, 2017 and our Quarterly Reports on Form 10 - Q filed from time to time. We disclaim any obligation to update and revise statements contained in these materials to reflect changed assumptions, the occurrence of unanticipated events or changes to future operating results over time, unless required by law. Th e following are some of the risks and uncertainties relating to us, although not all risks and uncertainties, that could cause our actual results to differ materially from those pr esented in our forward - looking statements: ▪ The anticipated benefits from the merger with American Realty Capital - Retail Centers of America, Inc. (“RCA”) may not be reali zed or may take longer to realize than expected. ▪ All of our executive officers are also officers, managers, employees or holders of a direct or indirect controlling interest in the Advisor or other entities under common control with AR Global Investments, LLC (the successor business to AR Capital, LLC, “AR Global”). As a result, our executive officers , t he Advisor and its affiliates face conflicts of interest, including significant conflicts created by the Advisor’s compensation arrangements with us and other investment pro gra ms advised by affiliates of AR Global and conflicts in allocating time among these entities and us, which could negatively impact our operating results. ▪ The trading price of our Class A common stock may fluctuate and no public market currently exists for shares of our two other cl asses of outstanding stock, our Class B - 1 common stock and our Class B - 2 common stock. ▪ Lincoln Retail REIT Services, LLC (“Lincoln”) and its affiliates, which provide services to the Advisor in connection with ou r r etail portfolio, faces conflicts of interest in allocating its employees’ time between providing real estate - related services to the Advisor and other programs and activities i n which they are presently involved or may be involved in the future. ▪ The performance of our retail portfolio is linked to the market for retail space generally and factors that may impact our re tai l tenants, such as the increasing use of the Internet by retailers and consumers. ▪ We depend on tenants for our rental revenue and, accordingly, our rental revenue is dependent upon the success and economic v iab ility of our tenants. ▪ We have not generated, and in the future may not generate, operating cash flows sufficient to fund all of the distributions w e p ay our stockholders, and, as such, we may be forced to fund distributions from other sources, including borrowings, which may not be available on favorable terms, or at a ll. ▪ We may be unable to pay or maintain cash distributions at the current rate or increase distributions over time. ▪ We are obligated to pay fees, which may be substantial, to the Advisor and its affiliates. ▪ We are subject to risks associated with any dislocation or liquidity disruptions that may exist or occur in the credit market s o f the United States of America. ▪ We may fail to continue to qualify to be treated as a real estate investment trust for U.S. federal income tax purposes (“REI T”) , which would result in higher taxes, may adversely affect our operations and would reduce the value of an investment in our common stock and our cash available for di str ibutions. ▪ We may be deemed by regulators to be an investment company under the Investment Company Act of 1940, as amended (the “Investm ent Company Act”), and thus subject to regulation under the Investment Company Act. Forward - Looking Statements

Confidential – Not for Distribution 17 17 Appendix
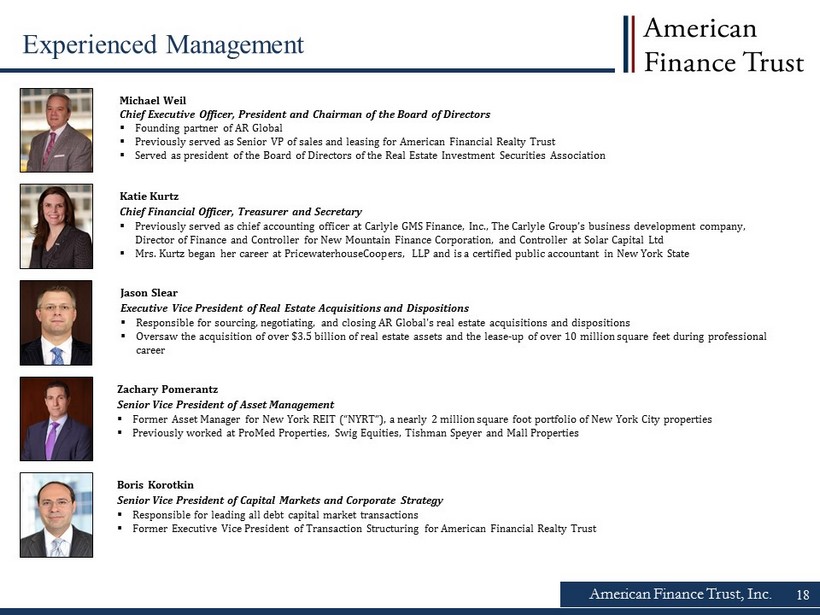
American Finance Trust, Inc. 18 Jason Slear Executive Vice President of Real Estate Acquisitions and Dispositions ▪ Responsible for sourcing, negotiating, and closing AR Global's real estate acquisitions and dispositions ▪ Oversaw the acquisition of over $3.5 billion of real estate assets and the lease - up of over 10 million square feet during professional career Michael Weil Chief Executive Officer, President and Chairman of the Board of Directors ▪ Founding partner of AR Global ▪ Previously served as Senior VP of sales and leasing for American Financial Realty Trust ▪ Served as president of the Board of Directors of the Real Estate Investment Securities Association Katie Kurtz Chief Financial Officer, Treasurer and Secretary ▪ Previously served as chief accounting officer at Carlyle GMS Finance, Inc., The Carlyle Group’s business development company, Director of Finance and Controller for New Mountain Finance Corporation, and Controller at Solar Capital Ltd ▪ Mrs. Kurtz began her career at PricewaterhouseCoopers, LLP and is a certified public accountant in New York State Zachary Pomerantz Senior Vice President of Asset Management ▪ Former Asset Manager for New York REIT (“NYRT”), a nearly 2 million square foot portfolio of New York City properties ▪ Previously worked at ProMed Properties, Swig Equities, Tishman Speyer and Mall Properties Boris Korotkin Senior Vice President of Capital Markets and Corporate Strategy ▪ Responsible for leading all debt capital market transactions ▪ Former Executive Vice President of Transaction Structuring for American Financial Realty Trust Experienced Management
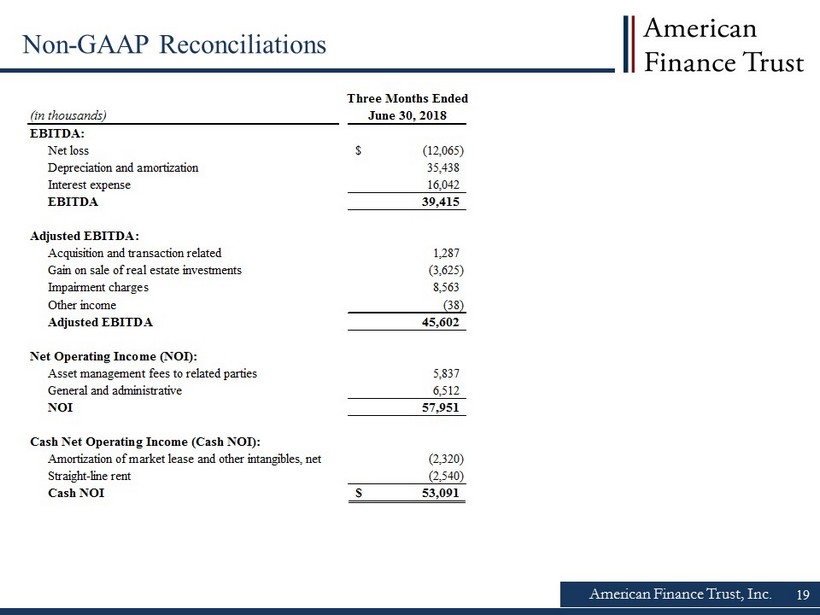
American Finance Trust, Inc. 19 Three Months Ended June 30, 2018 EBITDA: Net loss (12,065)$ Depreciation and amortization 35,438 Interest expense 16,042 EBITDA 39,415 Adjusted EBITDA: Acquisition and transaction related 1,287 Gain on sale of real estate investments (3,625) Impairment charges 8,563 Other income (38) Adjusted EBITDA 45,602 Net Operating Income (NOI): Asset management fees to related parties 5,837 General and administrative 6,512 NOI 57,951 Cash Net Operating Income (Cash NOI): Amortization of market lease and other intangibles, net (2,320) Straight-line rent (2,540) Cash NOI 53,091$ (in thousands) Non - GAAP Reconciliations
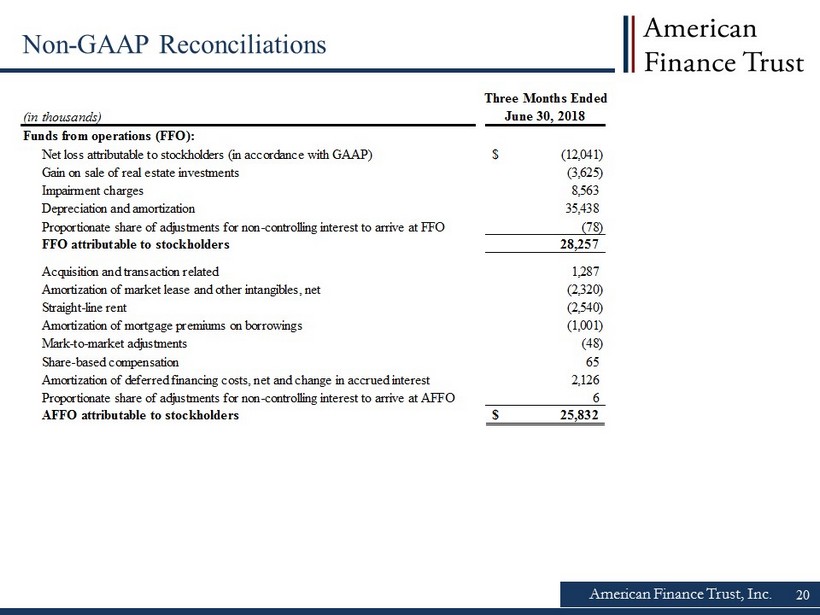
American Finance Trust, Inc. 20 Three Months Ended June 30, 2018 Funds from operations (FFO): Net loss attributable to stockholders (in accordance with GAAP) (12,041)$ Gain on sale of real estate investments (3,625) Impairment charges 8,563 Depreciation and amortization 35,438 Proportionate share of adjustments for non-controlling interest to arrive at FFO (78) FFO attributable to stockholders 28,257 Acquisition and transaction related 1,287 Amortization of market lease and other intangibles, net (2,320) Straight-line rent (2,540) Amortization of mortgage premiums on borrowings (1,001) Mark-to-market adjustments (48) Share-based compensation 65 Amortization of deferred financing costs, net and change in accrued interest 2,126 Proportionate share of adjustments for non-controlling interest to arrive at AFFO 6 AFFO attributable to stockholders 25,832$ (in thousands) Non - GAAP Reconciliations